


fullvalue/E+ via Getty Images
There are many reasons why the truck is one of the most popular vehicles in the world. One of these is that they are built tough and can easily be equipped with attachments that can be used to create additional value for the truck owner. One business dedicated to providing these types of attachments and other equipment for the commercial work truck market is Douglas Dynamics (NYSE:PLOW). Prior to the COVID-19 pandemic, the business had done well to grow its top line. Profitability had been rather mixed, but generally positive. Now with the pandemic coming to a close, the picture for the business does continue to improve. Having said that, the crisis really did push the company’s goals back by about two years. In the grand scheme of things, shares of the company do look to be fairly priced relative to similar firms. Though if you look at the picture from an absolute perspective instead, shares might be a bit cheap at this point in time.
A valuable equipment manufacturer
Today, Douglas Dynamics operates as a manufacturer and upfitter of commercial work truck attachments and equipment, with the company serving as the home of some of the best-selling brands in the industry. Operationally, the company does have two different segments that it runs. The largest of these is the Work Truck Attachments segment. According to management, this segment includes the production and sale of snow and ice control attachments and other products under the Fisher, Snowex, and Western brand names. More specifically, the company’s products also include sand and salt spreaders for light trucks, as well as snowplows.
Based on the data provided, 84% of the revenue associated with this particular segment came specifically from snow and ice control equipment. The other 16% is attributable to various parts and accessories the company sells. During the company’s 2021 fiscal year, this particular segment made up 60.2% of the company’s overall revenue and 97.3% of its profits. Interestingly, the picture was not always this favorable for this particular segment. Just two years earlier, in 2019, this particular part of the business made up 51.4% of sales and a more modest 74.7% of profits. A deterioration in profits associated with the company’s other segment is the result of the outsized portion of profits that Work Truck Attachments reports today.
The other segment the company has is called Work Truck Solutions. Through this segment, the company upfits its products to various vehicles. What this means is that the company merely attaches the equipment, truck bodies, racking, and storage solutions to a vehicle’s chassis. On top of this, the company also offers turnkey solutions to government agencies like the Department of Transportation. In all though, the company’s revenue stream seems to be rather diverse. It boasts about 2,800 customers across the truck equipment category. During the company’s 2021 fiscal year, this segment made up 39.8% of revenue and just 2.7% of profits. Two years earlier, this segment made up 48.6% of revenue and a more impressive 25.3% of profits.

Author – SEC EDGAR Data
In the years leading up to the pandemic, sales at Douglas Dynamics expanded consistently, rising from $474.9 million to $571.7 million. The pandemic pushed revenue down to $480.2 million. But much of this recovered in 2021, with sales climbing to $541.5 million. For the 2022 fiscal year, management believes that sales should climb higher still, ultimately coming in at between $570 million and $630 million. At the midpoint, this implies revenue of $600 million, which is about 10.8% higher than what the company generated in 2021.
There are other measures of success that are more important than revenue growth. One of these is the amount of profit the company generates. Unfortunately, this has been more volatile than revenue has. For instance, in 2017, net income at the company totaled $55.3 million. This dropped to $43.9 million before climbing back to $49.2 million in 2019. In 2020, the company lost $86.6 million. But just as was the case with the revenue picture, this decline was short-lived, with profits coming in at $30.7 million last year. It is worth noting that management, back in late 2019, forecasted that by the end of 2023, the company would be generating earnings per share of $3. This would imply net income of $68.94 million. Management still believes that this number is achievable. But they now believe that the pandemic set their goals back two years, meaning that by 2025, profits should climb to this aforementioned amount.
In addition to looking at net income, we should also discuss other metrics that relate to profitability. One of these is operating cash flow. Like net income, operating cash flow has also been volatile. But the good news for investors is that the range of volatility has been fairly limited. Between 2017 and 2021, it remained in a fairly narrow range of between $53.4 million and $77.3 million. The low point was in 2020. And in 2021, it came in at $60.5 million. Even if we adjust for changes in working capital, the range is fairly similar of between $52 million and $78.1 million. In 2021, this figure totaled $65.9 million. And finally, we should also look at EBITDA. This, too, has been in a narrow range. But at least it demonstrates an overall trend. Between 2017 and 2019, it rose from $90.9 million to $108.1 million. The figure then dropped to $74.9 million a year later before inching up to $79.5 million in 2021.
When it comes to the 2022 fiscal year, management has provided some guidance when it comes to net income and EBITDA. Although to be fair, the range for net profits is rather ridiculous, with earnings per share of between $1.25 and $2.15. Taking the midpoint, this implies net profits of $39.1 million for the year. Meanwhile, EBITDA for the company should be between $70 million and $100 million. This implies a midpoint of $85 million. Management gave no guidance when it came to operating cash flow. But if we assume the same year-over-year growth rate that EBITDA should achieve will be applied to it, then investors should anticipate operating cash flow for the year of about $70.5 million on an adjusted basis.
Author – SEC EDGAR Data
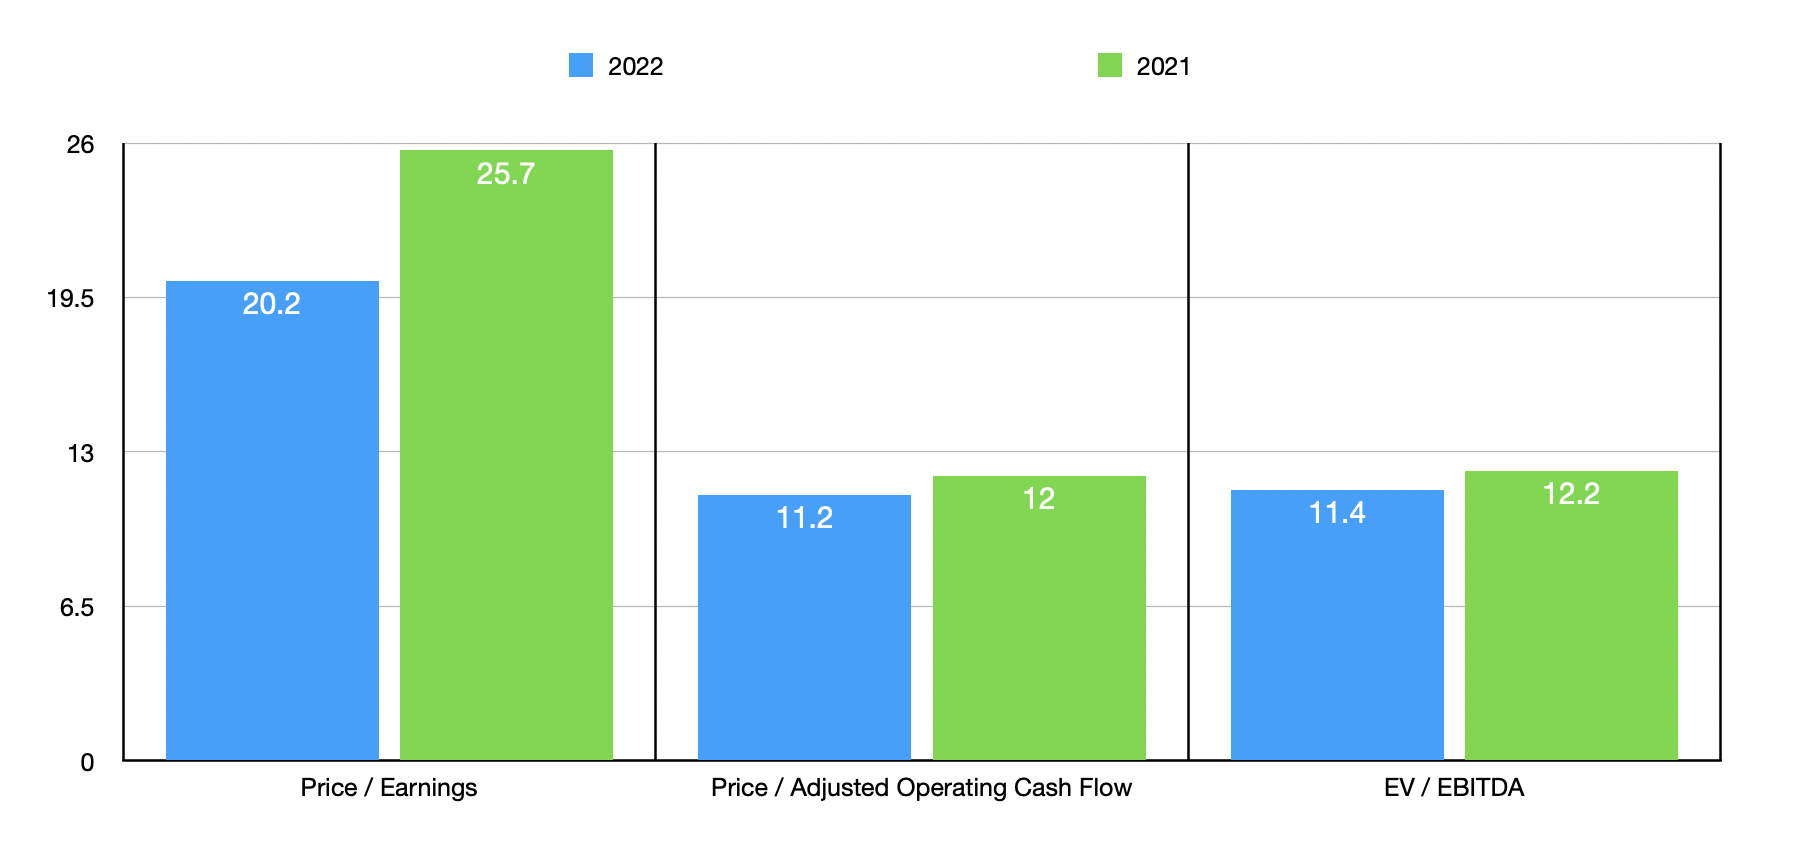
Taking these figures, we can effectively price the business. Using the 2021 results for the company, the price-to-earnings multiple of the firm is a rather lofty 25.7. However, this drops some to 20.2 if we rely on 2022 estimates. The price to adjusted operating cash flow multiple isn’t even 12, with that figure lowering to 11.2 if we rely on 2022 estimates. And the EV to EBITDA multiple of the company is 12.2. This ultimately drops to 11.4 if we rely on the 2022 estimates. To put the pricing of the company into perspective, I decided to compare it to five similar firms. On a price-to-earnings basis, these companies ranged from a low of 3.8 to a high of 1,518. Using the EV to EBITDA approach, meanwhile, gives a range of between 2.4 and 43.2. In both of these scenarios, two of the five companies were cheaper than Douglas Dynamics. I then performed the same analysis using the price to operating cash flow approach. One of the companies did not have a positive reading. Of the four that did, the range is between 5.8 and 133. Three of the four applicable firms were cheaper than our prospect.
| Company | Price / Earnings | Price / Operating Cash Flow | EV / EBITDA |
| Douglas Dynamics | 25.7 | 12.0 | 12.2 |
| Hyliion Holdings (HYLN) | 3.8 | N/A | 2.4 |
| Wabash National (WNC) | 1,518 | 9.3 | 15.4 |
| REV Group (REVG) | 20.8 | 5.8 | 11.2 |
| Blue Bird Corporation (BLBD) | 40.2 | 8.4 | 43.2 |
| Astec Industries (ASTE) | 55.0 | 133.0 | 18.2 |
Takeaway
All the data shown here indicates to me that Douglas Dynamics, like many companies, was negatively affected by the COVID-19 pandemic. It truly set the company back two years according to management. Prior to that time, the picture had been generally solid and improving for the company. Long term, I suspect this trend will develop again. As for the pricing of the company, shares do look rather lofty on a price-to-earnings basis. And the company looks fairly valued relative to similar firms. But when looked at through the lens of cash flow and EBITDA, shares might be slightly underpriced. Given management’s forecast of continued growth and earnings, particularly with the $3 per share target that it hopes to achieve by 2025, I find myself slightly bullish on the business. But this only remains the case if management can come through on their forecasts.
Be the first to comment