

PM Images
Despite the hawkish news from Fed Chair Jerome Powell, the markets rallied on Friday, but the S&P 500 still declined -2.86% while the Nasdaq fell -4.99%. My interpretation of his speech was that a pivot is not in the cards anytime soon, and left no room for interpretation about his hawkish stance. Many outlets have speculated about a recession in 2023, and the investing landscape is a complete 180 compared to 2021. Apple (AAPL) reported that they generated $99.8 billion of net income in their 2022 fiscal year, which is the most I have seen for a company, yet instead of this being celebrated, shares of AAPL have declined -11.15% (-$17.36) since reporting earnings on 10/28/22. Until AAPL bottoms, I don’t see the market bottoming, and while the estimates told a story of earnings increasing in 2023, the combination of rising rates, inflation, and a possible recession could extend the current investing environment well into 2023. While many portfolios are underwater, and the indexes are back into bear market territory, the Dividend Harvesting Portfolio is down -3.99% from its invested capital. I will continue to allocate $100 per week, increase my projected dividend income and dollar cost average into many long-term positions while market sentiment declines.
In week 88, the markets took a dive, but the Dividend Harvesting Portfolio was relatively flat week over week (WOW) as it declined by -0.16%. There was $23.40 in dividend income generated from 21 individual positions, and in the month of October, the Dividend Harvesting Portfolio generated $36.10 of dividend income, an increase of 113.11% YoY. In week 88, I added to my positions in the JPMorgan Equity Premium Income ETF (JEPI), Intel Corporation (INTC), and AGNC Investment Corp. (AGNC). The Dividend Harvesting Portfolio is now generating $654.02 in projected annual income thanks to reinvesting all dividends, addition to new positions, and dividend increases from companies like Simon Property Group (SPG). There are 16 weeks left in year 2 of the Dividend Harvesting Portfolio, and it has officially exceeded $650 of projected annual income.
Steven Fiorillo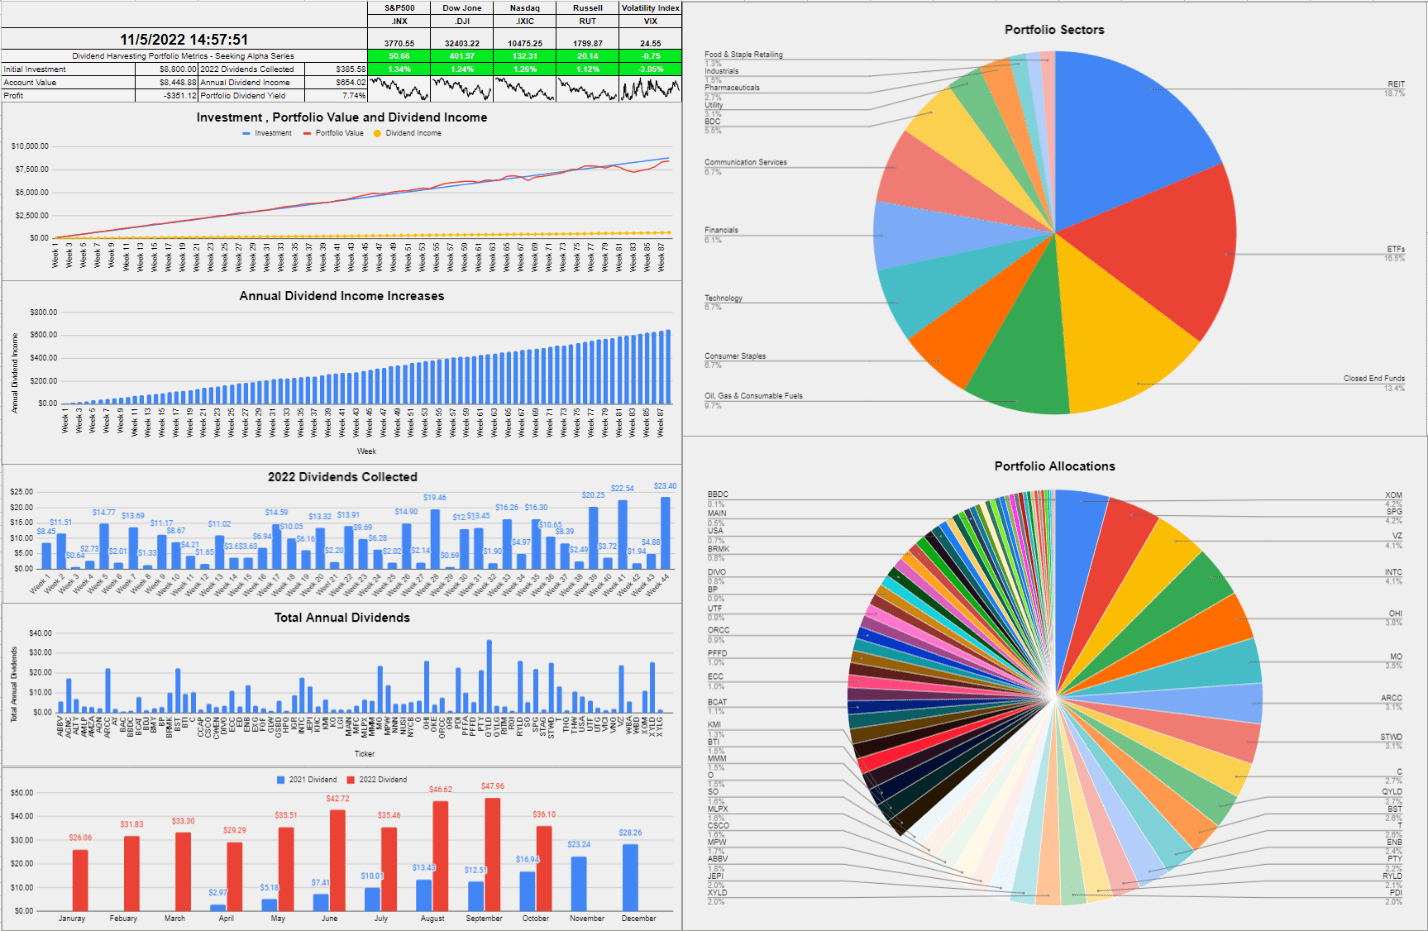
I allocate capital toward big tech, funds, dividends, and growth outside of my retirement accounts. These are not my only investments, but I did open a separate account, so I could easily track and document this series. I intentionally created broad diversification throughout the Dividend Harvesting portfolio so I could benefit from sector rotations and mitigate my downside risk. Investors who are too exposed to growth companies or large-cap tech have gotten crushed as the investment landscape changes. On the growth and tech side of my investments, I am feeling the pain as some of my favorite companies, including Alphabet (GOOGL, GOOG), Amazon (AMZN), and Meta Platforms (META), have been taken to the woodshed.
I am going to address a question that continues to surface. I am not trying to beat the market with this portfolio. I love index funds and am invested in several index funds. I love dividend investing due to the stream of cash flow it generates. I don’t want 100% of my assets outside of real estate tied to an S&P index fund. I have created a personal investment strategy that works to achieve my investment goals, and having a stream of income generated from dividends is part of my investment strategy. Low-cost index funds are one of the best investments anyone can make in my opinion, and the Dividend Harvesting portfolio is not meant to be a substitute for an index fund. I have read many questions about dividend investing and wanted to start a portfolio from the ground up and document its progress to disprove many misconceptions, including that you need a large amount of seed capital to make dividend investing work for you.
This series has never been about hitting a target yield, generating a certain amount of profit, or beating the market. I had two specific goals with this series. The first was to create a blueprint for constructing a dividend portfolio by documenting the journey starting from the beginning. The second goal was to illustrate how allocating capital each week toward investing, regardless of the amount, would be beneficial in the long run.
Too many people are under the illusion that you need tens of thousands or even hundreds of thousands to benefit from investing. Instead of using my real dividend portfolio as an example, I decided to start a new account, fund it with $100, and add $100 weekly, providing a step-by-step guide to dividend investing. This methodology doesn’t have to be used for dividend investing, and it could be as simple as an S&P index fund or a Total Market fund. Hopefully, this series is inspiring people to invest in their future to attain financial freedom.
A Historical Recap of the Dividend Harvesting Portfolio’s Investment Principles and Historical Performance
Investment Objectives
- Income generation
- Downside mitigation through diversification
- Capital appreciation
Below are the fundamental rules I have put in place for this Portfolio:
- Allocate $100 weekly to this Portfolio
- Only invest in dividend-producing investments
- No position can exceed 5% of the Portfolio
- No sector can exceed 20% of the Portfolio
- All dividends & distributions are to be reinvested
Below is a chart that extends from week 1 through the current week to illustrate the Dividend Harvesting Portfolio’s Progression
- Blue line is my initial investment $100 in week 1, $1,000 in week 10, etc.
- Red line is the account value at the end of each week
- Yellow line is the annual dividend income the Dividend Harvesting Portfolio was projected to generate after that week’s investments and dividends reinvested
Steven Fiorillo, Seeking Alpha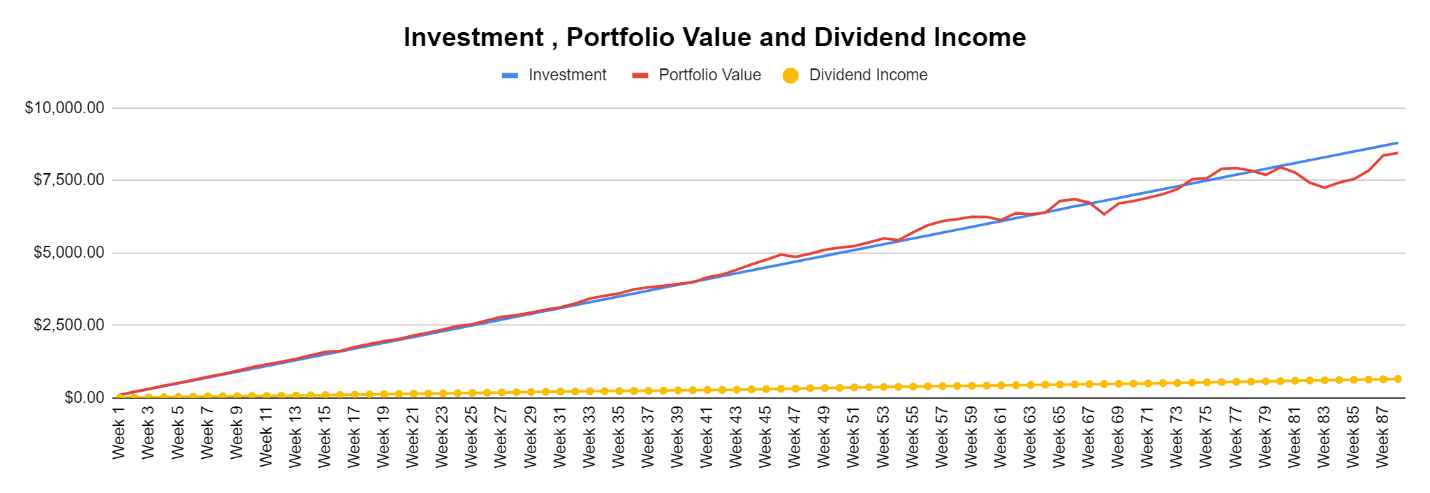
The Dividend Harvesting Portfolio Dividend Section
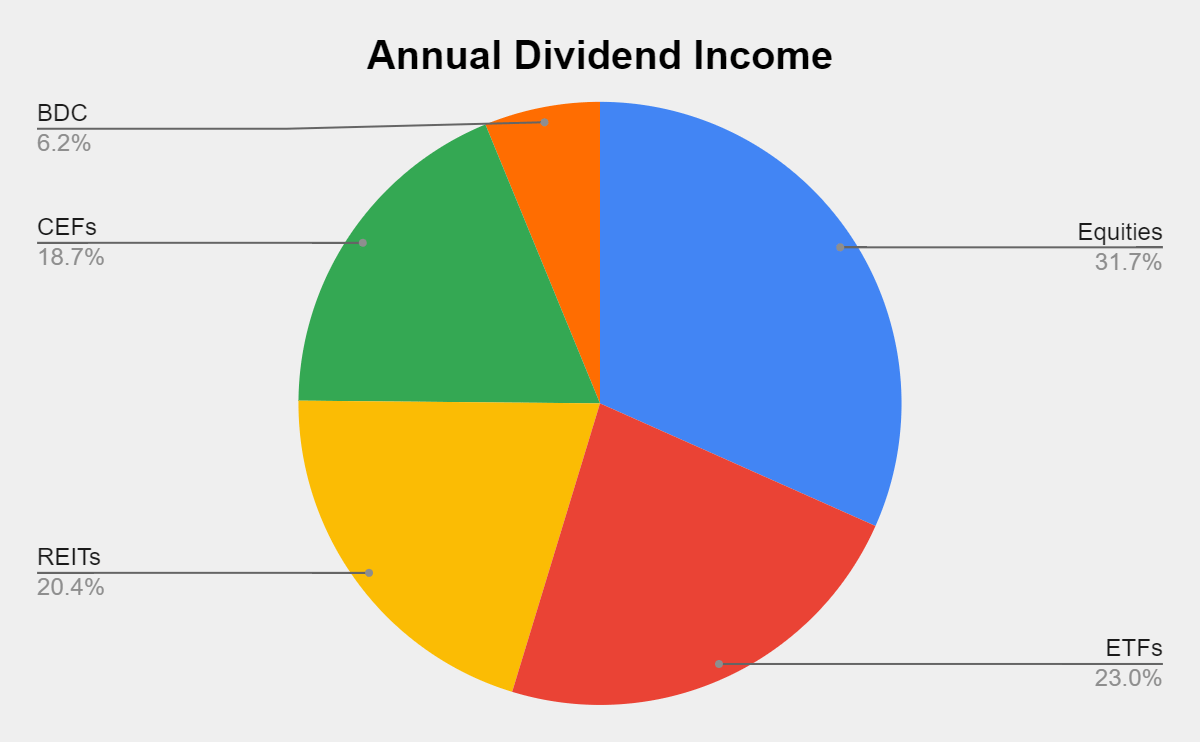
Here is how much dividend income is generated per investment basket:
- Equities $207.09 (31.66%)
- ETFs $150.69 (23.04%)
- REITs $133.68 (20.44%)
- CEFs $121.98 (18.65%)
- BDCs $40.58 (6.21%)
Steven Fiorillo, Seeking Alpha Steven Fiorillo, Seeking Alpha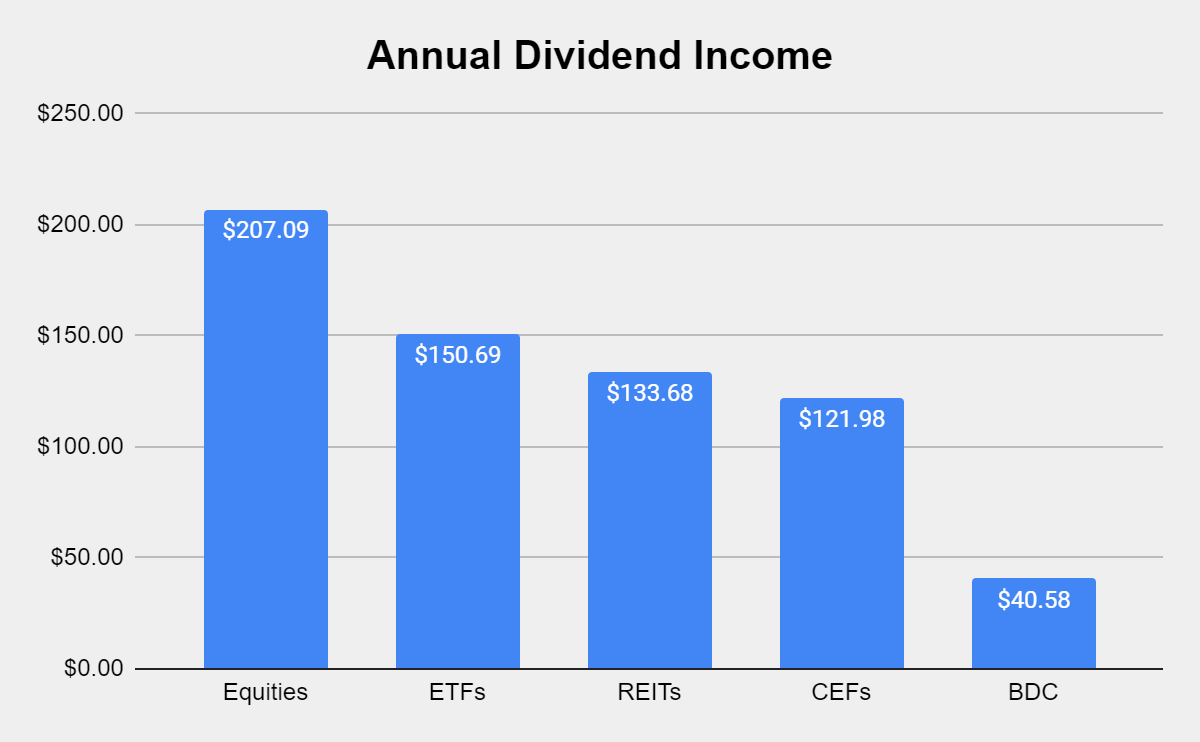
Collecting dividends can serve many functions in a portfolio. Some investors utilize dividends to supplement their income and live off. I am building a dividend portfolio for myself 30 years into the future. Since I am reinvesting every dividend, they serve multiple purposes today. In 2022 alone, I have collected $385.58 in dividend income from 441 dividends across 44 weeks. This has allowed the Dividend Harvesting portfolio to stay in the black while growing the snowball effect.
These dividends allow me to gain additional equity in my investments while increasing my future cash flow in down markets. This style of investing isn’t for everyone, but if you’re looking to generate consistent cash flow while mitigating downside risk, this method has worked for me. I am hoping to collect between $450 and $500 in dividends in 2022, which will be reinvested, and finish the year generating >$700 in annual dividends.
Steven Fiorillo, Seeking Alpha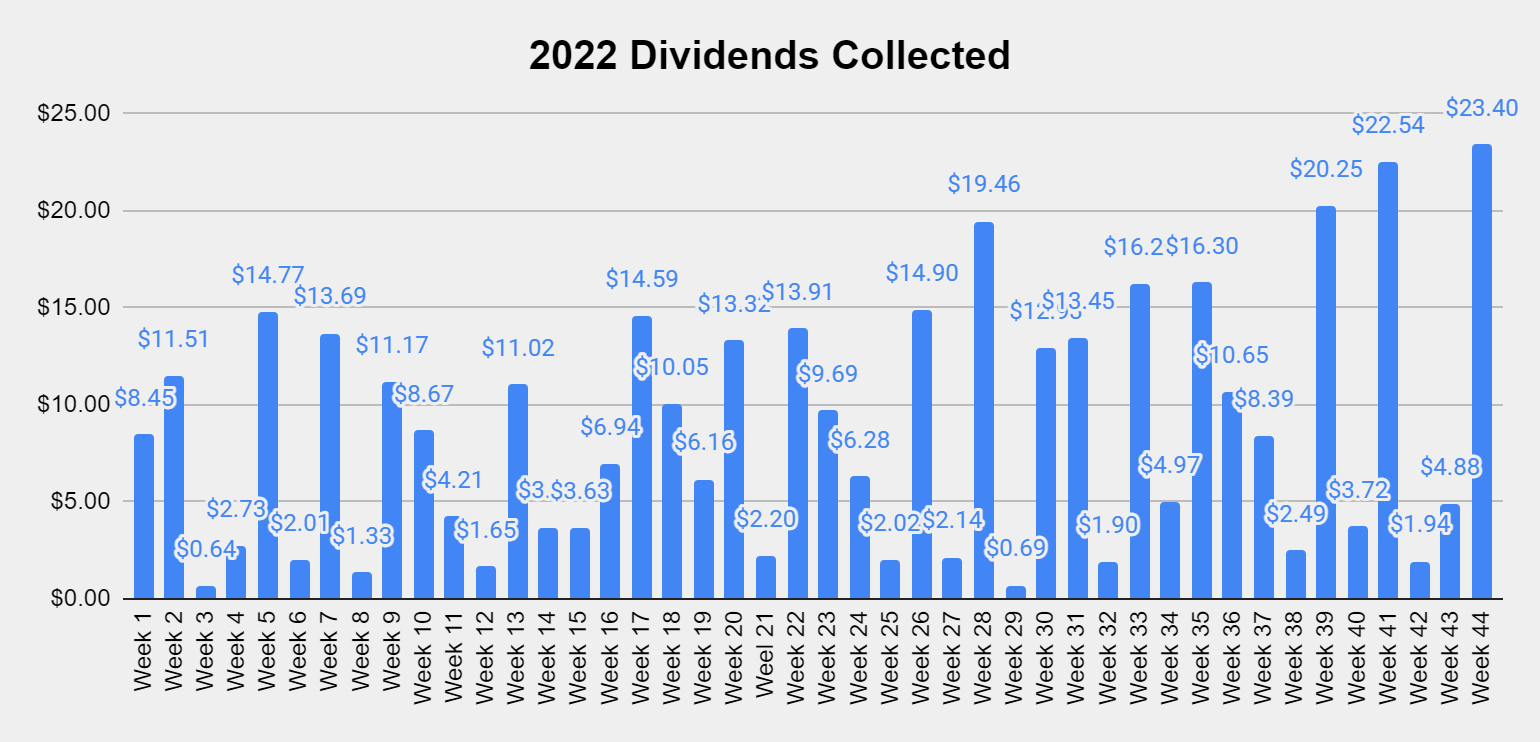
October is finally in the books, and the Dividend Harvesting Portfolio generated $36.10 in dividend income. This was a 113.11% YoY increase.
Steven Fiorillo, Seeking Alpha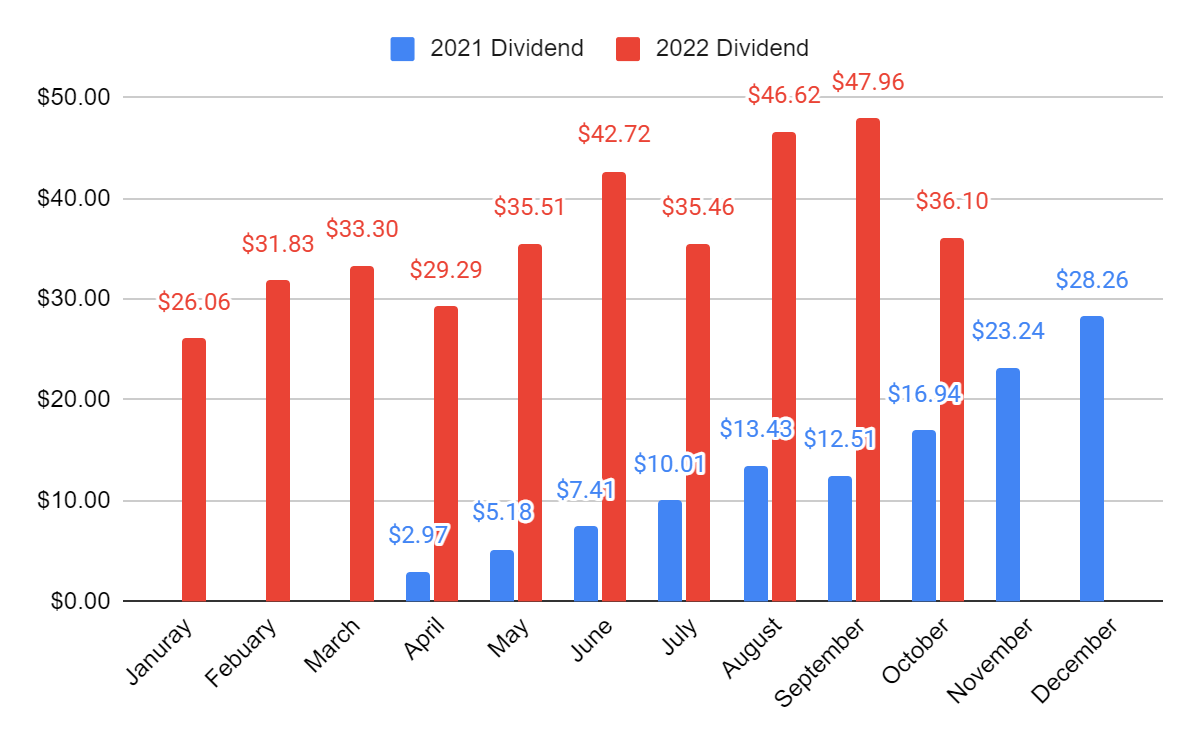
The Dividend Harvesting Portfolio is producing 588 annual dividends. I am not expecting this to change as I am focusing on dollar cost averaging on current positions.
Steven Fiorillo, Seeking Alpha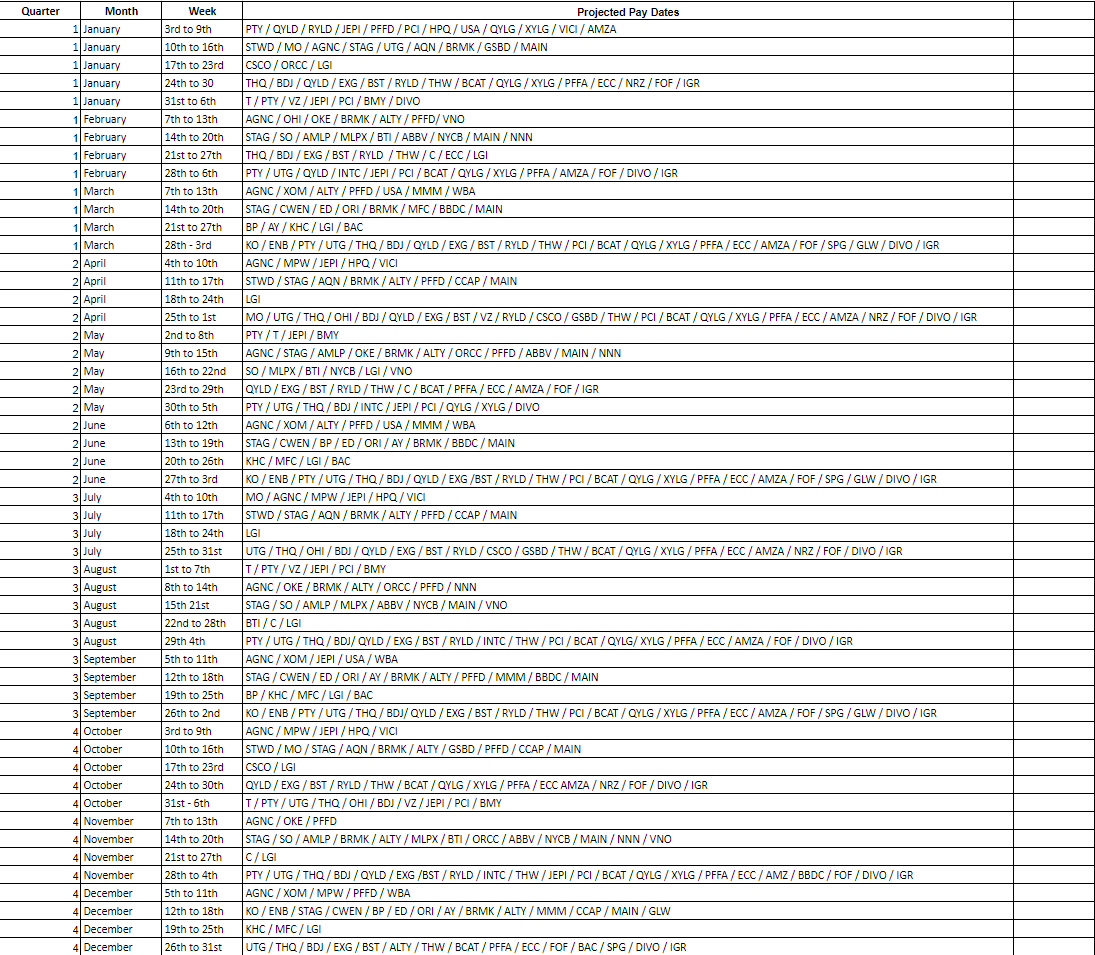
The goal of generating enough income from the dividends to purchase an additional share per year has been the never-ending project of this portfolio. There are now 12 total positions generating at least 100% of their share value in dividends within the Dividend Harvesting portfolio. This could fluctuate due to market volatility, but I am looking to have as many positions generating at least 1 share annually from their dividends as I can.
Steven Fiorillo, Seeking Alpha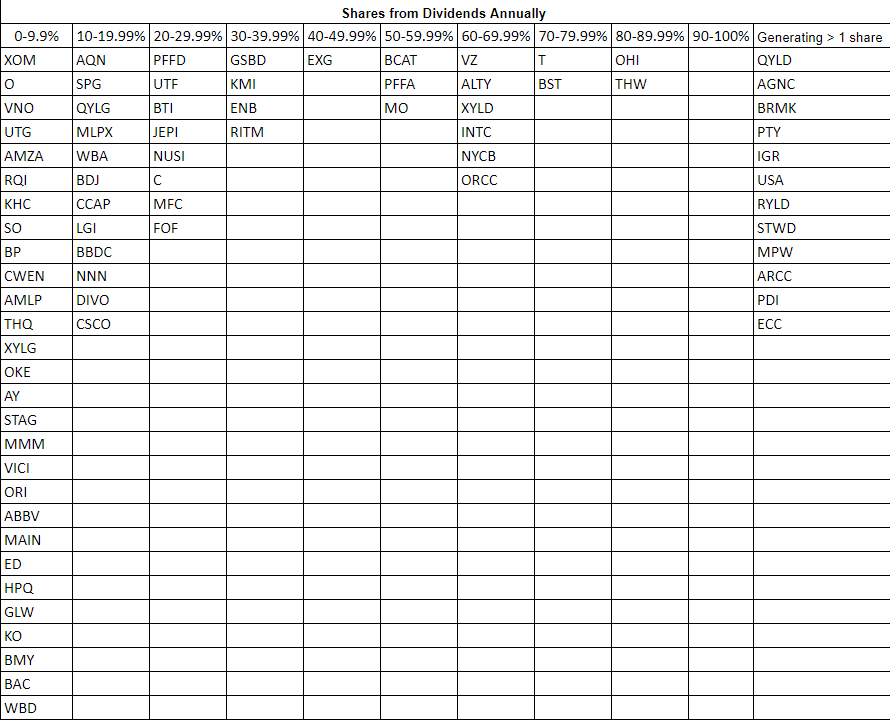
The Dividend Harvesting Portfolio Composition
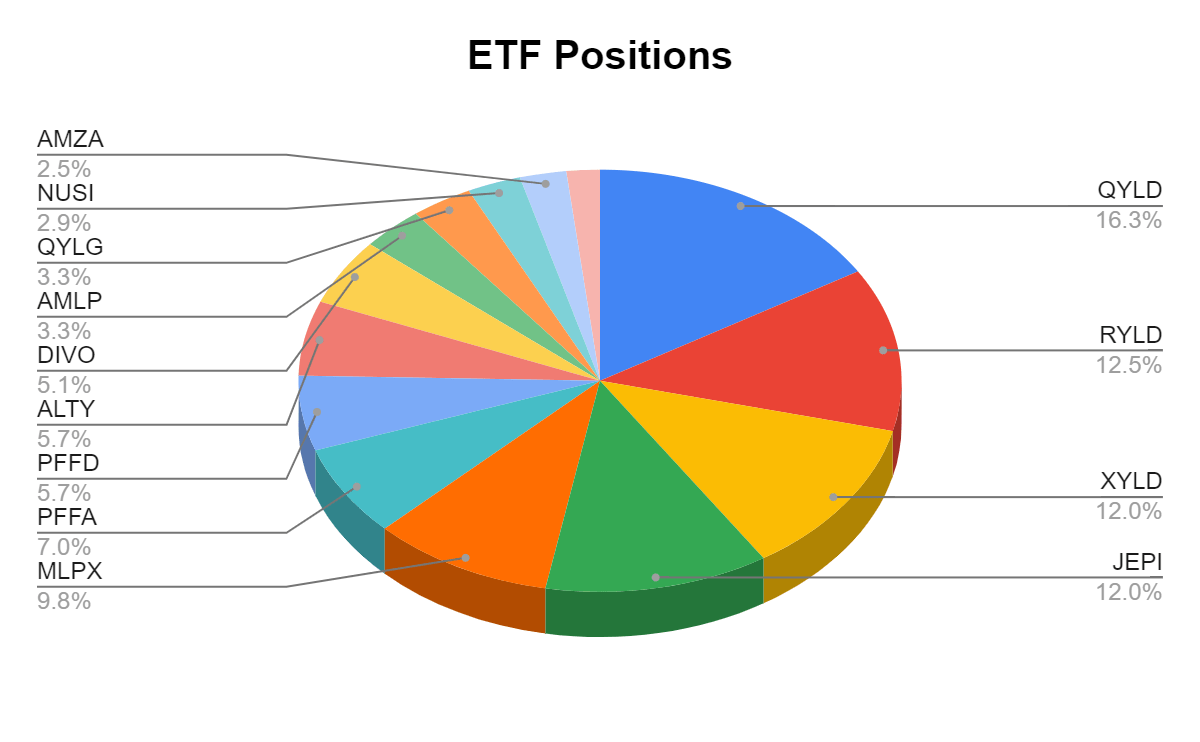
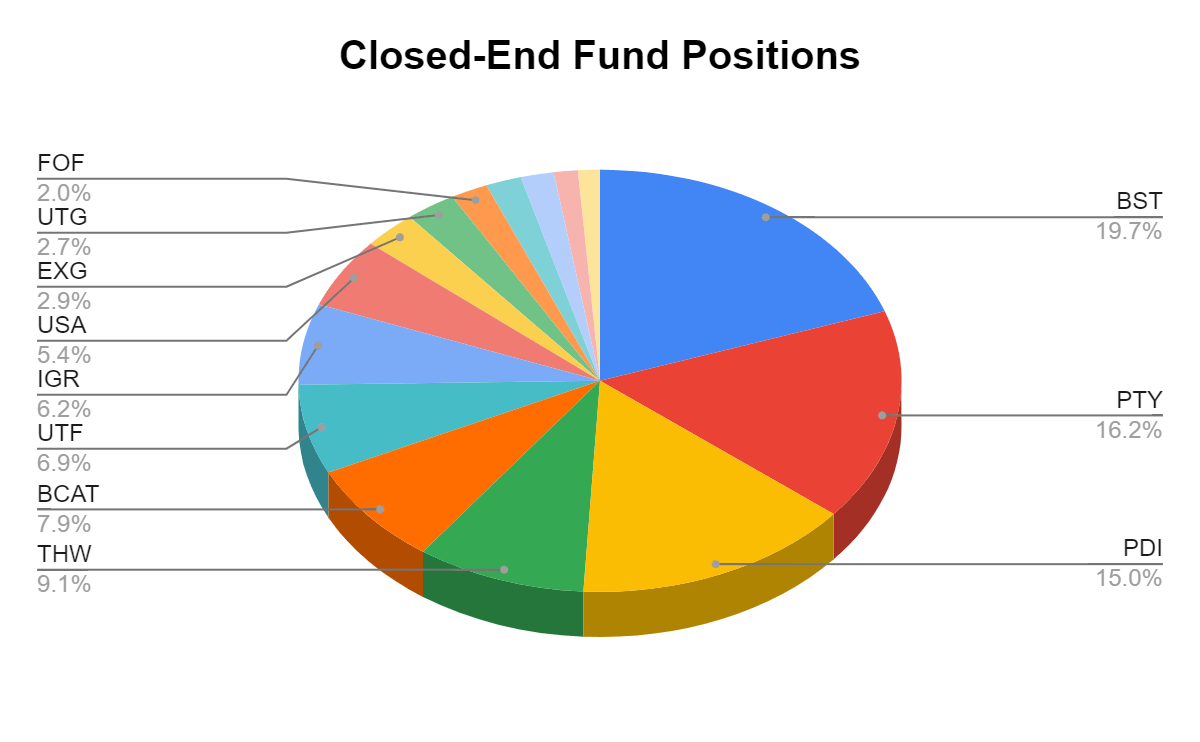
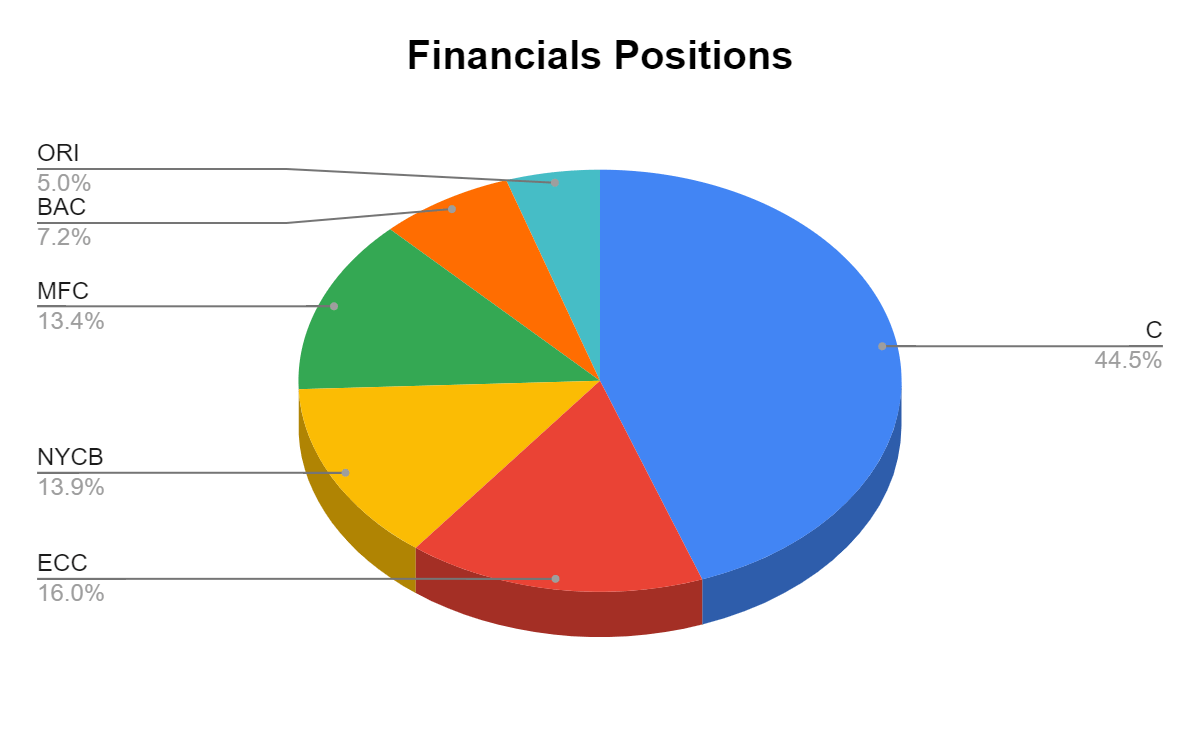
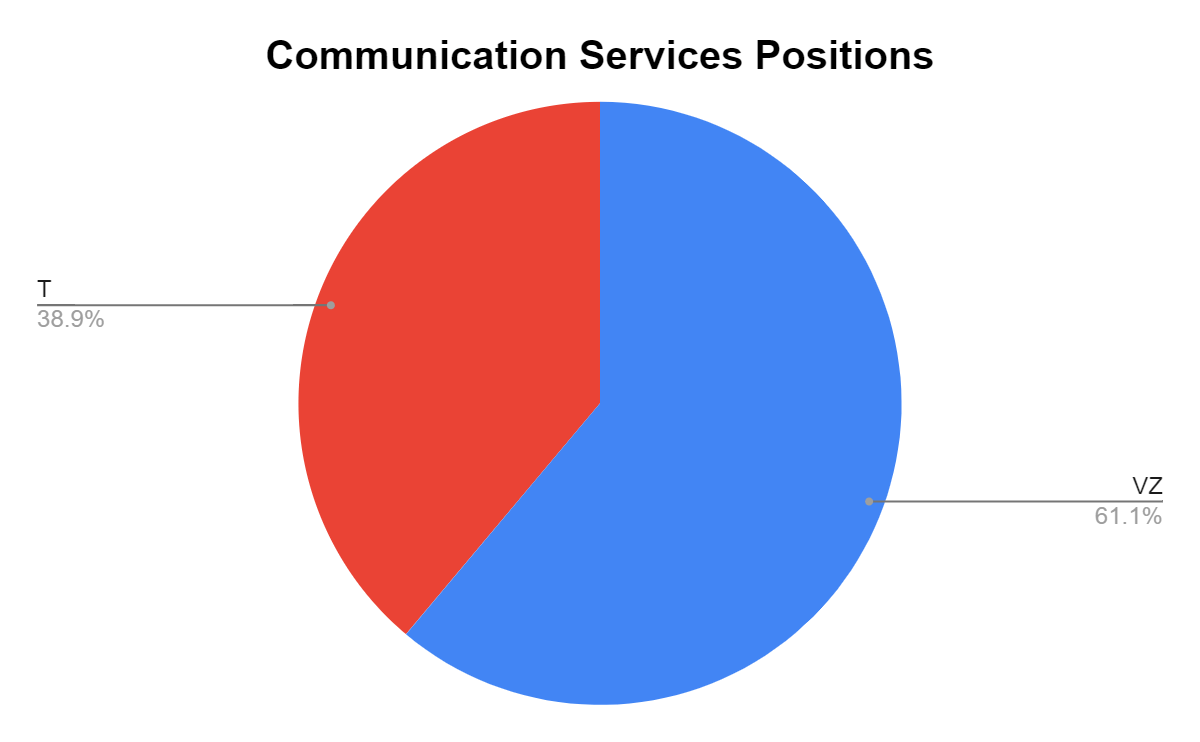
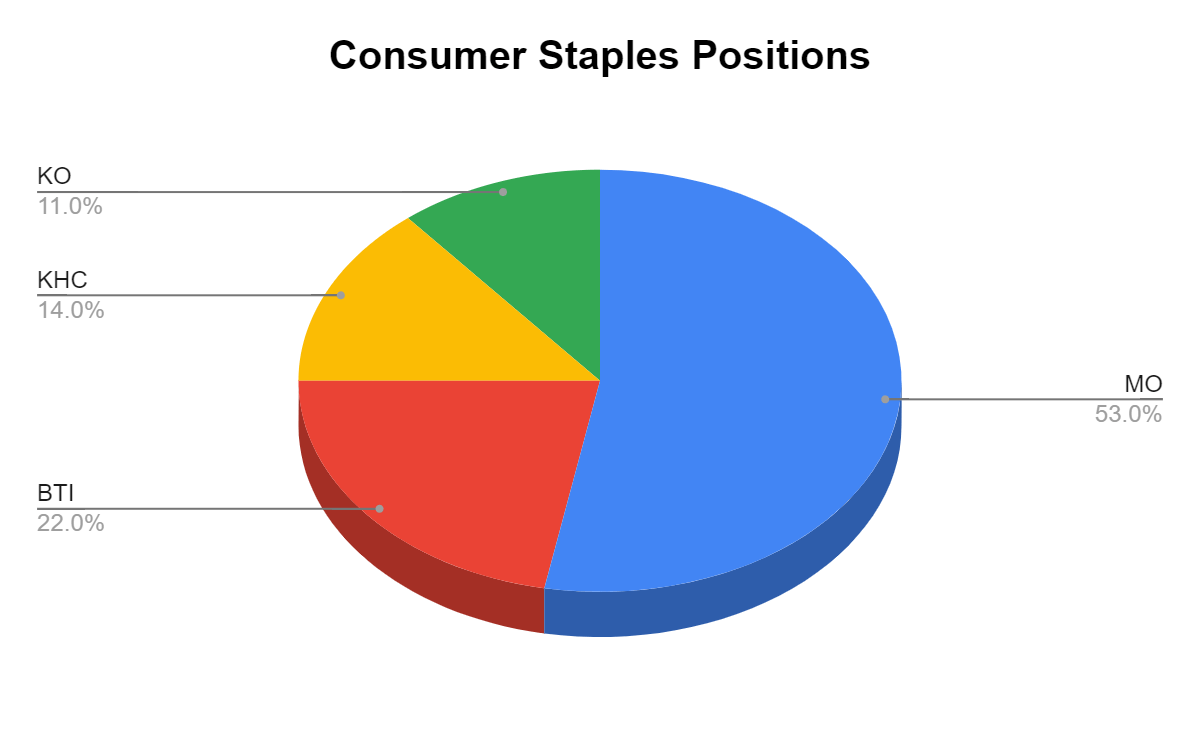
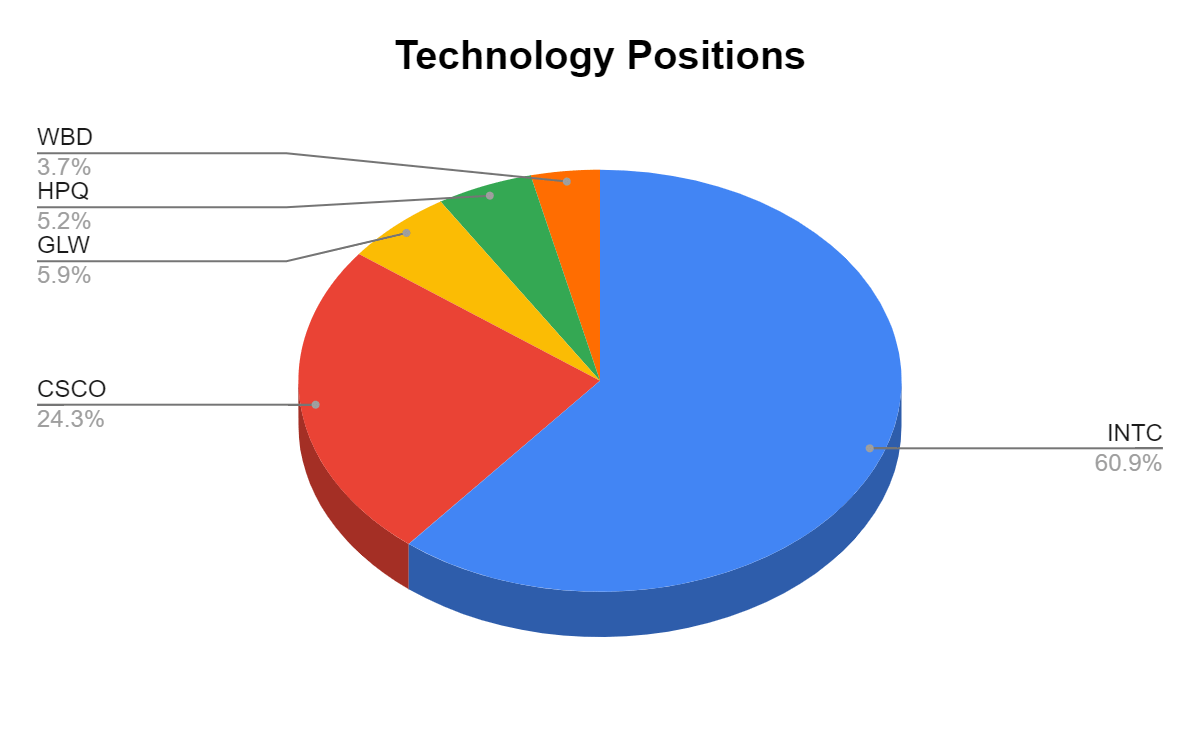
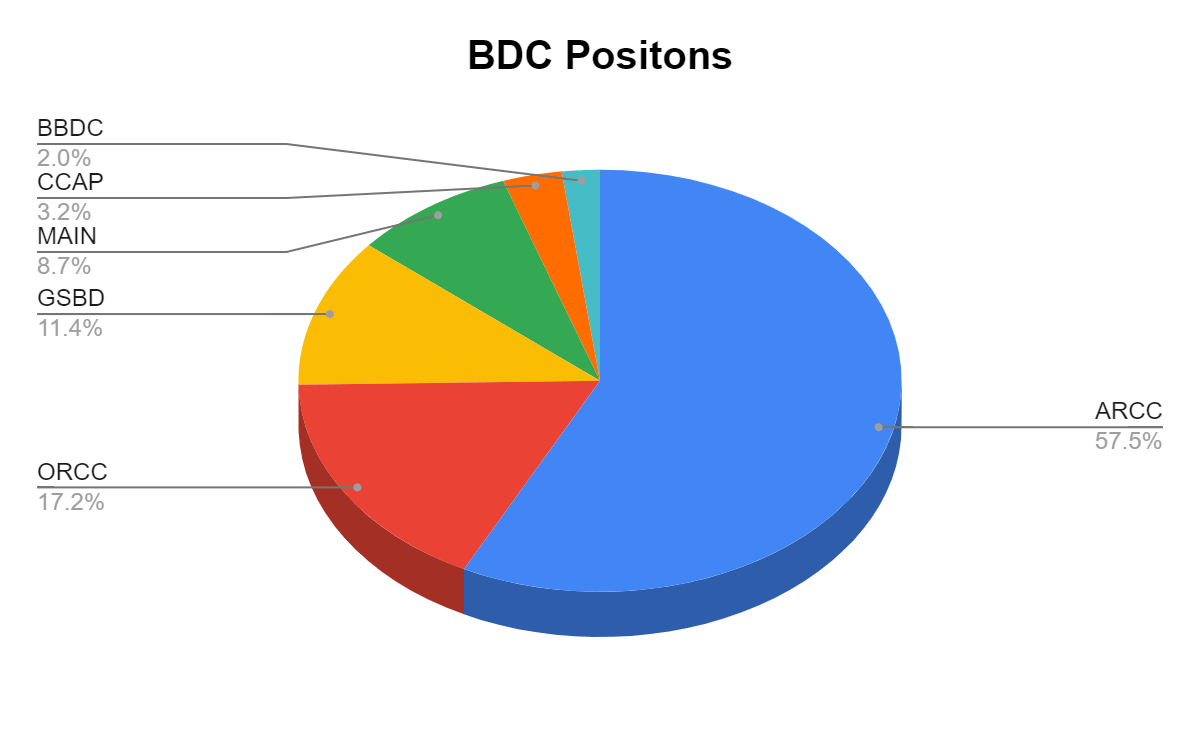
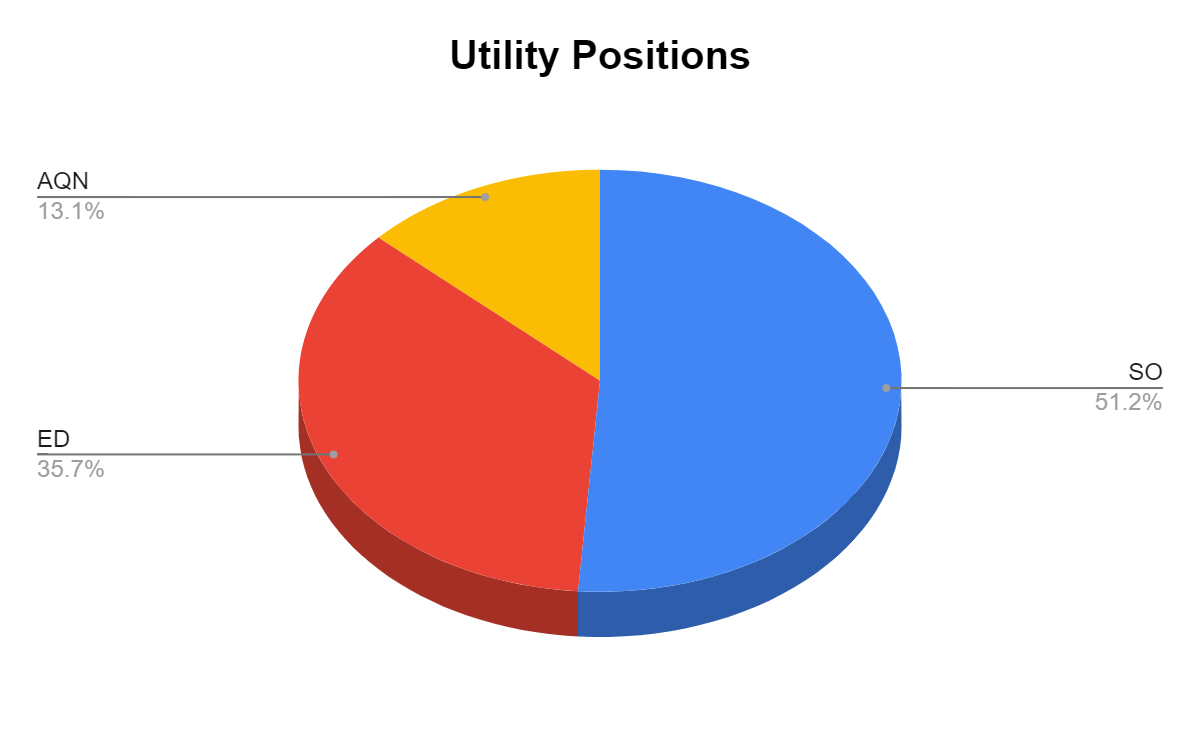
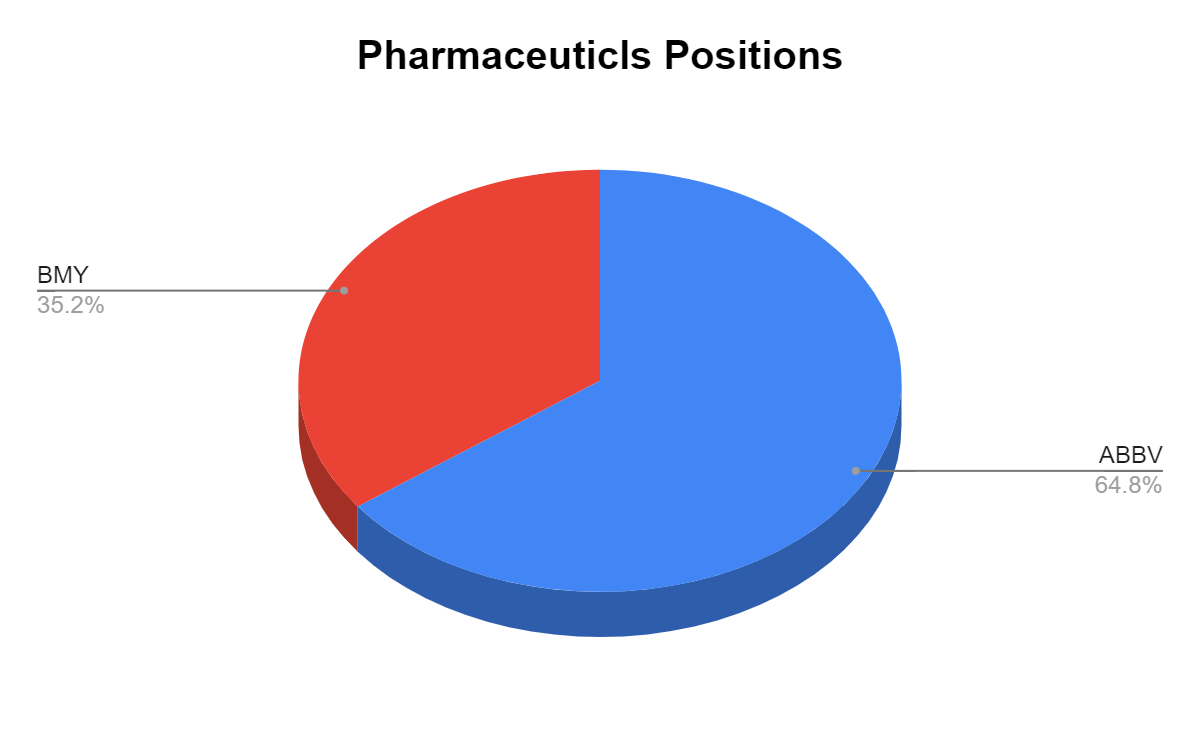
Many of the readers have asked if I could break down the individual positions within these sectors. I created pie charts for each individual sector and have illustrated how much each position represents of that sector of the Dividend Harvesting portfolio. Since I only have 1 position in Food & Staple Retailing and Industrials, I did not make a chart for those. 3M (MMM) and Walgreens Boots Alliance (WBA) represent 100% of those sectors. The charts will follow the normal portfolio total I have constructed. Please keep the ideas coming, as I am happy to add as much detail to this series as I can.
Steven Fiorillo, Seeking Alpha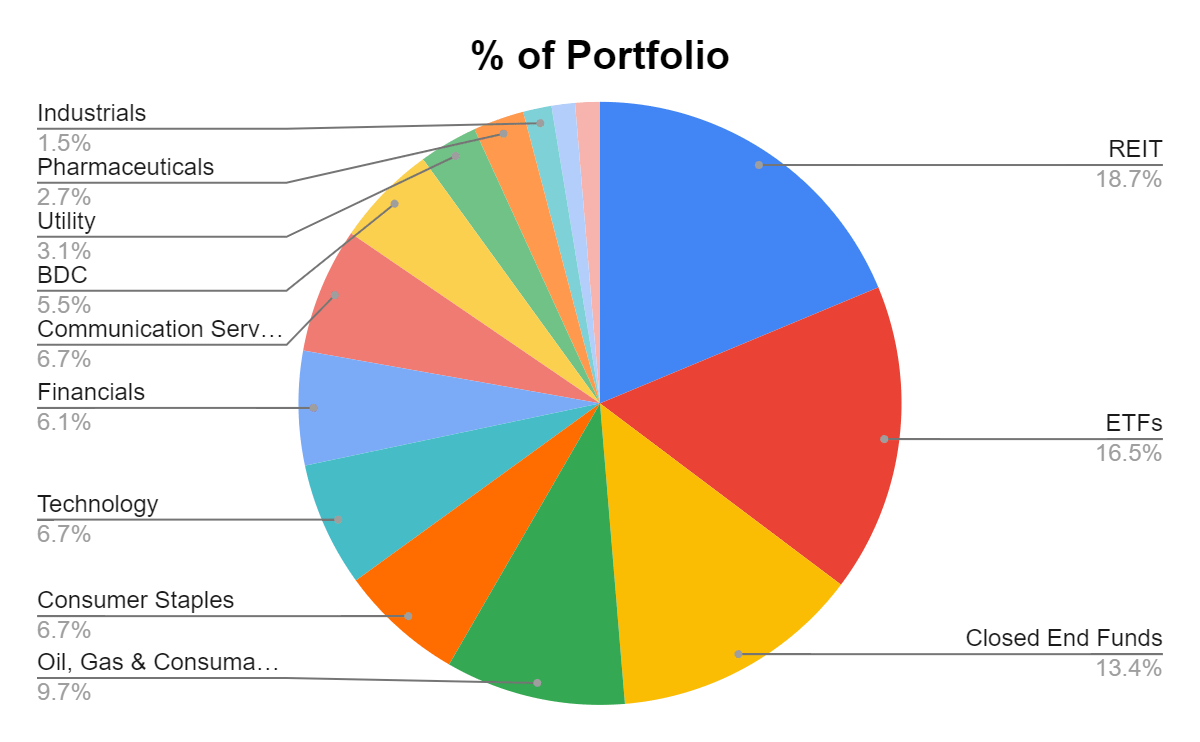
In week 88, REITs remained the largest segment and grew a bit closer to my 20% threshold for an individual sector weight within the Dividend Harvesting Portfolio. Individual equities make up 45.83% of the portfolio and generate 31.66% of the dividend income, while exchange-traded funds (“ETFs”), closed-end funds (“CEFs”), real estate investment trusts (“REITs”), business development companies (“BDCs”), and exchange-traded notes (“ETNs”) represent 54.17% of the portfolio and generate 68.34% of the dividend income. I have a 20% maximum sector weight, so when a singular sector gets close to that level, I make sure capital is allocated away from that area to balance things out. In 2022, I will make an effort to even out these portfolio percentages. As more capital is deployed, the bottom half of the portfolio weighting will increase.
|
Industry |
Investment |
Portfolio Total |
% of Portfolio |
|
REIT |
$1,581.22 |
$8,448.88 |
18.72% |
|
ETFs |
$1,397.99 |
$8,448.88 |
16.55% |
|
Closed End Funds |
$1,133.66 |
$8,448.88 |
13.42% |
|
Oil, Gas & Consumable Fuels |
$815.90 |
$8,448.88 |
9.66% |
|
Consumer Staples |
$563.49 |
$8,448.88 |
6.67% |
|
Technology |
$564.19 |
$8,448.88 |
6.68% |
|
Financials |
$516.74 |
$8,448.88 |
6.12% |
|
Communication Services |
$568.39 |
$8,448.88 |
6.73% |
|
BDC |
$463.20 |
$8,448.88 |
5.48% |
|
Utility |
$266.06 |
$8,448.88 |
3.15% |
|
Pharmaceuticals |
$230.56 |
$8,448.88 |
2.73% |
|
Industrials |
$128.96 |
$8,448.88 |
1.53% |
|
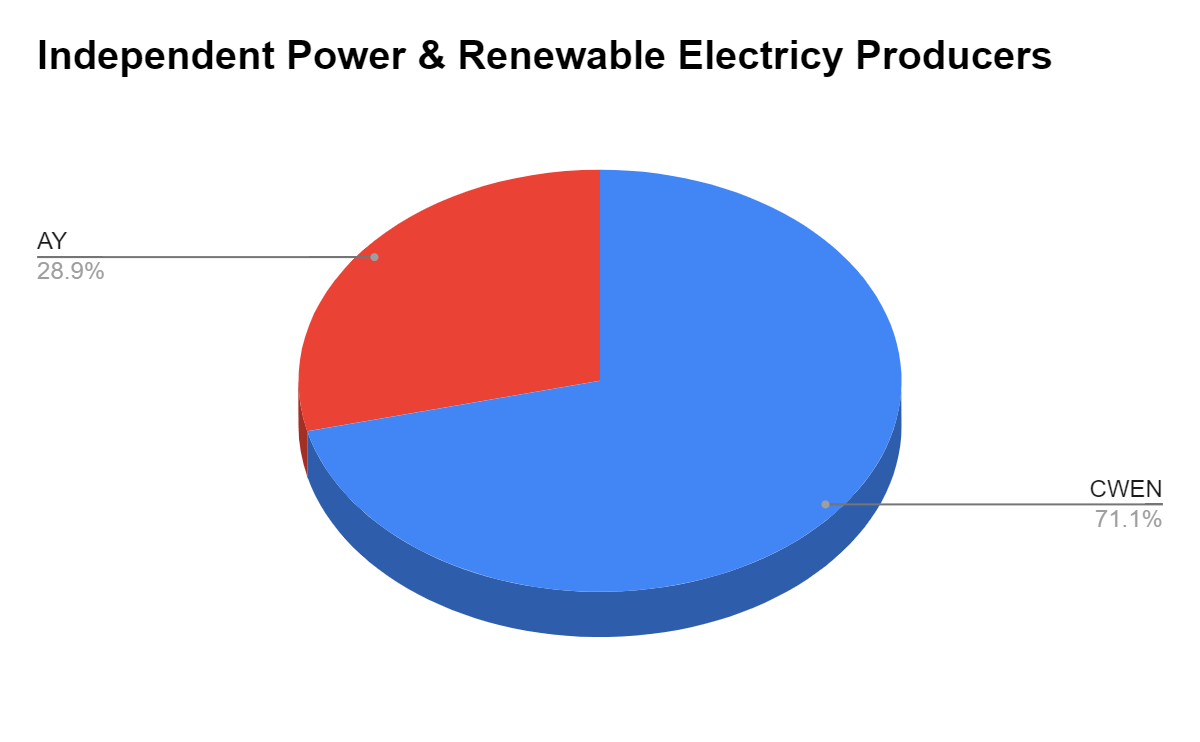
Independent Power & Renewable Electricity Producers |
$106.19 |
$8,448.88 |
1.26% |
|
Food & Staple Retailing |
$111.69 |
$8,448.88 |
1.32% |
|
Cash |
$0.63 |
$8,448.88 |
0.01% |
Steven Fiorillo, Seeking Alpha Steven Fiorillo, Seeking Alpha Steven Fiorillo, Seeking Alpha Steven Fiorillo, Seeking Alpha Steven Fiorillo, Seeking Alpha Steven Fiorillo, Seeking Alpha Steven Fiorillo, Seeking Alpha Steven Fiorillo, Seeking Alpha Steven Fiorillo, Seeking Alpha Steven Fiorillo, Seeking Alpha Steven Fiorillo, Seeking Alpha Steven Fiorillo, Seeking Alpha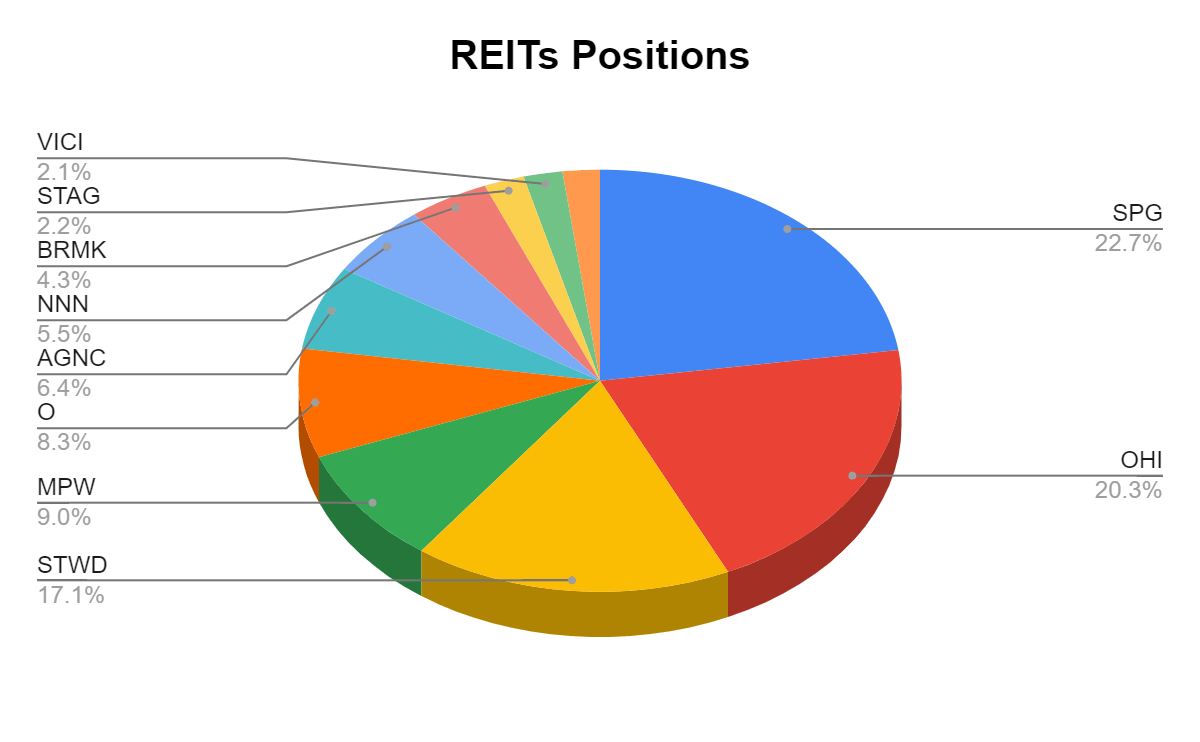
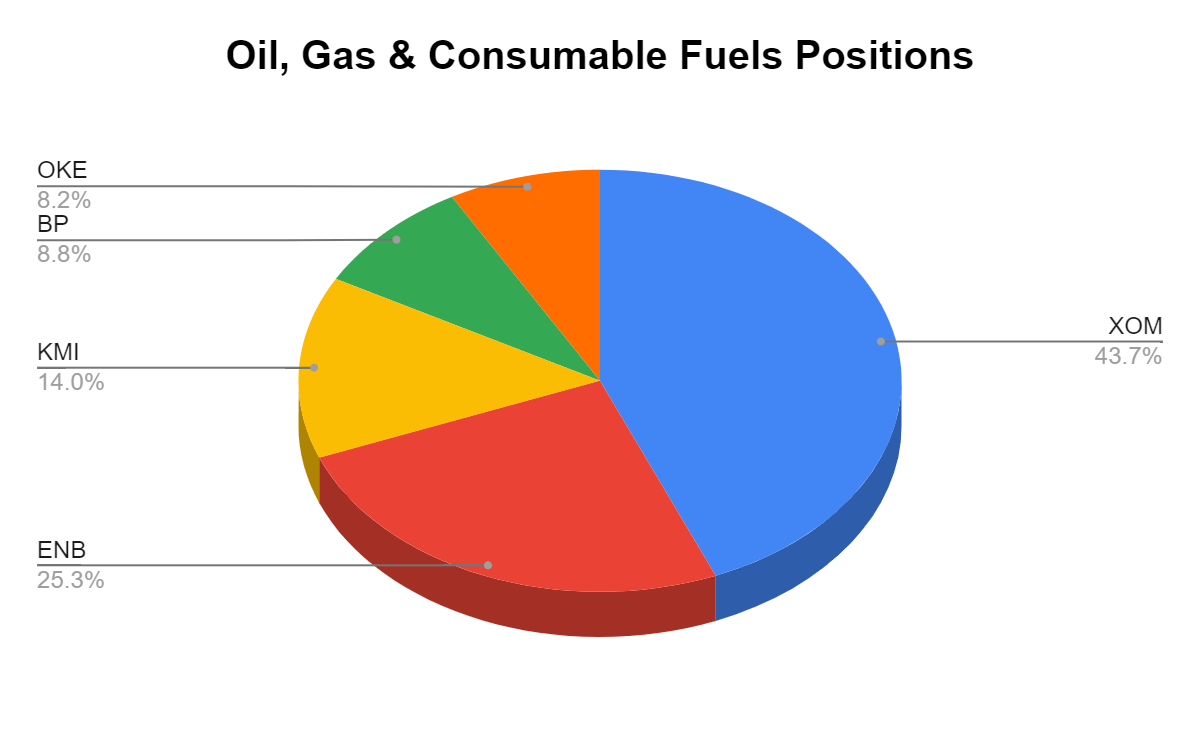
In week 88, Exxon Mobil (XOM) remained the Dividend Harvesting Portfolio’s largest position. SPG moved into the 2nd largest position as its shares have significantly appreciated since earnings. There are now 4 positions that exceeded the 4% level, and I feel that none of my positions are in danger of creeping up to my 5% limit in the foreseeable future.
Steven Fiorillo, Seeking Alpha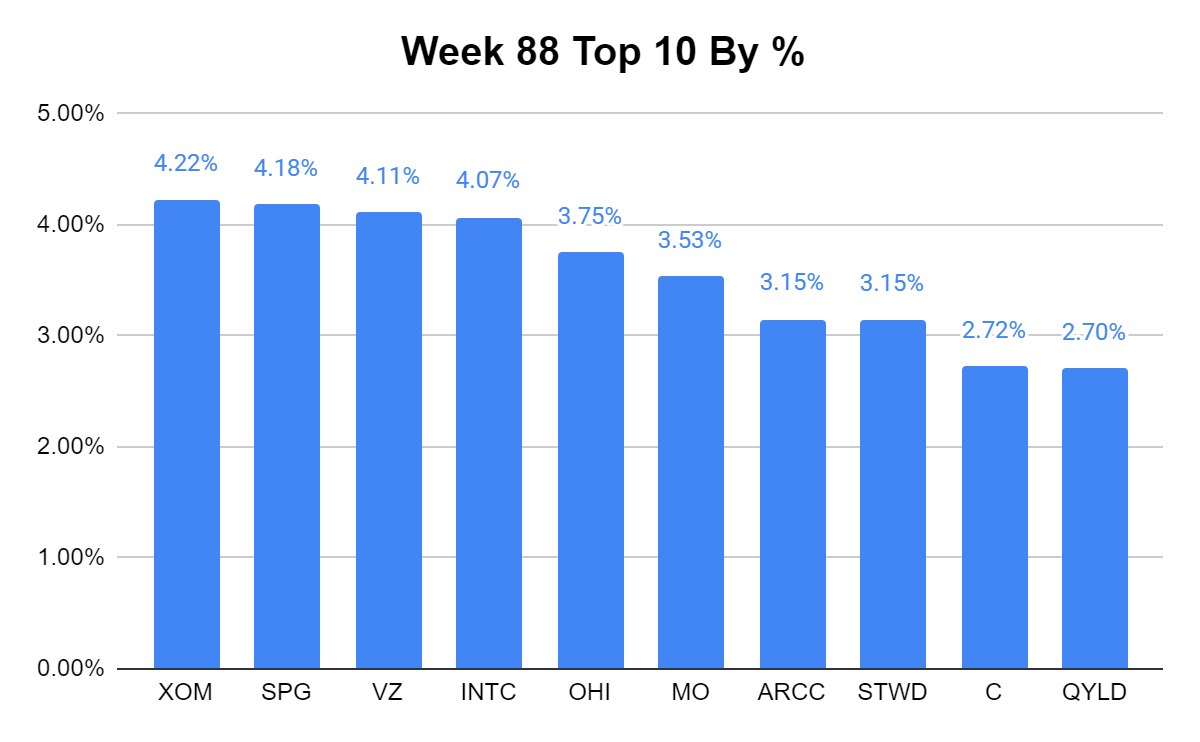
Week 88 Additions
In week 88, I used the $100 of allocated capital to purchase 1 additional share of each of the following companies:
Intel Corporation
- INTC may or may not have sandbagged their Q3 earnings estimates on the Q2 conference call when they issued guidance, but regardless, earnings were much better than expected. INTC generated $0.59 EPS in Q3 which was a $0.26 beat and their revenue came in-line at $15.3 billion. INTC guided down for FY 2022 and Q4, but the markets seem to be rewarding INTC. At a 5% yield I am buying, as I see INTC as a strong buy for the long-term. INTC has dominated the PC chip market and will expand into manufacturing chips for not just themselves, but other companies. I will continue to add to my INTC position.
AGNC Corporation
- AGNC has been one of the worst investments in the Dividend Harvesting Portfolio. I have made the decision to dollar cost average into a lower cost basis instead of exiting the position. I see long-term value, and even if shares don’t get back to where they used to trade anytime soon, I can reduce my cost and increase my monthly income from the position.
JPMorgan Equity Premium Income ETF
- JEPI focuses on high-quality U.S companies and has constructed a portfolio that they believe will provide lower volatility than the market while generating sustainable dividends. JEPI’s primary structure includes investing at least 80% of its assets in equity securities. To generate income, JEPI can allocate 20% of its assets to ELNs. ELNs are structured as notes issued by counterparties, including banks, broker-dealers, or their affiliates, and designed to offer a return linked to the underlying instruments within the ELN. By investing 20% of its assets in ELNs, JEPI is able to create monthly income for its investors. Instead of writing covered calls on its positions, JEPI generates recurring cash flow from the premiums on the call options the ELNs write. This allows JEPI to generate income without sacrificing upside potential when the markets rise, as its 80% base of equities is not capped by covered calls. I think these are attractive levels for long-term investors, and I plan on adding more JEPI to the portfolio.
Week 89 Gameplan
In week 89, I am considering adding to INTC again, the BlackRock Science and Technology Trust (BST), and maybe Enbridge (ENB).
Conclusion
Market sentiment isn’t optimal, but that isn’t a deterrent for me when it comes to investing. I have decades ahead of me, and I believe this will prove to be a fantastic opportunity for building positions in quality equities, ETFs, and CEFs. Week 90, which is reader suggestion week, is approaching. Please leave all your comments and suggestions below, as I will be adding new positions or adding to existing positions based on reader suggestions. Thank you for continuing to read this series.
Be the first to comment