

Mongkol Onnuan
The markets started out with a bang in week 84 but barely held onto their gains, finishing the week up 0.69% on the S&P 500 and 0.32% on the Nasdaq. The Dividend Harvesting Portfolio finished week 84 in the red again but started to climb its way back to even as it went from being down -12.65% (-$1,050.35) in week 83 to finishing week 84 down -11.56% (-$971.36). At one point, the Dividend Harvesting Portfolio was down around -$550 on Tuesday, but as the markets gave back most of their weekly gains, so did the Dividend Harvesting Portfolio. It’s been difficult for me not to change the parameters of this series as I feel there are many great opportunities and want to increase the weekly allotted capital so I can take advantage of the downturn. I made a decision to stick with the $100 per week so all of the metrics are based on the same investment strategy. I think there is still more downside ahead of us, and I plan on dollar cost averaging as the bear market continues. Eventually, the markets will bottom, and as a long-term investor, I plan on capitalizing on these prices while they last.
In week 84, the Dividend Harvesting Portfolio closed with an account value of $7,429.64. The projected annual income increased to $613.17, which is a forward yield of 8.25%. In week 84, 7 positions generated income, and I collected $3.72 in dividends. Throughout 2022, this portfolio has generated weekly income, and I have collected and reinvested $332.82 in dividends. With week 84’s allocated capital, I added a share to my position in Realty Income (O) and the Global X S&P 500 Covered Call ETF (XYLD). I recently wrote an article on XYLD and outlined why I am still a fan of this double-digit yielding ETF. I have some ideas for next week, and plan on adding too many of my current positions as time progresses.
Steven Fiorillo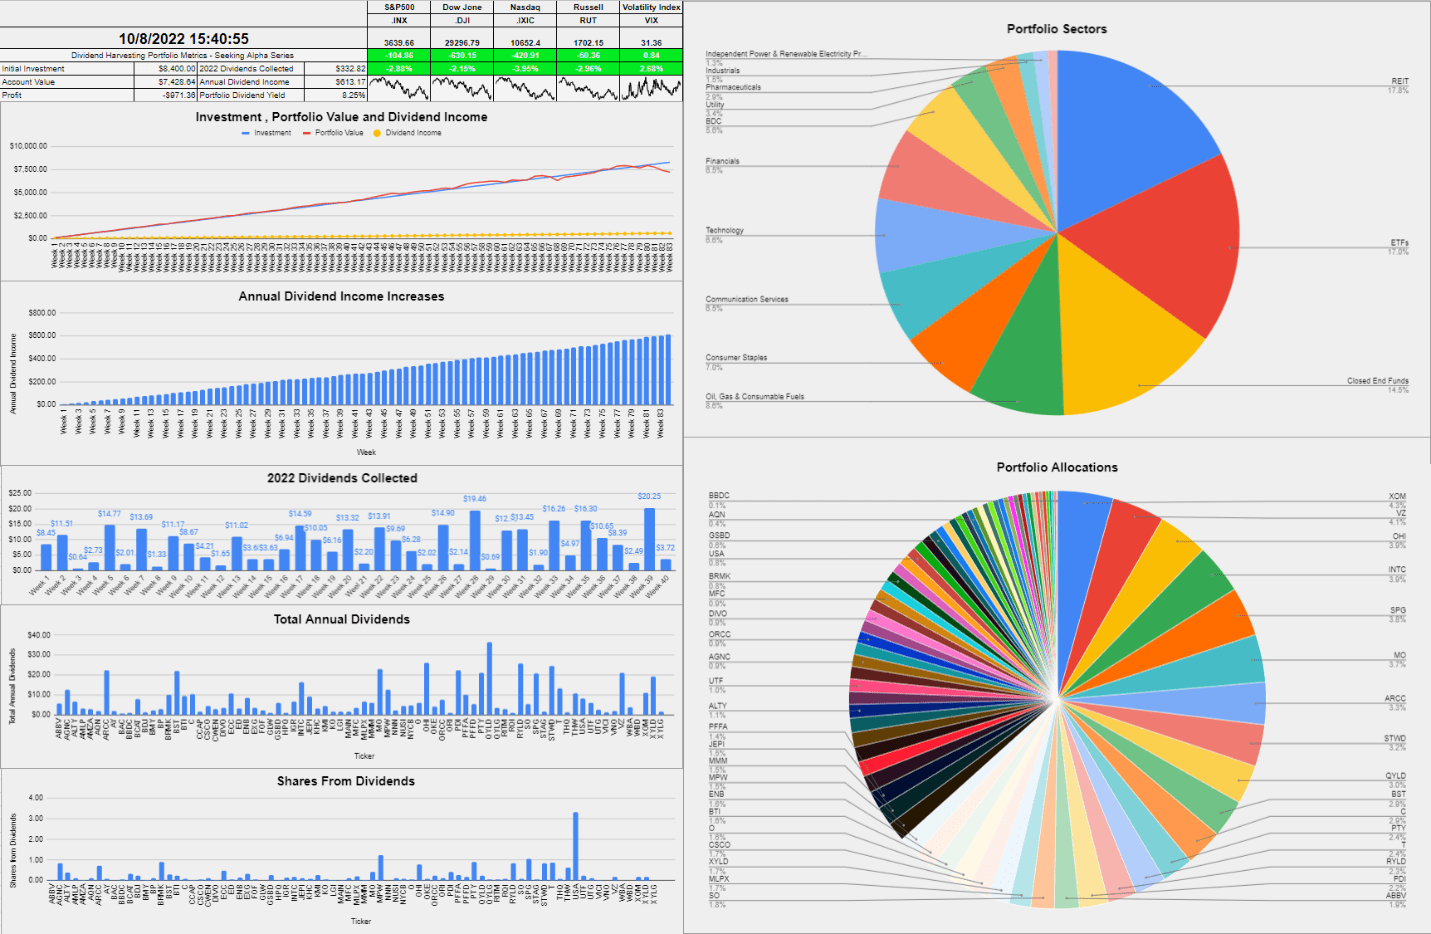
I allocate capital toward big tech, funds, dividends, and growth outside of my retirement accounts. These are not my only investments, but I did open a separate account, so I could easily track and document this series. I intentionally created broad diversification throughout the Dividend Harvesting portfolio so I could benefit from sector rotations and mitigate my downside risk. Investors who are too exposed to growth companies or large-cap tech have gotten crushed as the investment landscape changes. On the growth and tech side of my investments, I am feeling the pain as some of my favorite companies, including Alphabet (GOOGL) (GOOG), Amazon (AMZN), and Meta Platforms (META), have been taken to the woodshed.
I am going to address a question that continues to surface. I am not trying to beat the market with this portfolio. I love index funds and am invested in several index funds. I love dividend investing due to the stream of cash flow it generates. I don’t want 100% of my assets outside of real estate tied to an S&P index fund. I have created a personal investment strategy that works to achieve my investment goals, and having a stream of income generated from dividends is part of my investment strategy. Low-cost index funds are one of the best investments anyone can make in my opinion, and the Dividend Harvesting portfolio is not meant to be a substitute for an index fund. I have read many questions about dividend investing and wanted to start a portfolio from the ground up and document its progress to disprove many misconceptions, including that you need a large amount of seed capital to make dividend investing work for you.
This series has never been about hitting a target yield, generating a certain amount of profit, or beating the market. I had two specific goals with this series. The first was to create a blueprint for constructing a dividend portfolio by documenting the journey starting from the beginning. The second goal was to illustrate how allocating capital each week toward investing, regardless of the amount, would be beneficial in the long run.
Too many people are under the illusion that you need tens of thousands or even hundreds of thousands to benefit from investing. Instead of using my real dividend portfolio as an example, I decided to start a new account, fund it with $100, and add $100 weekly, providing a step-by-step guide to dividend investing. This methodology doesn’t have to be used for dividend investing, and it could be as simple as an S&P index fund or a Total Market fund. Hopefully, this series is inspiring people to invest in their future to attain financial freedom.
A Historical Recap of the Dividend Harvesting Portfolio’s Investment Principles and Historical Performance
Investment Objectives
- Income generation
- Downside mitigation through diversification
- Capital appreciation
Below are the fundamental rules I have put in place for this Portfolio:
- Allocate $100 weekly to this Portfolio
- Only invest in dividend-producing investments
- No position can exceed 5% of the Portfolio
- No sector can exceed 20% of the Portfolio
- All dividends & distributions are to be reinvested
Below is a chart that extends from week 1 through the current week to illustrate the Dividend Harvesting Portfolio’s Progression
- Blue line is my initial investment $100 in week 1, $1,000 in week 10, etc.
- Red line is the account value at the end of each week
- Yellow line is the annual dividend income the Dividend Harvesting Portfolio was projected to generate after that week’s investments and dividends reinvested
Steven Fiorillo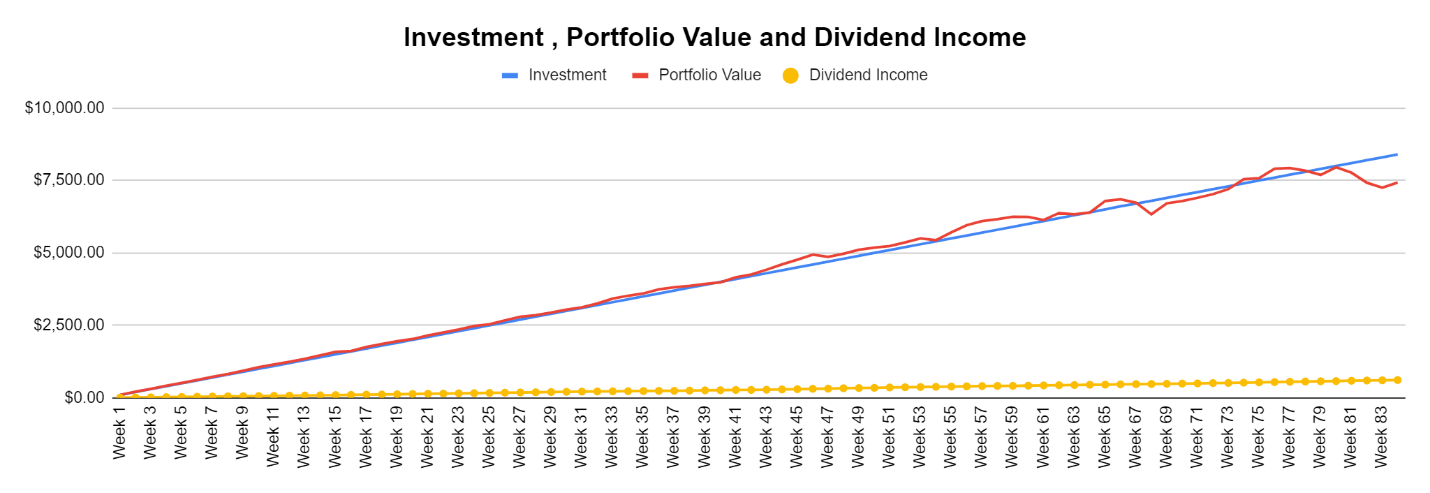
The Dividend Harvesting Portfolio Dividend Section
There is no longer an ETN section of the portfolio, and I am not sure if I will be adding ETNs again. Here is how much dividend income is generated per investment basket:
- Equities $191.34 (31.20%)
- ETFs $139.33 (22.72%)
- REITs $123.52 (20.14%)
- CEFs $118.63 (19.35%)
- BDC $40.35 (6.58%)
Steven Fiorillo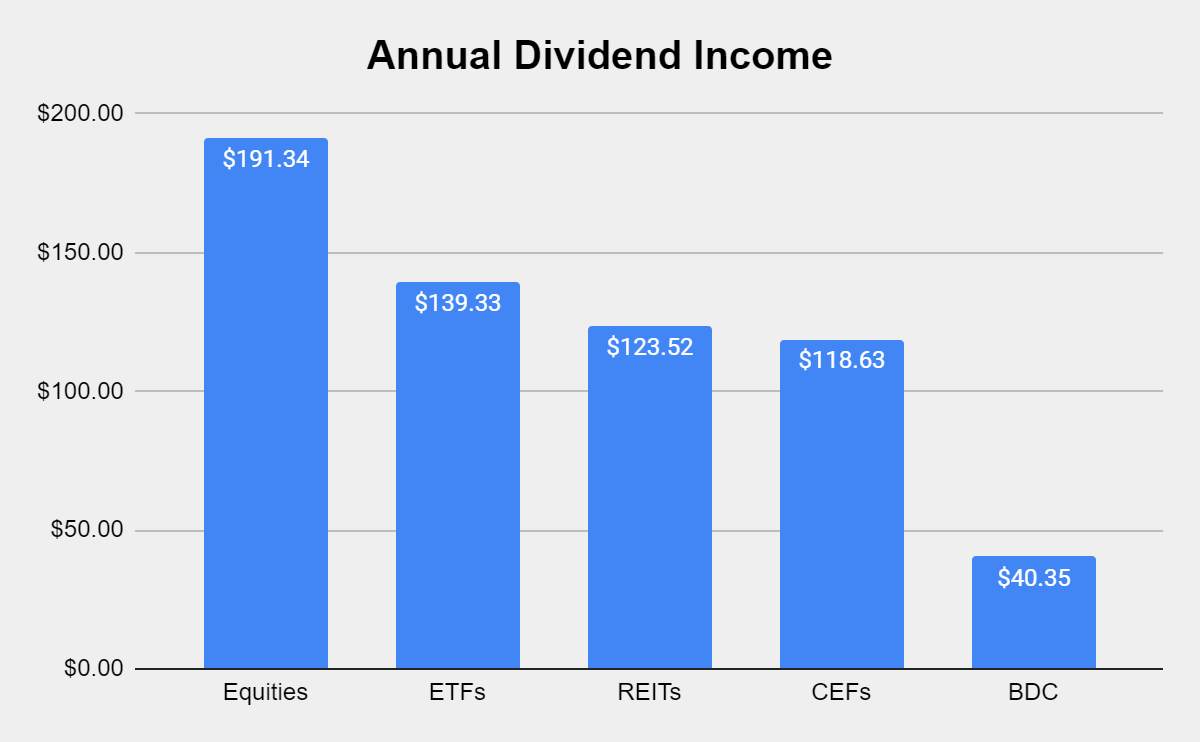
Steven Fiorillo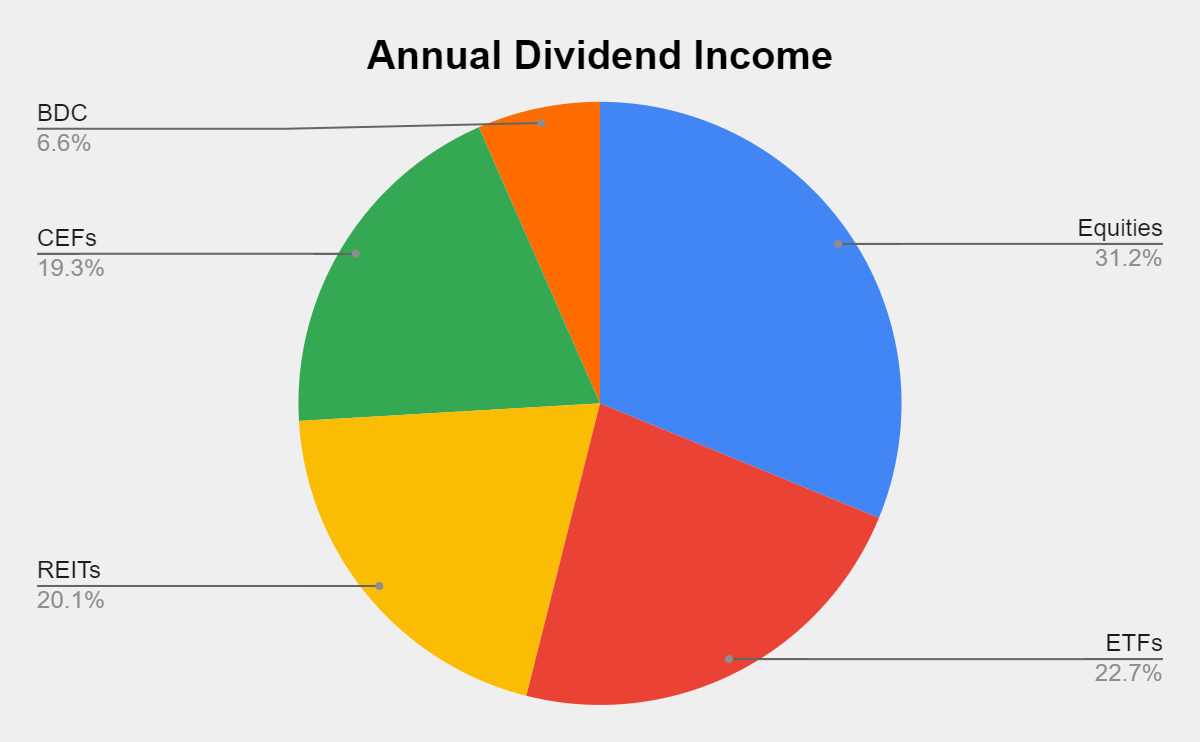
Collecting dividends can serve many functions in a portfolio. Some investors utilize dividends to supplement their income and live off. I am building a dividend portfolio for myself 30 years into the future. Since I am reinvesting every dividend, they serve multiple purposes today. In 2022 alone, I have collected $332.82 in dividend income from 398 dividends across 40 weeks. This has allowed the Dividend Harvesting portfolio to stay in the black while growing the snowball effect.
These dividends allow me to gain additional equity in my investments while increasing my future cash flow in down markets. This style of investing isn’t for everyone, but if you’re looking to generate consistent cash flow while mitigating downside risk, this method has worked for me. I am hoping to collect between $450 and $500 in dividends in 2022, which will be reinvested, and finish the year generating >$700 in annual dividends.
Steven Fiorillo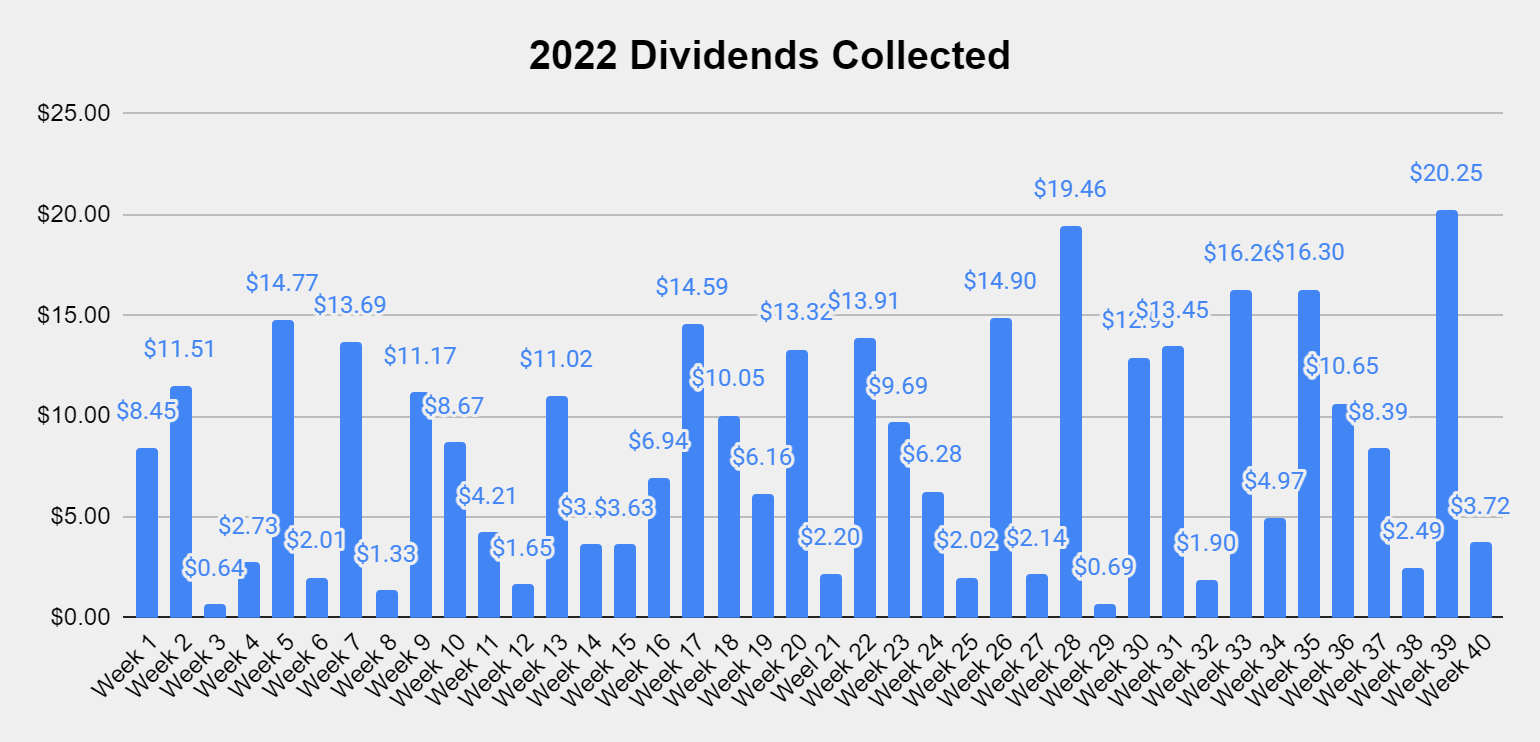
This next chart illustrates my monthly YoY dividend income progression. Since I started this series in April of 2021, that is where the dividend income starts, illustrated by the blue bars. My dividend income has increased substantially as April’s income has grown by 886.2% YoY, March 585.52% YoY, June 476.52% YoY, July’s 254.25% YoY, and August 247.13%.
The month of September just finished, and I collected $47.96 in dividend income. This is a YoY increase of $35.45 or 283.37%.
Steven Fiorillo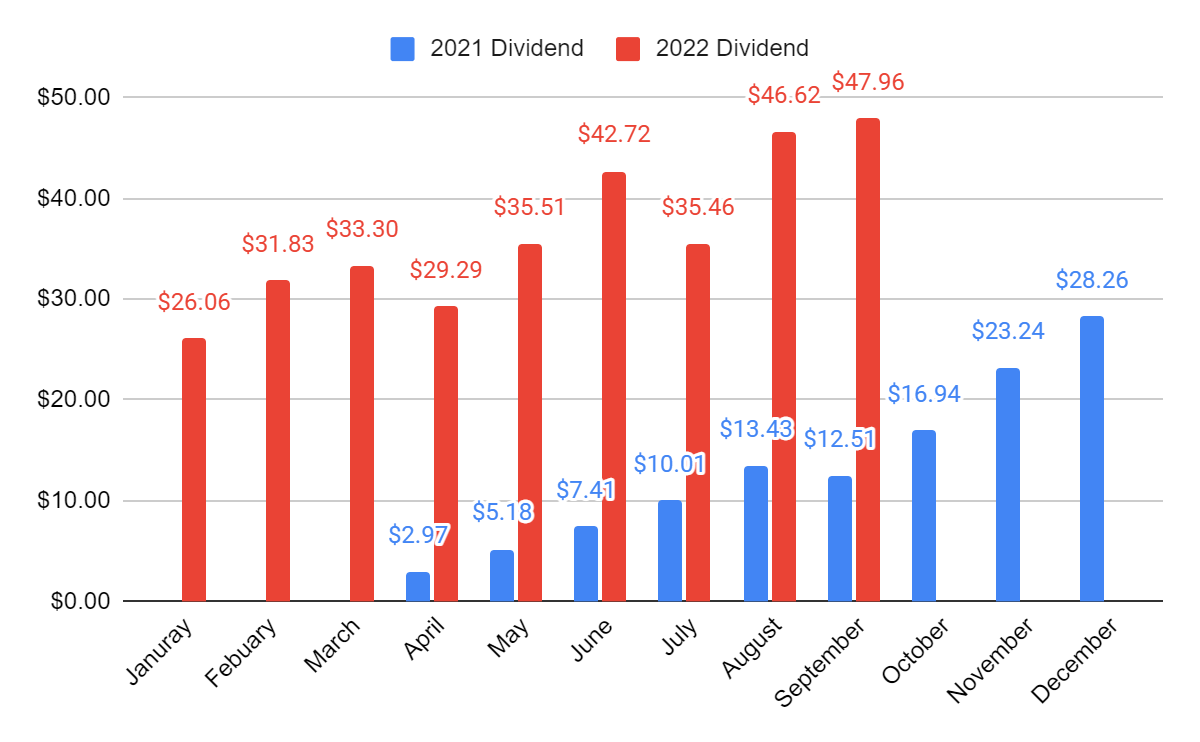
The Dividend Harvesting Portfolio is producing 588 annual dividends. I am not expecting this to change as I am focusing on dollar cost averaging on current positions.
Steven Fiorillo
The goal of generating enough income from the dividends to purchase an additional share per year has been the never-ending project of this portfolio. There are now 11 total positions generating at least 100% of their share value in dividends within the Dividend Harvesting portfolio. This could fluctuate due to market volatility, but I am looking to have as many positions generating at least 1 share annually from their dividends as I can.
Steven Fiorillo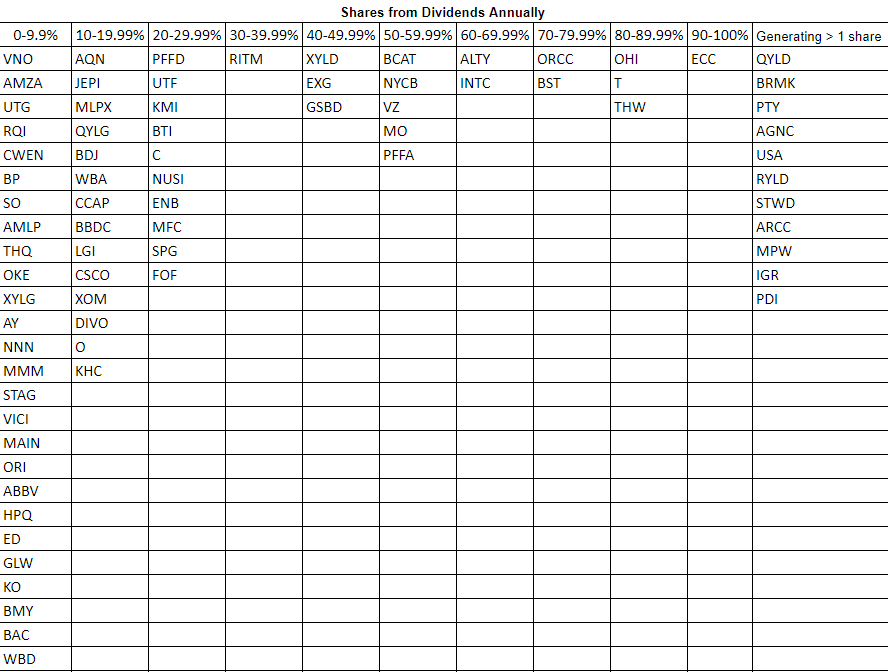
The Dividend Harvesting Portfolio Composition
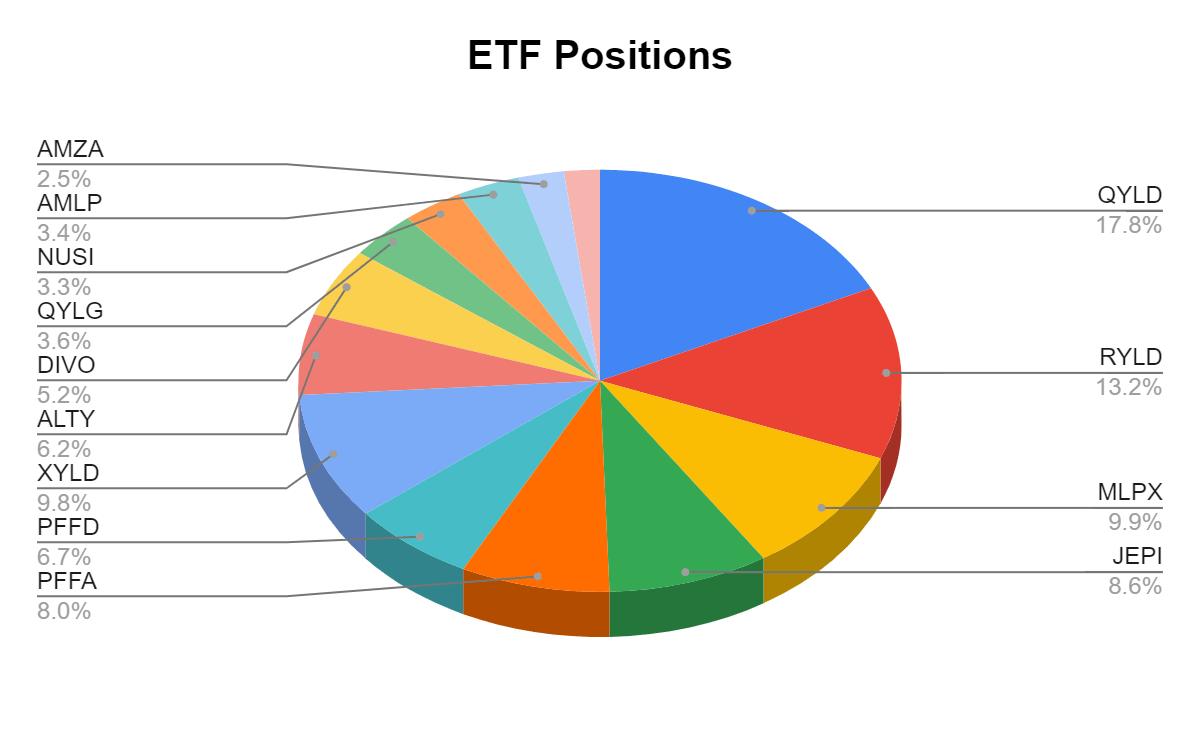
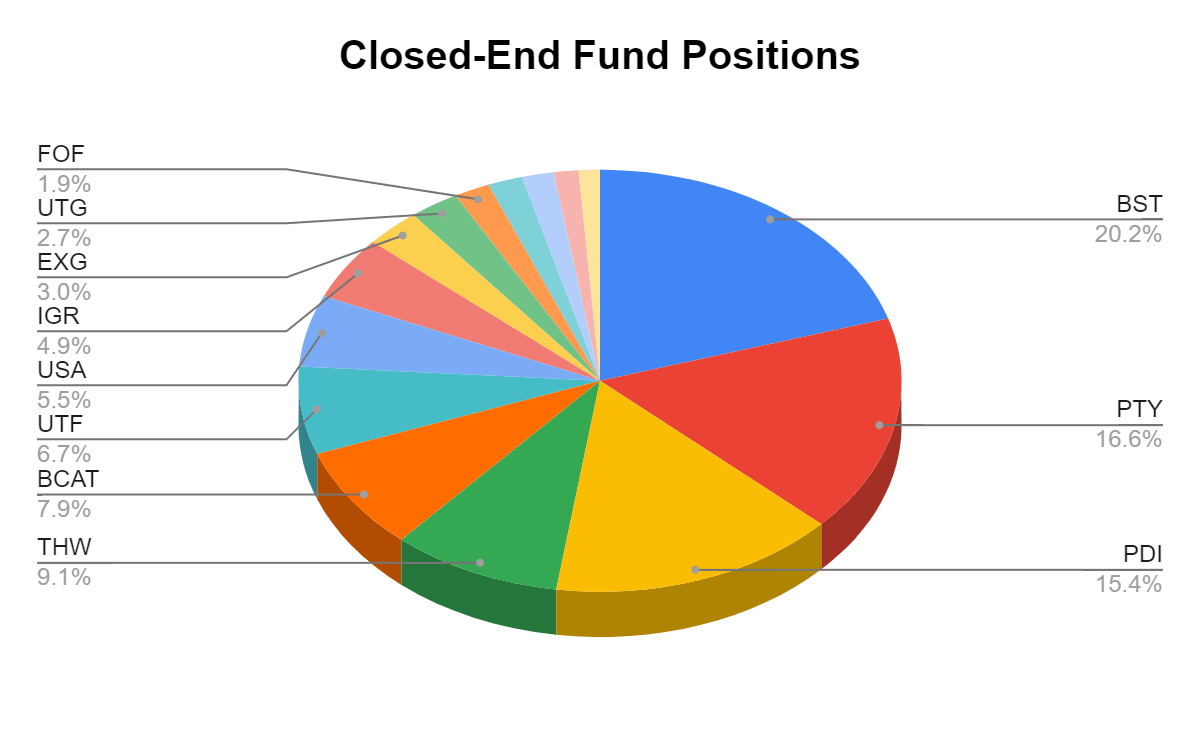
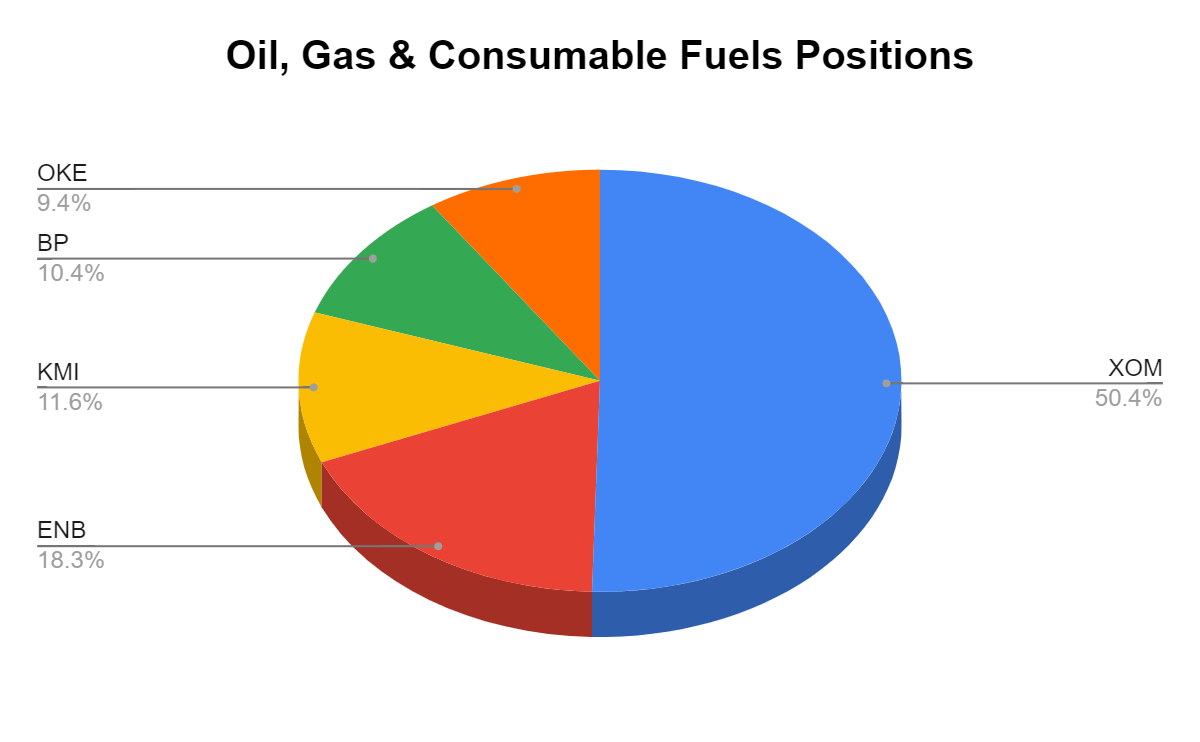
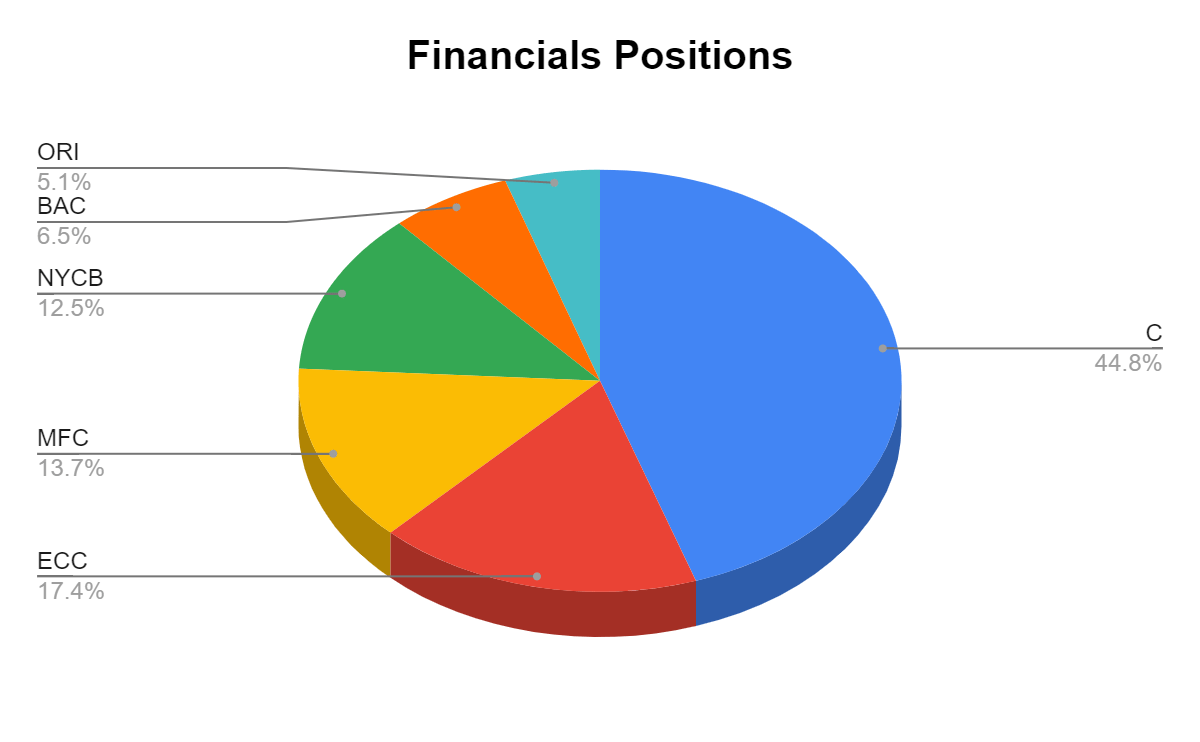
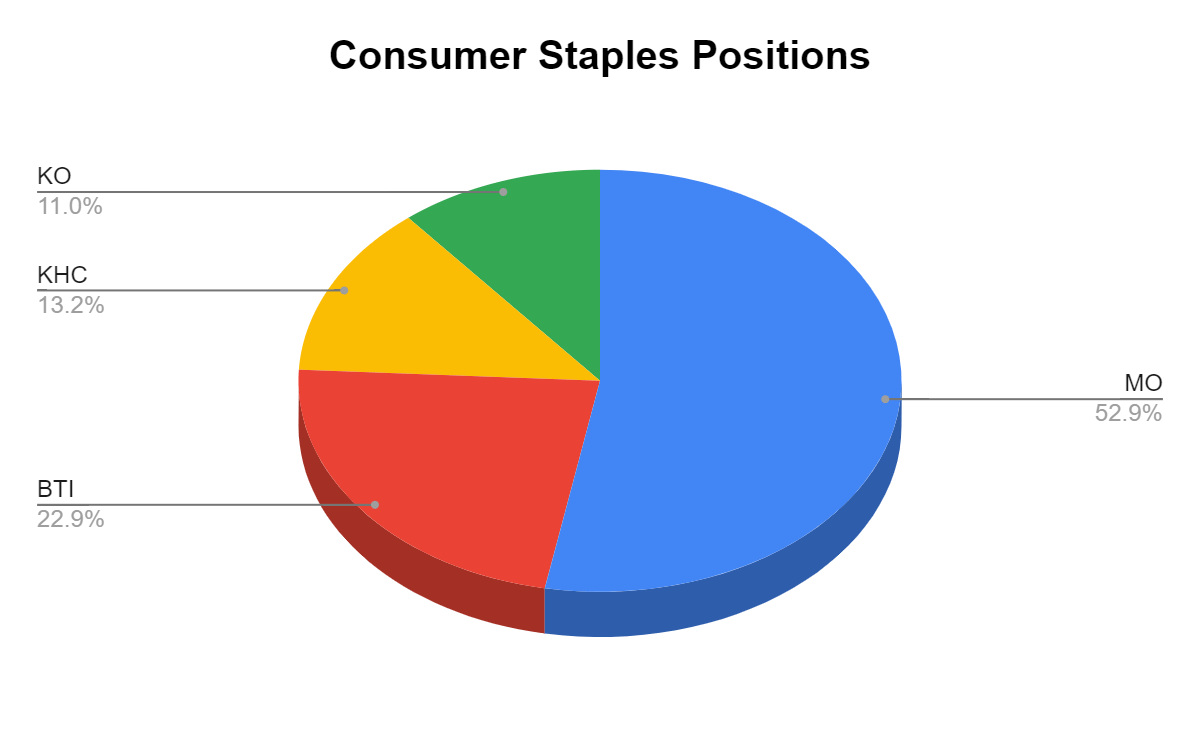
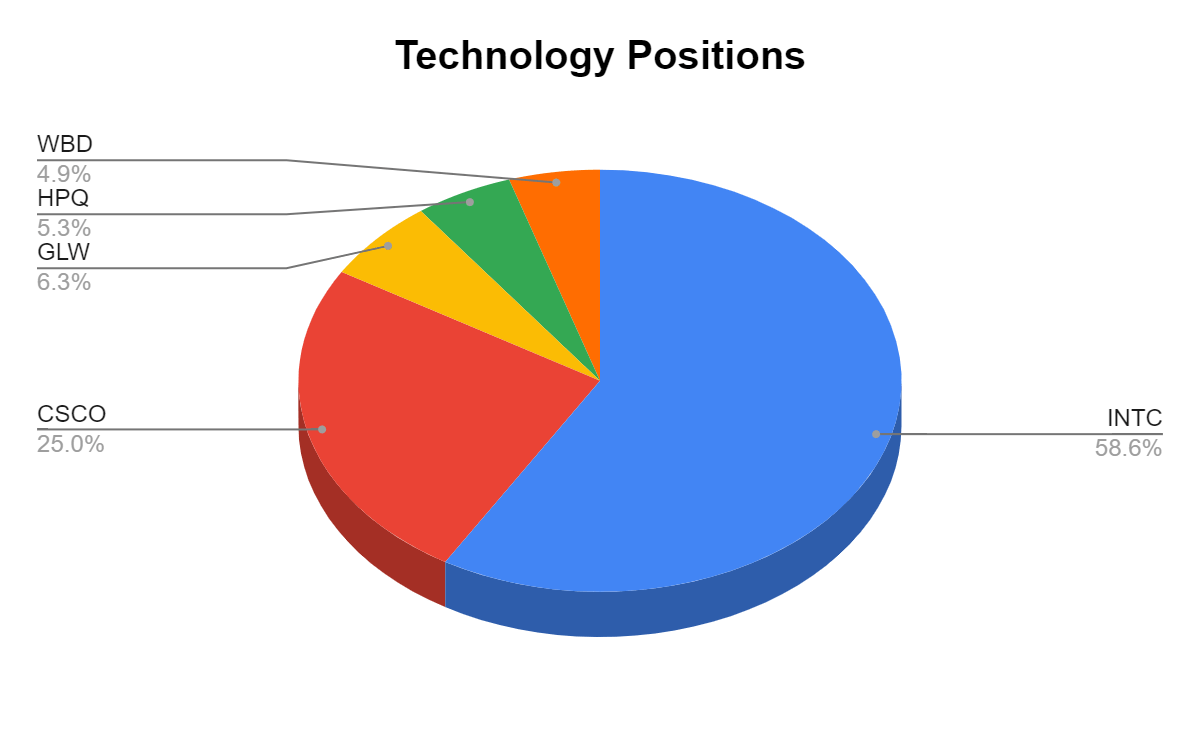
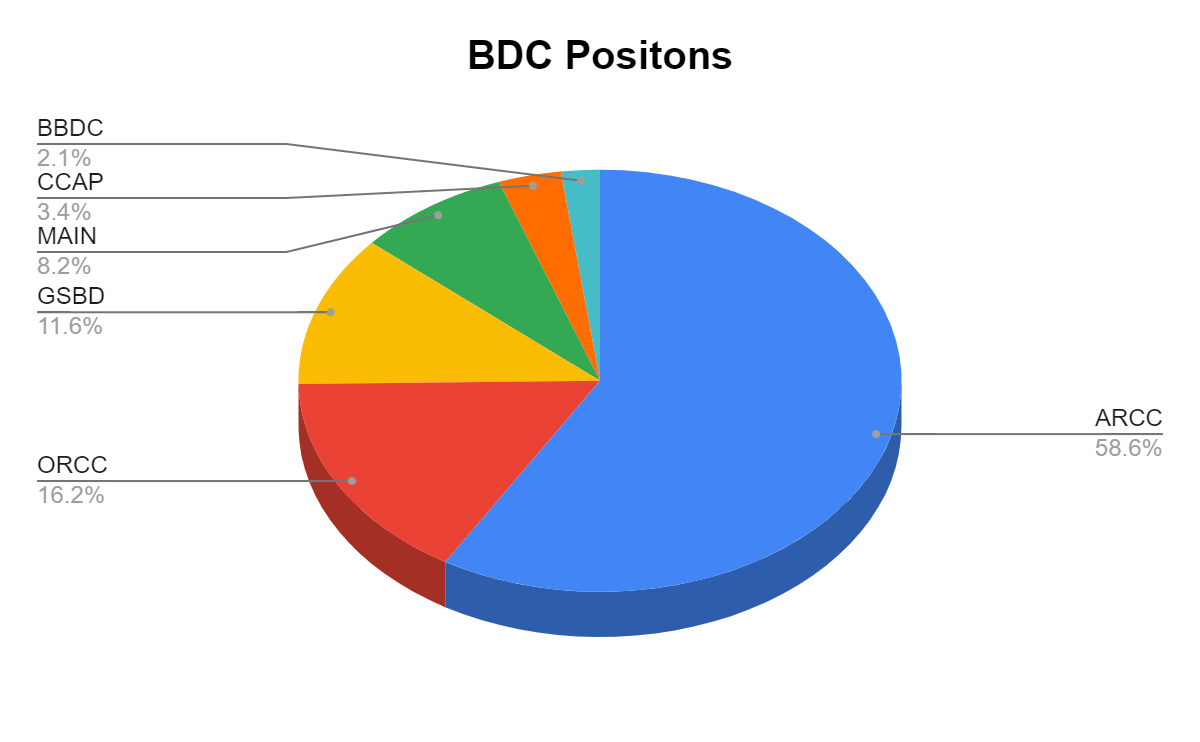
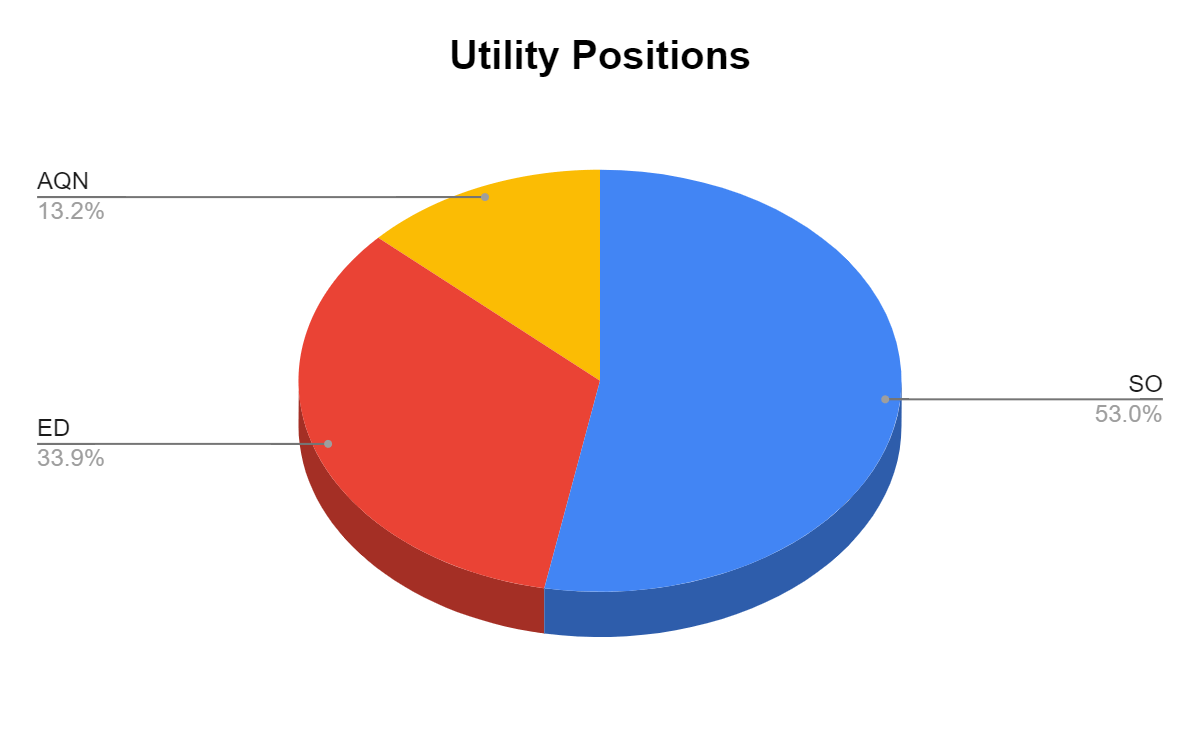
Many of the readers have asked if I could break down the individual positions within these sectors. I created pie charts for each individual sector and have illustrated how much each position represents of that sector of the Dividend Harvesting portfolio. Since I only have 1 position in Food & Staple Retailing and Industrials, I did not make a chart for those. 3M (MMM) and Walgreens Boots Alliance (WBA) represent 100% of those sectors. The charts will follow the normal portfolio total I have constructed. Please keep the ideas coming, as I am happy to add as much detail to this series as I can.
Steven Fiorillo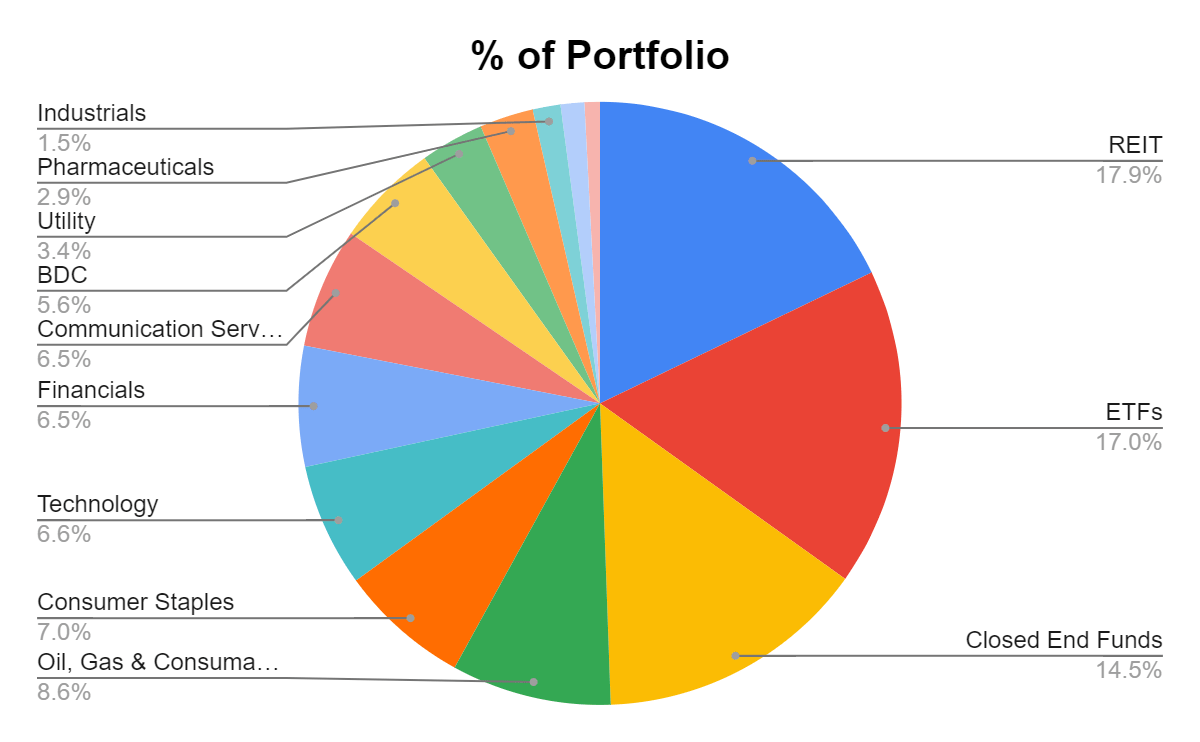
In week 84, REITs remained the largest segment of the Dividend Harvesting Portfolio with 17.9% of its value. Individual equities make up 44.97% of the portfolio and generate 31.20% of the dividend income, while ETFs, CEFs, REITs, BDCs, and ETNs represent 55.03% of the portfolio and generate 68.80% of the dividend income. I have a 20% maximum sector weight, so when a singular sector gets close to that level, I make sure capital is allocated away from that area to balance things out. In 2022, I will make an effort to even out these portfolio percentages. As more capital is deployed, the bottom half of the portfolio weighting will increase.
|
Industry |
Investment |
Portfolio Total |
% of Portfolio |
|
REIT |
$1,325.94 |
$7,428.64 |
17.85% |
|
ETFs |
$1,265.42 |
$7,428.64 |
17.03% |
|
Closed End Funds |
$1,080.30 |
$7,428.64 |
14.54% |
|
Oil, Gas & Consumable Fuels |
$636.63 |
$7,428.64 |
8.57% |
|
Consumer Staples |
$519.53 |
$7,428.64 |
6.99% |
|
Technology |
$491.39 |
$7,428.64 |
6.61% |
|
Financials |
$479.33 |
$7,428.64 |
6.45% |
|
Communication Services |
$479.22 |
$7,428.64 |
6.45% |
|
BDC |
$414.74 |
$7,428.64 |
5.58% |
|
Utility |
$253.92 |
$7,428.64 |
3.42% |
|
Pharmaceuticals |
$214.02 |
$7,428.64 |
2.88% |
|
Industrials |
$111.07 |
$7,428.64 |
1.50% |
|
Independent Power & Renewable Electricity Producers |
$94.36 |
$7,428.64 |
1.27% |
|
Food & Staple Retailing |
$61.44 |
$7,428.64 |
0.83% |
|
Cash |
$1.33 |
$7,428.64 |
0.02% |
Steven Fiorillo Steven Fiorillo Steven Fiorillo Steven Fiorillo Steven Fiorillo Steven Fiorillo Steven Fiorillo Steven Fiorillo Steven Fiorillo Steven Fiorillo Steven Fiorillo Steven Fiorillo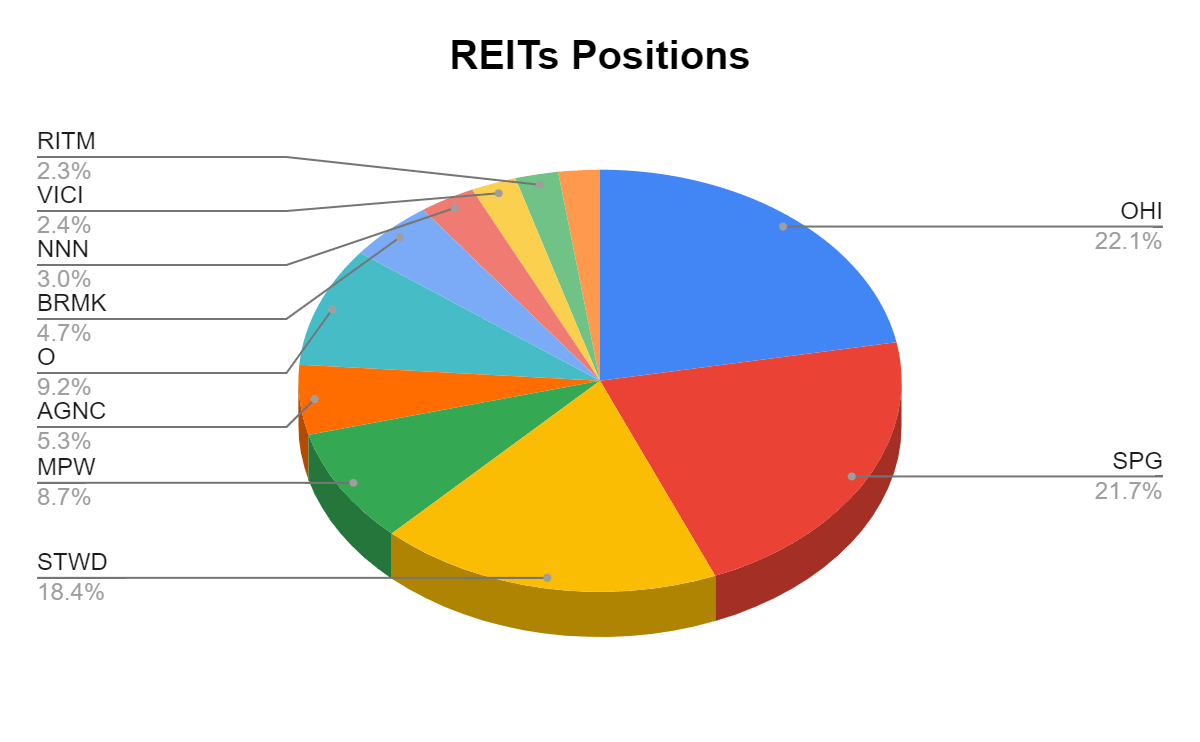
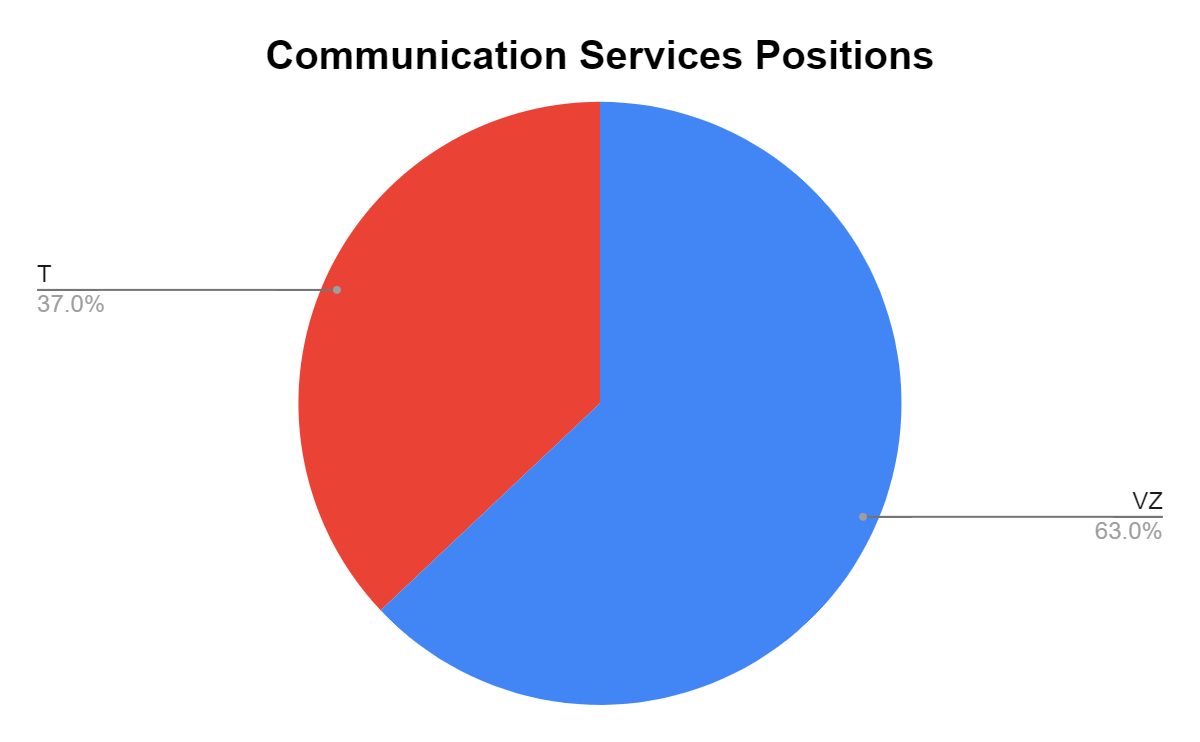


In week 84, Exxon Mobil (XOM) reclaimed the top spot after some time floating around the top-ten. Verizon (VZ) is the only other position that has a weighting of over 4%. There is a good chance that in week 85, I will be adding to at least 1 position in the top-10 holdings.
Steven Fiorillo
Week 84 Additions
In week 84, I used the weekly $100 allotment to add an additional share to:
- Realty Income
- Global X S&P 500 Covered-Call ETF
Realty Income
- REITs have been crushed as the cost of capital has increased, and treasury yields have risen. O is considered the gold standard of commercial real estate by many investors, and its declined by -14.25% over the previous month. O is now yielding over 5%, and I felt this was a great time to add, as O is close to its 52-week lows. O has 11,400 real estate properties and has declared 627 consecutive monthly dividends with 117 increases. If O stays at these levels or drops lower, I will be adding more shares to my position.
Global X S&P 500 Covered-Call ETF
- I recently wrote an article on XYLD explaining why I am still interested in this ETF. As treasury yields reached 3.89%, income investors have a choice of where to generate income as we are no longer in a yield-starved environment. XYLD has paid 111 consecutive monthly dividends and generates a yield that exceeds 10%. I believe that XYLD will appreciate in value when the markets turn, and I plan on continuing to reinvest all of the dividends along the way.
Week 85 Gameplan
In week 85, I am considering adding to the following positions, Walgreens Boots Alliance (WBA), Intel Corporation (INTC), Verizon (VZ), and National Retail Properties (NNN). We will see what occurs, but at least 1 of these names will be added to.
Conclusion
84 weeks have come and gone, and I can’t believe how quickly time has passed. While the markets are down and the Dividend Harvesting Portfolio is in the red, I am very happy with the progress it’s made. I am generating $613.17 in annual dividends from an incredibly diversified portfolio that has been holding up quite well throughout the bear market. I look forward to dollar cost averaging into many of these positions as the weeks progress and what this portfolio will look like in the years to come. Please leave your feedback and suggestions below.
Be the first to comment