

Eoneren/E+ via Getty Images
We have another Dividend Harvesting Series first since I started this series 69 weeks ago. This is the first time I have had 2 consecutive negative weeks since the series inception. Week 68 had marked the 3rd time that the Dividend Harvesting portfolio finished the week in the red.
I feel it’s important to highlight the negatives because in the world of investing, it isn’t always smooth sailing. The Dividend Harvesting portfolio closed week 68 being down -$467.42 (-7.38%). In week 69 the Dividend Harvesting portfolio experienced its first string of consecutive negative weeks. While the Dividend Harvesting portfolio regained some footing going from being down -$467.42 (-7.38%) to -$189.47, it still finished -2.82% from its invested capital. The Dividend Harvesting portfolio has finished 94.2% success rate as its finished 65/69 weeks in the black.
This is the first aspect I wanted to discuss because 2022 has been a rough investment environment for everyone. This portfolio has remained positive for the majority of 2022, but it just experienced its first consecutive weeks of negativity. I am not angry I am quite pleased. I have allocated $6,900, the portfolio is worth $6,710.53, and it’s generating $485.34 in annual dividends, which is a forward yield of 7.23% on the portfolio.
I can’t predict if a bottom is forming or if there is another leg down that the markets will experience. Historically the markets have always appreciated as bear markets are never permanent. I believe there are many good deals in the market if you’re a long-term investor and believe, on a forward basis, this portfolio is undervalued. The wide diversity of underlying assets has created substantial stability, and the never-ending stream of dividend income has helped offset downward declines in the market. This is an environment where the S&P 500 is currently down -18.45% YTD, and the Nasdaq has declined by -26.69%.
Just as I stated last week, I am not concerned about being down a few percent and feel the Dividend Harvesting portfolio will be back in the black sooner than some may suspect. I will continue adding to positions that I see value in and compounding the dividend income. I look at this portfolio as building a stream of income. If I was building a business, I wouldn’t have a market telling me what it was worth every second of every day. I would be focused on growing its profitability and stream of cash flow.
This is exactly how I am treating the Dividend Harvesting portfolio. I am using the data that I have access to and forming a portfolio of individual equities and funds to create a growing income stream for the future. As a long-term investor with decades on my time horizon, this is a project where periods of volatility that needs to be navigated will be inevitable. Ultimately I am pleased with the portfolio’s overall performance and look forward to adding to current and new positions each and every week.
It’s amazing how people click on this series and immediately write a negative comment without either reading the article or just skimming through it without grasping the concept. I started this series due to the number of questions I received regarding where to start with dividend investing. Every investor’s situation is different, and a major misconception about dividend investing is that the initial seed capital needs to be large.
I allocate capital toward big tech, funds, dividends, and growth outside of my retirement accounts. These are not my only investments, but I did open a separate account, so I could easily track and document this series. I intentionally created broad diversification throughout the Dividend Harvesting portfolio so I could benefit from sector rotations and mitigate my downside risk. Investors who are too exposed to growth companies or large-cap tech have gotten crushed as the investment landscape changes. On the growth and tech side of my investments, I am feeling the pain as some of my favorite companies, including Alphabet (GOOGL) (GOOG), Amazon (AMZN), and Meta Platforms (META), have been taken to the woodshed.
This series has never been about hitting a target yield, generating a certain amount of profit, or beating the market. I had two specific goals with this series. The first was to create a blueprint for constructing a dividend portfolio by documenting the journey starting from the beginning. The second goal was to illustrate how allocating capital each week toward investing, regardless of the amount, would be beneficial in the long run.
Too many people are under the illusion that you need tens of thousands or even hundreds of thousands to benefit from investing. Instead of using my real dividend portfolio as an example, I decided to start a new account, fund it with $100, and add $100 weekly, providing a step-by-step guide to dividend investing. This methodology doesn’t have to be used for dividend investing, and it could be as simple as an S&P index fund or a Total Market fund. Hopefully, this series is inspiring people to invest in their future to attain financial freedom.
Steven Fiorillo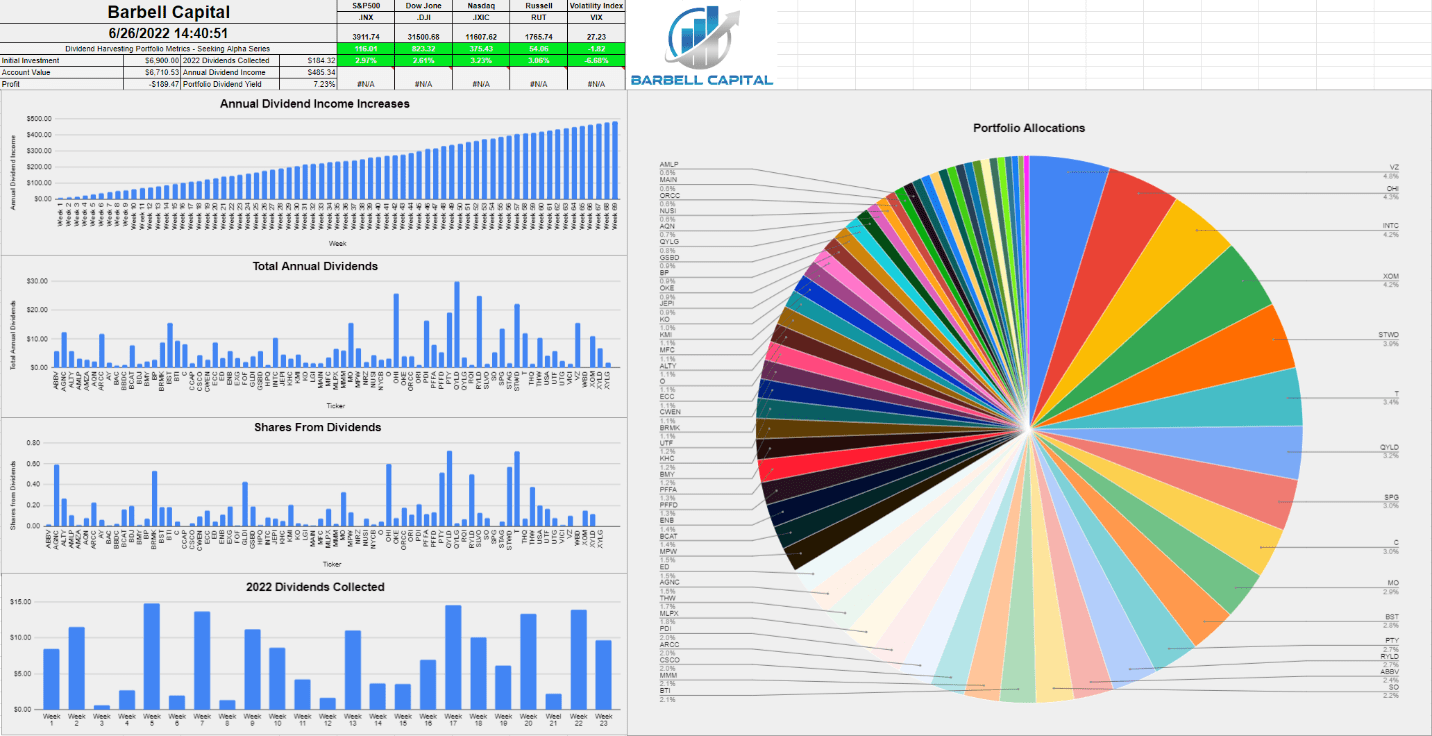
A Historical recap of the Dividend Harvesting portfolio’s investment principles and historical performance
Below are the fundamental rules I have put in place for this portfolio:
- Allocate $100 weekly to this portfolio
- Only invest in dividend-producing investments
- No position can exceed 5% of the portfolio
- No sector can exceed 20% of the portfolio
- All dividends & distributions are to be reinvested
Below is a chart that extends from week 1 thru the current week to illustrate the Dividend Harvesting Portfolio’s Progression
- Blue line is my initial investment $100 in week 1, $1000 in week 10, etc.
- Red line is the account value at the end of each week
- Yellow line is the annual dividend income the Dividend Harvesting Portfolio was projected to generate after that week’s investments and dividends reinvested
Steven Fiorillo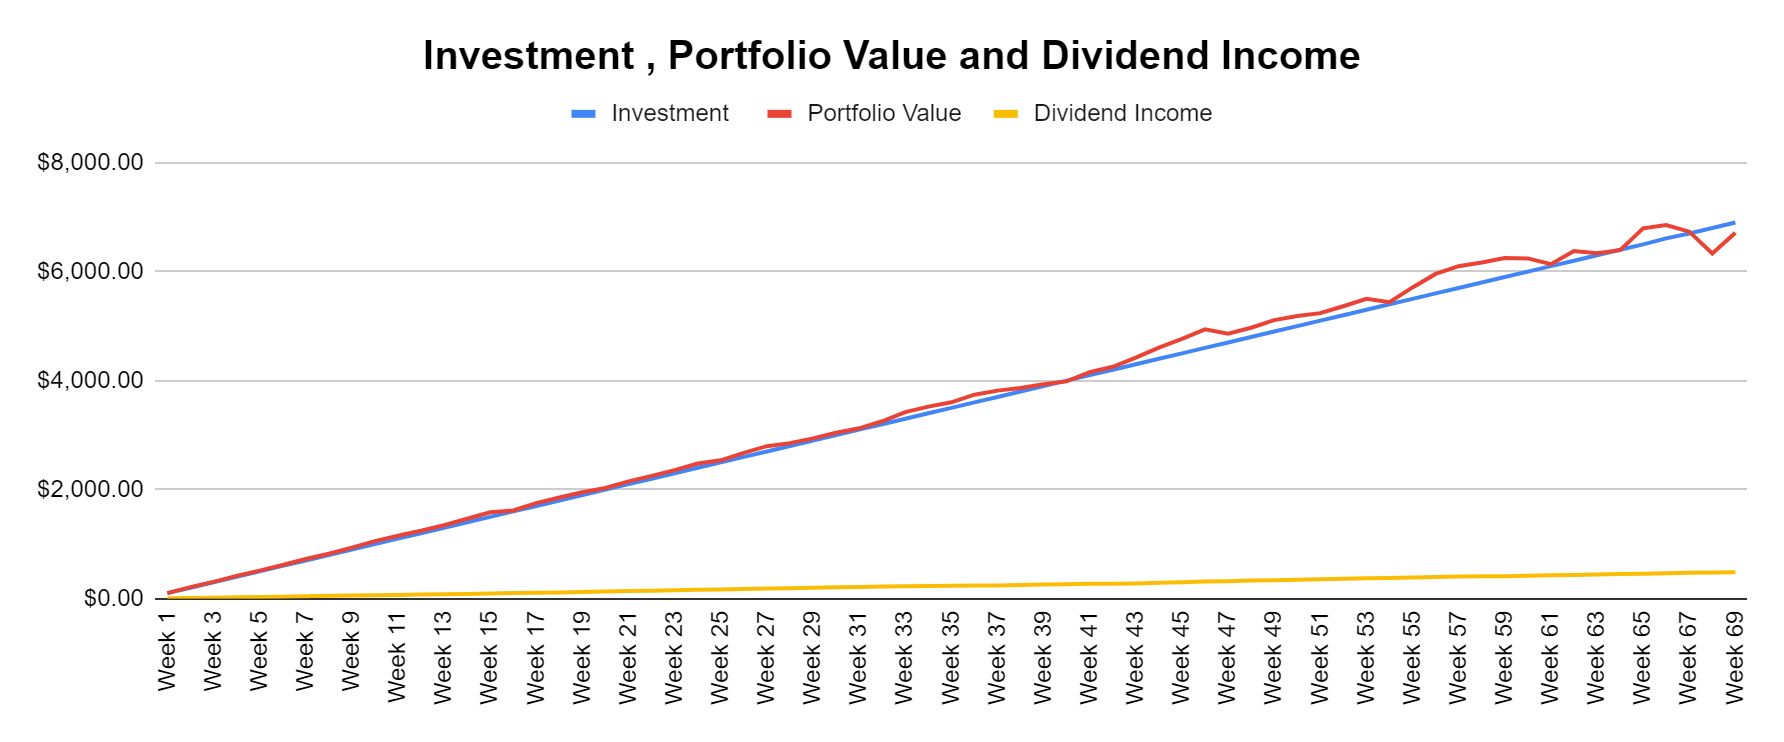
The Dividend Harvesting Portfolio Dividend Section
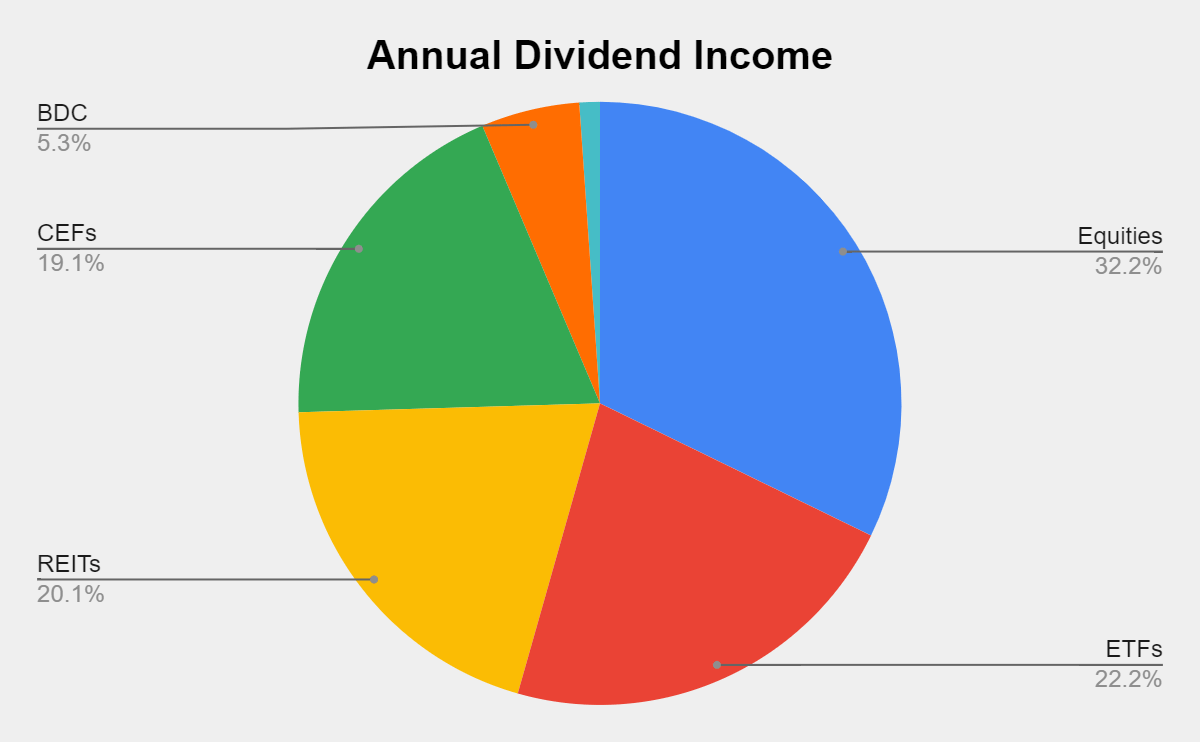
Here is how much dividend income is generated per investment basket:
- Equities $156.38 (32.22%)
- ETFs $107.62 (22.17%)
- REITs $97.71 (20.13%)
- CEFs $92.65 (19.09%)
- BDC $25.64 (5.28%)
- ETNs $5.34 (1.10%)
Steven Fiorillo Steven Fiorillo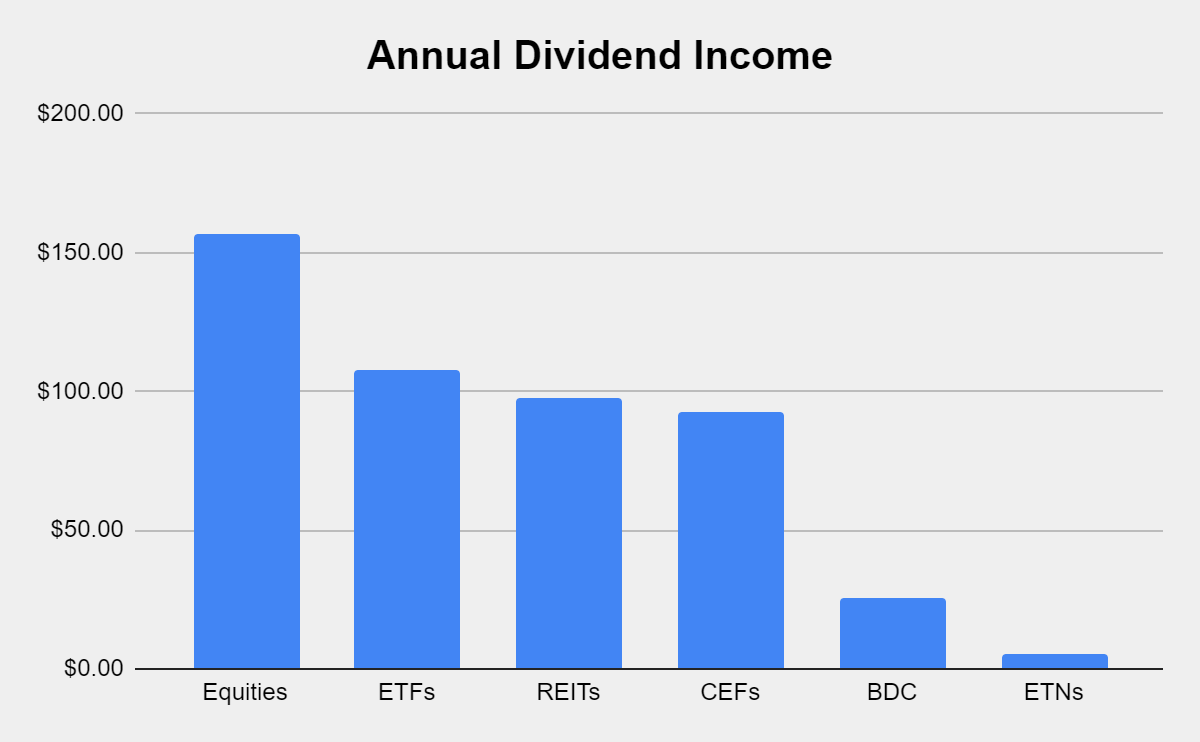
Collecting dividends can serve many functions in a portfolio. Some investors utilize dividends to supplement their income and live off. I am building a dividend portfolio for myself 30 years into the future. Since I am reinvesting every dividend, they serve multiple purposes today. In 2022 alone, I have collected $184.32 in dividend income from 236 dividends across 25 weeks. This has allowed the Dividend Harvesting portfolio to stay in the black while growing the snowball effect.
These dividends allow me to gain additional equity in my investments while increasing my future cash flow in down markets. This style of investing isn’t for everyone, but if you’re looking to generate consistent cash flow while mitigating downside risk, this method has worked for me. I am hoping to collect between $450-$500 in dividends in 2022, which will be reinvested, and finish the year generating >$700 in annual dividends.
Steven Fiorillo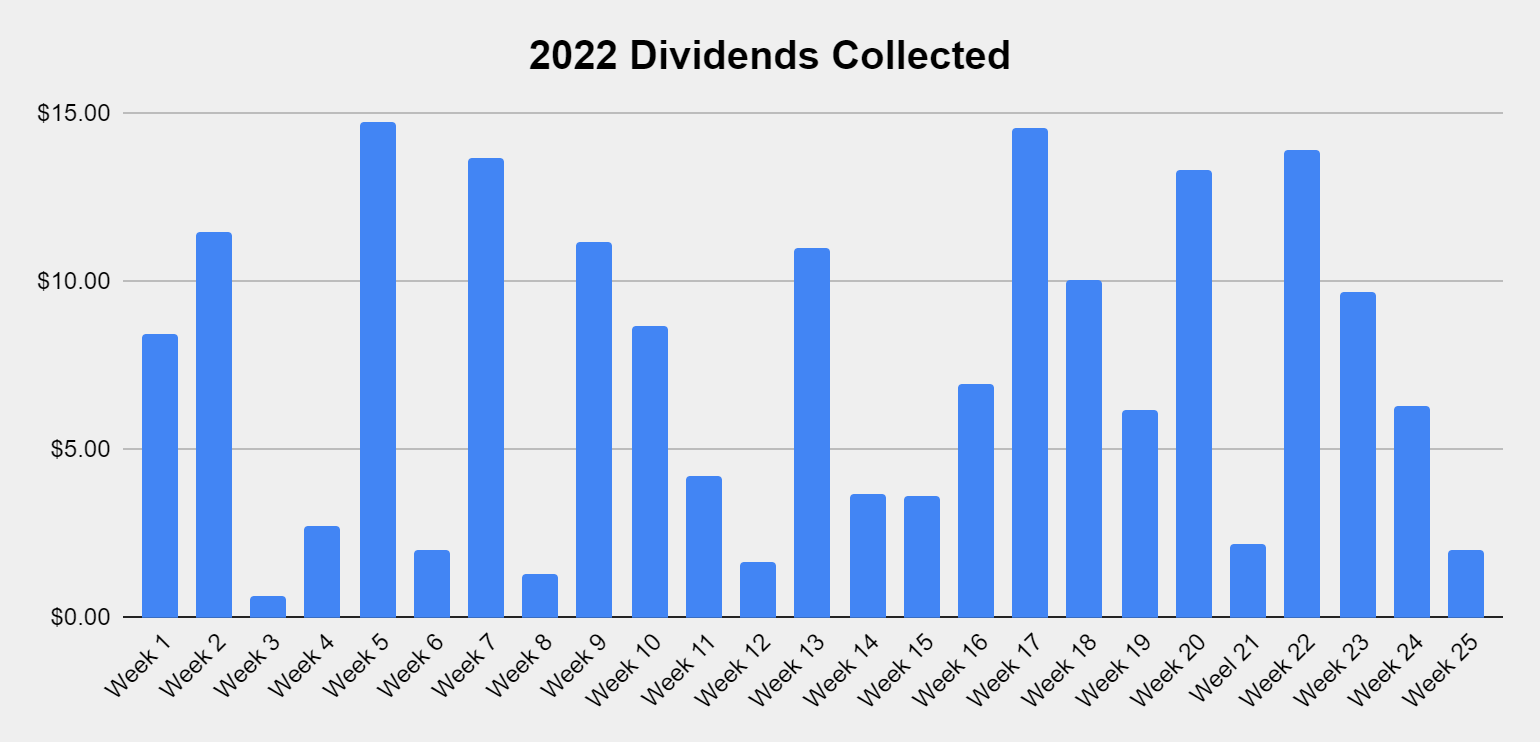
The never-ending stream of dividend income continues to flow within the Dividend Harvesting portfolio. I didn’t add any new positions in week 69, but there are 548 dividends being produced annually. I have my eye on some new positions, and I think this portfolio will definitely exceed 600 annual dividends and might come closer to 650 annual dividends before 2022 is over.
Steven Fiorillo
The goal of generating enough income from the dividends to purchase an additional share per year has been the never-ending project of this portfolio. There are now 5 positions that are generating at least 1 share annually through their dividends, which include the PIMCO Corporate & Income Opportunity Fund (PTY), Broadmark Realty Capital (BRMK), AGNC Investment Corp. (AGNC), the Global X Russell 2000 Covered Call ETF (RYLD), and the Global X NASDAQ 100 Covered Call ETF (QYLD). I am trying to get more of the current positions over the finish line. Eventually, more positions will generate one share per year in dividend income.
|
Shares from Dividends Annually |
||||||||||
|
0-9.9% |
10-19.99% |
20-29.99% |
30-39.99% |
40-49.99% |
50-59.99% |
60-69.99% |
70-79.99% |
80-89.99% |
90-100% |
Generating > 1 share |
|
LGI |
FOF |
NYCB |
PFFA |
GLDI |
T |
ARCC |
PDI |
OHI |
STWD |
QYLD |
|
BP |
MLPX |
KMI |
MO |
BST |
BCAT |
USA |
ECC |
PTY |
||
|
AMLP |
C |
INTC |
GSBD |
MPW |
ALTY |
THW |
BRMK |
|||
|
KHC |
XYLD |
PFFD |
SLVO |
EXG |
RYLD |
|||||
|
JEPI |
AQN |
UTF |
ORCC |
AGNC |
||||||
|
CWEN |
QYLG |
NUSI |
VZ |
|||||||
|
UTG |
BDJ |
BTI |
||||||||
|
SO |
ENB |
MFC |
||||||||
|
RQI |
SPG |
NRZ |
||||||||
|
OKE |
XOM |
|||||||||
|
THQ |
AMZA |
|||||||||
|
XYLG |
CCAP |
|||||||||
|
AY |
CSCO |
|||||||||
|
VICI |
BBDC |
|||||||||
|
STAG |
||||||||||
|
MMM |
||||||||||
|
O |
||||||||||
|
ORI |
||||||||||
|
MAIN |
||||||||||
|
ABBV |
||||||||||
|
ED |
||||||||||
|
HPQ |
||||||||||
|
BMY |
||||||||||
|
KO |
||||||||||
|
BAC |
||||||||||
|
WBD |
||||||||||
The Dividend Harvesting Portfolio composition
REITs have once again become the largest segment of the Dividend Harvesting portfolio. Individual equities make up 48.03% of the portfolio and generate 32.22% of the dividend income, while ETFs, CEFs, REITs, BDCs, and ETNs represent 51.97% of the portfolio and generate 67.68% of the dividend income. I have a 20% maximum sector weight, so when a singular sector gets close to that level, I make sure capital is allocated away from that area to balance things out. In 2022, I will make an effort to even out these portfolio percentages. As more capital is deployed, the bottom half of the portfolio weighting will increase.
|
Industry |
Investment |
Portfolio Total |
% of Portfolio |
|
REIT |
$1,161.71 |
$6,710.53 |
17.31% |
|
ETFs |
$1,037.82 |
$6,710.53 |
15.47% |
|
Closed End Funds |
$955.25 |
$6,710.53 |
14.24% |
|
Oil, Gas & Consumable Fuels |
$548.54 |
$6,710.53 |
8.17% |
|
Communication Services |
$536.04 |
$6,710.53 |
7.99% |
|
Consumer Staples |
$471.46 |
$6,710.53 |
7.03% |
|
Technology |
$471.42 |
$6,710.53 |
7.03% |
|
Financials |
$429.64 |
$6,710.53 |
6.40% |
|
BDC |
$290.41 |
$6,710.53 |
4.33% |
|
Utility |
$285.16 |
$6,710.53 |
4.25% |
|
Pharmaceuticals |
$235.38 |
$6,710.53 |
3.51% |
|
Industrials |
$137.15 |
$6,710.53 |
2.04% |
|
Independent Power & Renewable Electricity Producers |
$107.99 |
$6,710.53 |
1.61% |
|
ETN |
$39.78 |
$6,710.53 |
0.59% |
|
Cash |
$2.78 |
$6,710.53 |
0.04% |
Exxon Mobil (XOM) has moved into the 4th spot in the portfolio, while Verizon (VZ) remains the largest position. Simon Property Group (SPG), which is a relatively new addition, has broken into the top ten and is the 8th largest position in the portfolio.
I was asked a question about if I would trim a position if, for some reason, it caught a bid and appreciated unexpectedly. I thought I would add my comment to the series. Hypothetically if VZ went to $70, it would certainly represent more than 5% of the portfolio next week. I wouldn’t sell a single share. The reason is that I am still allocating capital weekly, and the new capital would dilute its percentage of the portfolio over time. If this was a much larger portfolio that I wasn’t adding to, my answer would be different, and I would probably trim a bit.
This doesn’t mean that I wouldn’t take profits on positions in the portfolio, and I have considered selling XOM in the future. XOM has caught fire, and I am slightly worried about this administration. While I believe XOM is a great long-term hold, this could turn into a situation where I sell in the future and reestablish a position if it sells off. I really need to watch XOM and see what happens.
|
Week 69 Top 10 By % |
|
|
VZ |
4.63% |
|
OHI |
4.18% |
|
INTC |
4.08% |
|
XOM |
4.08% |
|
STWD |
3.83% |
|
T |
3.35% |
|
QYLD |
3.08% |
|
SPG |
2.97% |
|
C |
2.88% |
|
MO |
2.80% |
Week 69 Additions
In week 69 I added 1 share of SPG:
I had originally added 1 share of SPG at $114.61 and indicated that I had no idea if a bottom was in, and if SPG fell below $100, I would add an additional share. Well, I can’t predict bottoms, and I am willing to admit that. I grabbed an additional share of SPG at $98.15, which lowered my average price per share from $114.61 to $106.38. I believe shares of SPG are tremendously undervalued, and I wrote an article about my position which can be read here.
Prior to adding another share of SPG I checked the valuation based on some tables I built. I compared it to Kimco Realty (KIM), National Retail Properties (NNN), Regency Centers Corporation (REG), Federal Realty Investment Trust (FRT), and Realty Income (O).
From a price to FFO methodology, SPG is significantly undervalued as it trades at 8.49x when the next lowest price to FFO is 12.16x from KIM.
Steven Fiorillo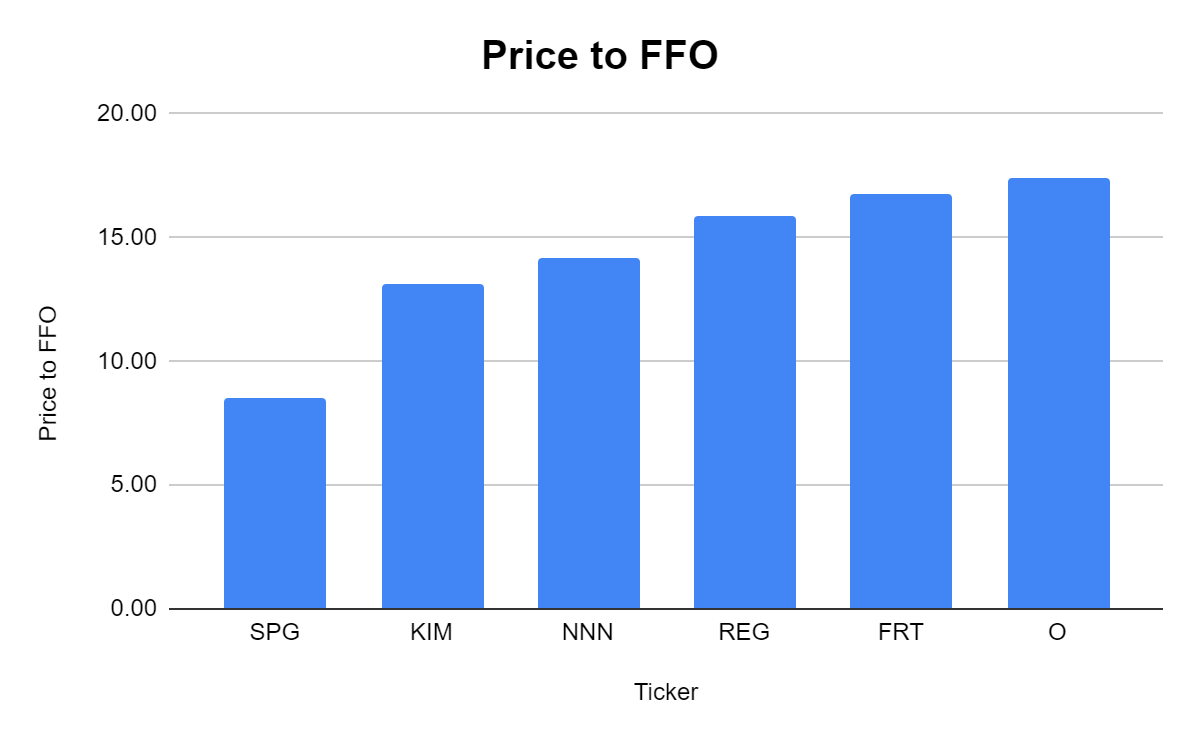
SPG has the 2nd largest FFO coverage ratio indicating its dividend is well secured.
Steven Fiorillo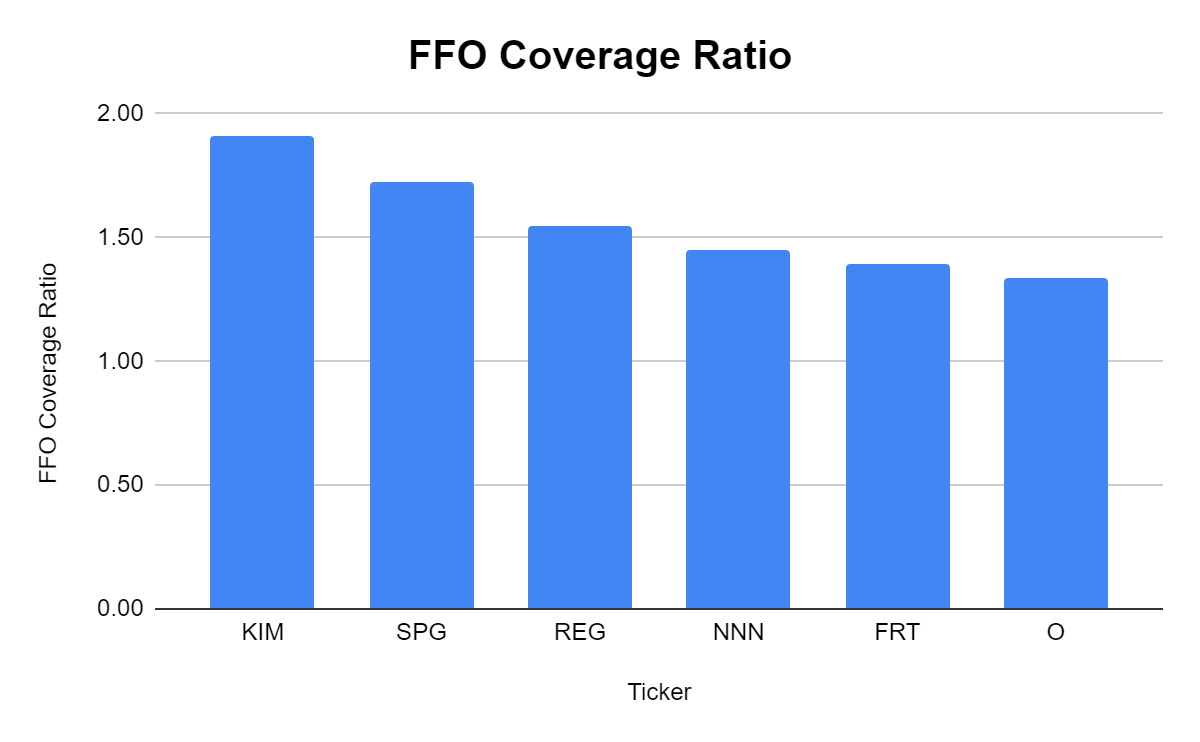
SPG also has the largest dividend yield in the group.
Steven Fiorillo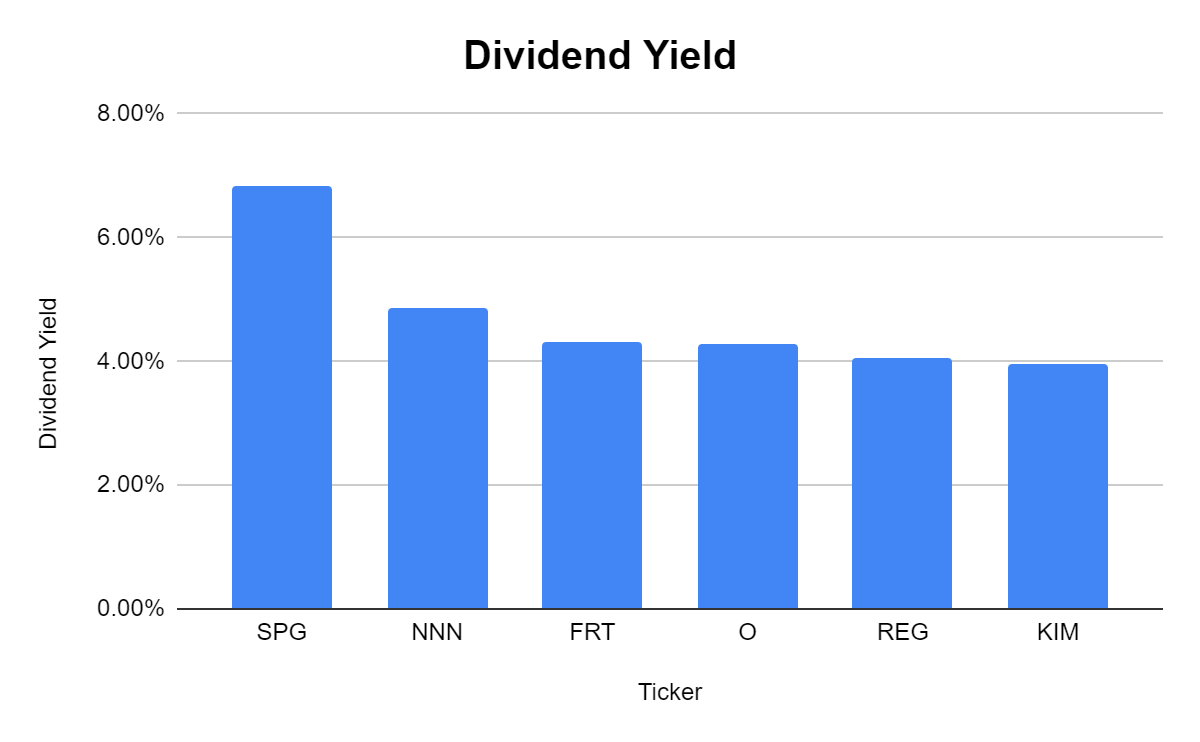
Ultimately, I see value in SPG’s shares and will consider adding an additional share over the next several weeks if I feel that shares are still suppressed.
Week 70 Gameplan
Reader suggestion week is upon us once again. In week 70, I will allocate my $100 investment to new positions suggested by the Dividend Harvesting readers. There have been many great suggestions in the past, and I look forward to hearing about what you believe I should add to this portfolio. Please leave your comments below, and maybe your suggestion will end up in the Dividend Harvesting portfolio.
Conclusion
This was the 1st time since its inception that the Dividend Harvesting portfolio has experienced 2 consecutive negative weeks. I plan on continuing to add to my current positions and adding new positions when opportunities present themselves. In week 69, I added another share of SPG and reinvested every dividend generated. The Dividend Harvesting Portfolio is now producing $485.34 in annual dividends, and I am getting closer and closer to the $500 mark. In week 70, I will add new positions suggested by the readers, so please leave your ideas in the comment section.
Be the first to comment