

Eoneren/E+ via Getty Images
Who said investing was easy? The days of throwing capital at stay-at-home stocks such as Zoom (ZM) are long gone. War is ongoing in Ukraine, commodity prices are sky-high, inflation is the highest it’s been in 40 years, and rates are rising. The magical winning streaks from picking individual stocks have faded away, and even indexing is painful. Like all things, this horrible investing environment shall pass, but while it’s here, it will continue to be painful. The S&P lost -5.9% this week with a -2.91% drop on Friday the 10th, while the Nasdaq declined by -6.72% on the week and -3.52% on Friday the 10th. The Nasdaq has now declined by -28.38% on the year while the S&P inches closer to a bear market, down -18.67% YTD. Many investors are panicking but now isn’t the time to panic. If you’re a long-term investor, the sell-off should be celebrated as it’s allowing you to allocate capital at better prices. History has shown that all bear markets end, and ultimately the markets go up and to the right. I can’t predict the bottom, but I am certainly not worried as my time horizon will outlast this bear market and the next one. The Dividend Harvesting portfolio’s performance is a perfect example of why I am not worried. There are many positions in which share prices have declined since my original purchase date, but since I am continuously buying and dollar-cost averaging into positions, the portfolio is still above water.
In week 66, I added $110 so I could add Simon Property Group (SPG) to the portfolio. In week 67, I added $90 to bring my allocated capital back to the normalized number of $6,700, representing an investment of $100 per week. The markets got rocked, and the Dividend Harvesting portfolio took the blow on the chin. While most of the profit was eroded, the Dividend Harvesting portfolio managed to end one of the most volatile weeks in the black. The ending balance was $6,732.31 as it finished for the 65th time in the money. I don’t care if I am positive by $1, $100, or $1,000; the most important thing to me is building out an income-producing portfolio that can withstand volatility and navigate the markets with versatility. I am constructing a Swiss Army Knife that has a solution for anything the future may hold. There could be a period where this portfolio experiences several consecutive negative weeks, but the weekly capital allocations and generated income are tools that will mitigate downside weakness by buying into weakness and rewarding me during better investing periods.
The Dividend Harvesting portfolio has a 97.01% (65/67) track record of finishing in the black and is projected to generate $472.58 in annual dividends (7.02%). While most of my profit was eliminated from week 66, the $176.02 dividends collected in 2022 protected my downside. Since the series started, there have been many comments about how I measure this portfolio’s success. My suggestion is not to overcomplicate things. The bottom line is I have invested $6,700, and if I was to sell everything right now, I would have $6,732.21. It doesn’t matter what was generated from dividends; at the end of the day, I am still in the black. I intended to construct my own ETF that would trade rangebound to my allocated capital and generate income in the mid-high single digits. The Dividend Harvesting portfolio is achieving my goals, and I classify it as a success.
It’s amazing how people click on this series and immediately write a negative comment without either reading the article or just skimming through it without grasping the concept. I started this series due to the number of questions I received regarding where to start with dividend investing. Every investor’s situation is different, and a major misconception about dividend investing is that the initial seed capital needs to be large. I allocate capital toward big tech, funds, dividends, and growth outside of my retirement accounts. These are not my only investments, but I did open a separate account, so I could easily track and document this series. I intentionally created broad diversification throughout the Dividend Harvesting portfolio so I could benefit from sector rotations and mitigate my downside risk. Investors who are too exposed to growth companies or large-cap tech have gotten crushed as the investment landscape changes. On the growth and tech side of my investments, I am feeling the pain as some of my favorite companies, including Alphabet (GOOGL) (GOOG), Amazon (AMZN), and Meta Platforms (META), have been taken to the woodshed.
This series has never been about hitting a target yield, generating a certain amount of profit, or beating the market. I had two specific goals with this series. The first was to create a blueprint for constructing a dividend portfolio by documenting the journey starting from the beginning. The second goal was to illustrate how allocating capital each week toward investing, regardless of the amount, would be beneficial in the long run. Too many people are under the illusion that you need tens of thousands or even hundreds of thousands to benefit from investing. Instead of using my real dividend portfolio as an example, I decided to start a new account, fund it with $100, and add $100 weekly, providing a step-by-step guide to dividend investing. This methodology doesn’t have to be used for dividend investing, and it could be as simple as an S&P index fund or a Total Market fund. Hopefully, this series is inspiring people to invest in their future to attain financial freedom.
Steven Fiorillo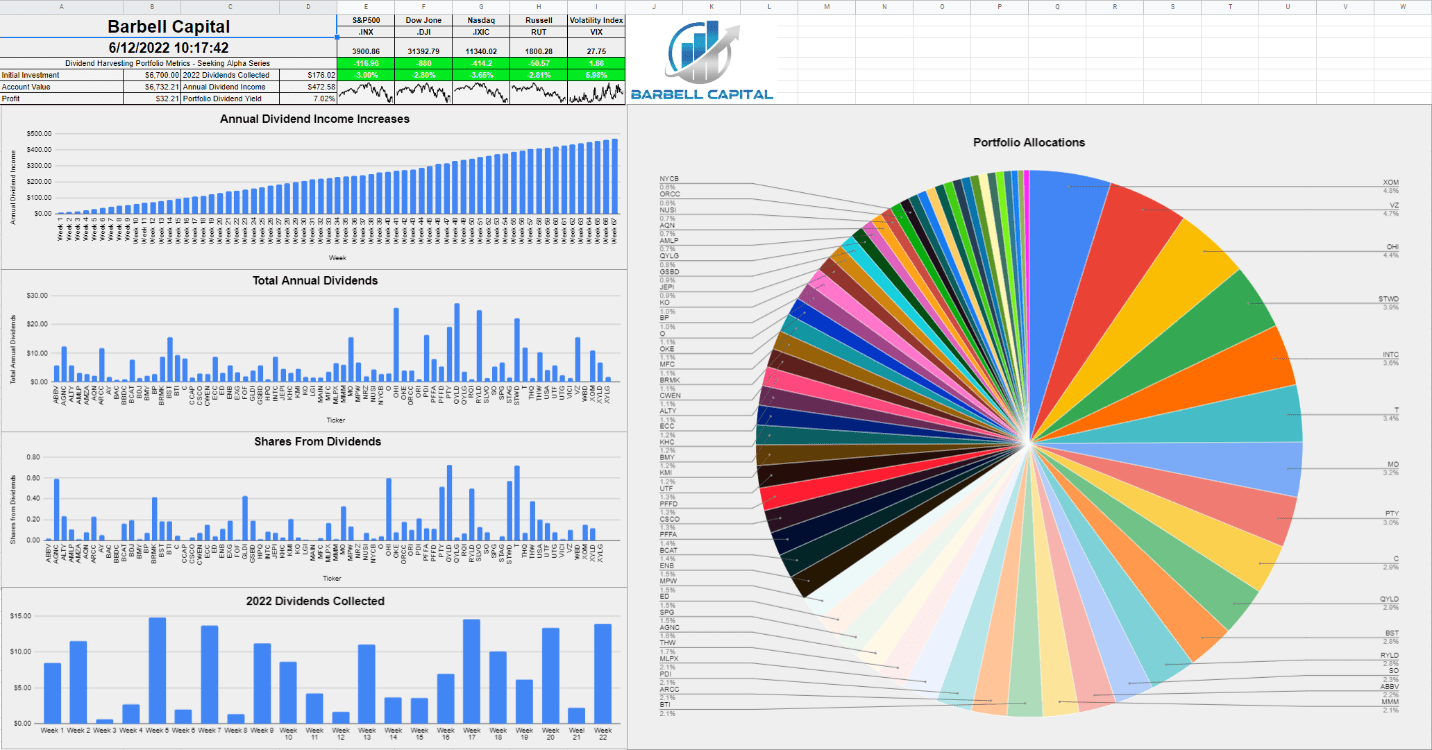
A historical recap of the Dividend Harvesting Portfolio’s investment principals and historical performance
Below are the fundamental rules I have put in place for this portfolio:
- Allocate $100 weekly to this portfolio
- Only invest in dividend-producing investments
- No position can exceed 5% of the portfolio
- No sector can exceed 20% of the portfolio
- All dividends & distributions are to be reinvested
Below is a chart that extends from week 1 thru the current week to illustrate the Dividend Harvesting Portfolio’s Progression
- Blue line is my initial investment $100 in week 1, $1000 in week 10, etc.
- Red line is the account value at the end of each week
- Yellow line is the annual dividend income the Dividend Harvesting Portfolio was projected to generate after that week’s investments and dividends reinvested
Steven Fiorillo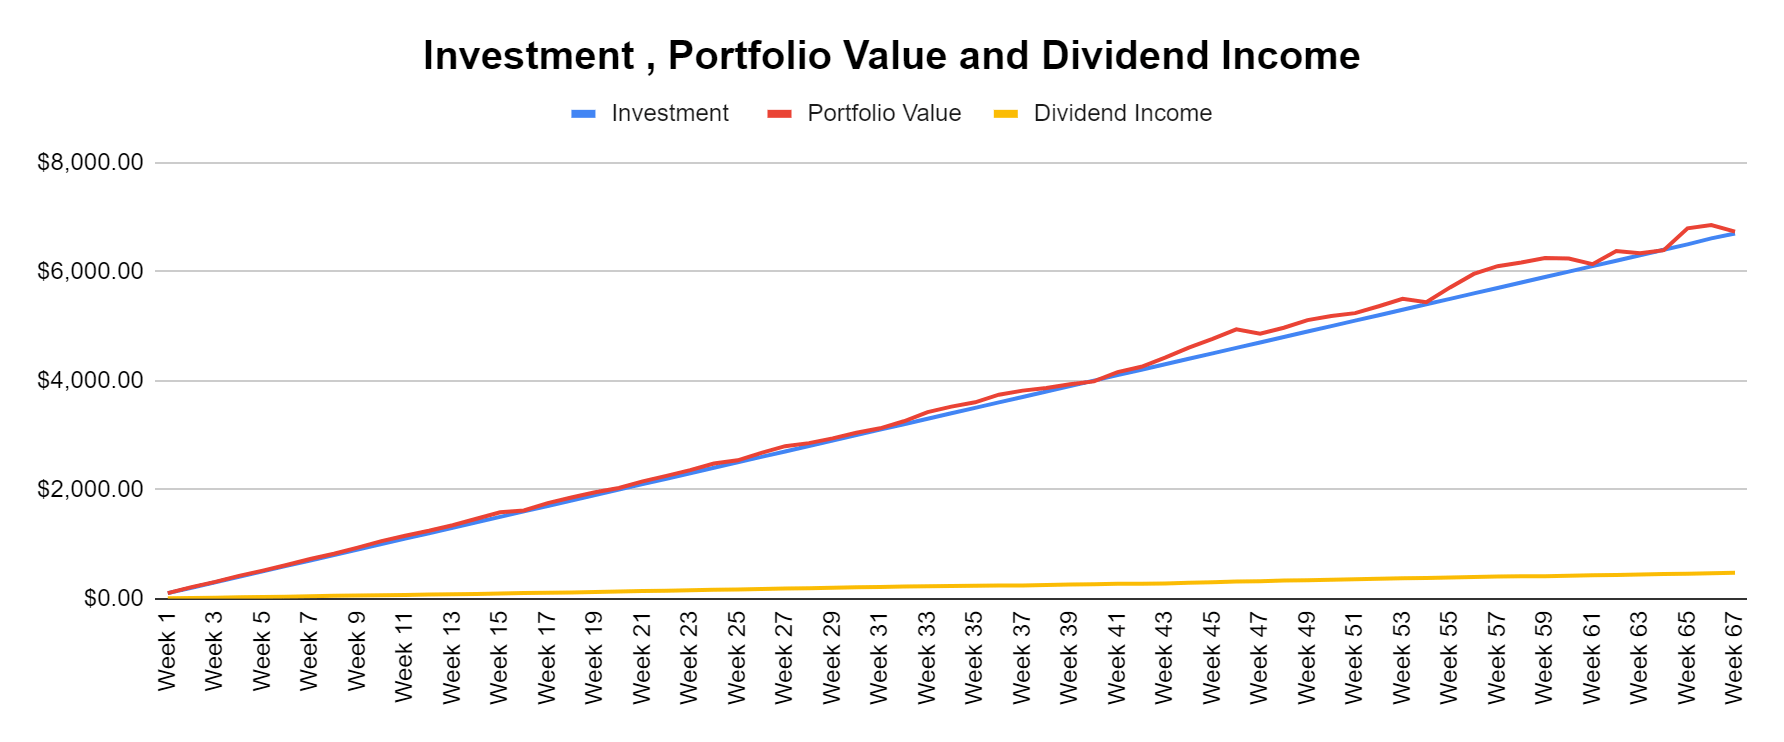
The Dividend Harvesting Portfolio Dividend Section
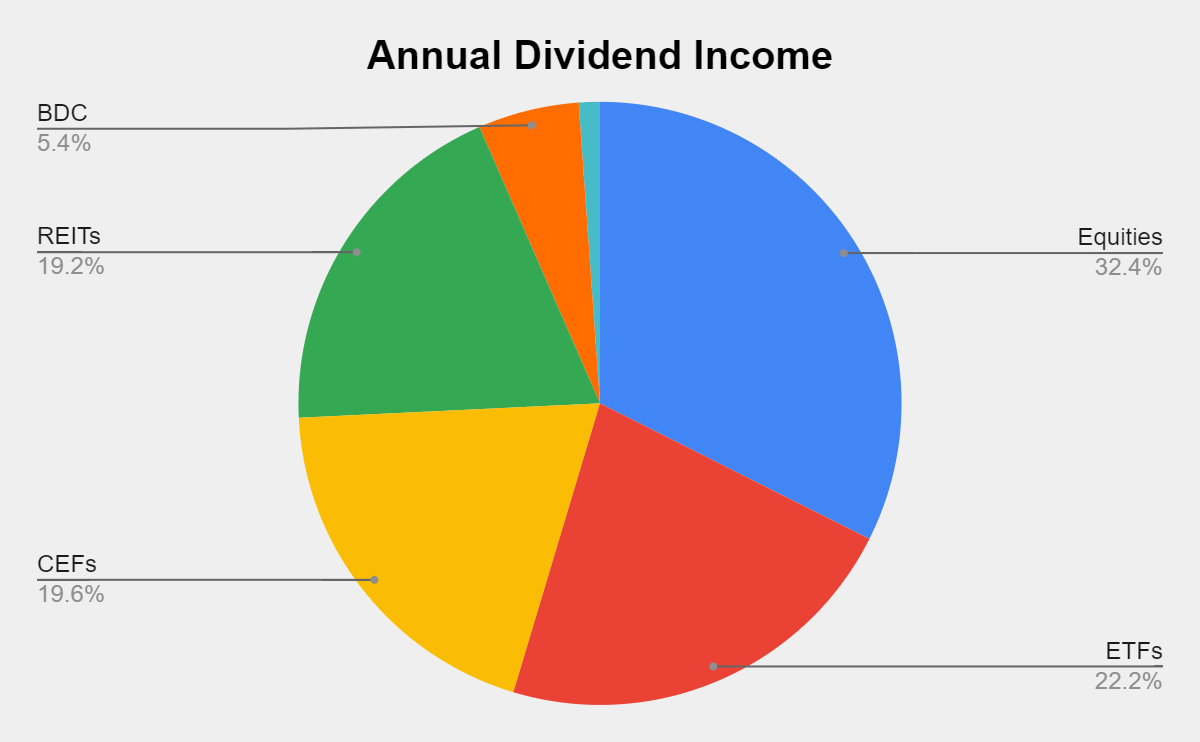
Here is how much dividend income is generated per investment basket:
- Equities $153.20 (32.42%)
- ETFs $105.01 (22.22%)
- CEFs $92.63 (19.60%)
- REITs $90.80 (19.21%)
- BDC $25.60 (5.42%)
- ETNs $5.34 (1.12%)
Steven Fiorillo Steven Fiorillo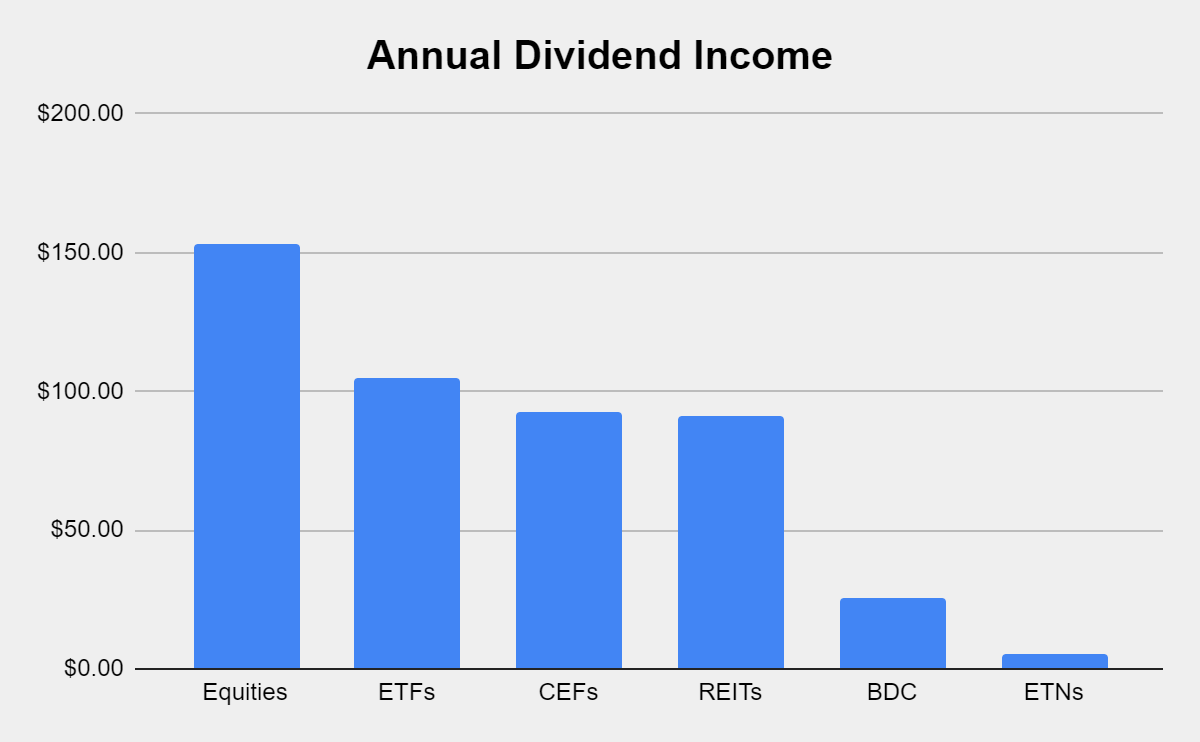
Collecting dividends can serve many functions in a portfolio. Some investors utilize dividends to supplement their income and live off. I am building a dividend portfolio for myself 30 years into the future. Since I am reinvesting every dividend, they serve multiple purposes today. In 2022 alone, I have collected $176.02 in dividend income from 219 dividends across 23 weeks. This has allowed the Dividend Harvesting portfolio to stay in the black while growing the snowball effect. These dividends allow me to gain additional equity in my investments while increasing my future cash flow in down markets. This style of investing isn’t for everyone, but if you’re looking to generate consistent cash flow while mitigating downside risk, this method has worked for me. I am hoping to collect between $450-$500 in dividends in 2022, which will be reinvested, and finish the year generating >$700 in annual dividends.
Steven Fiorillo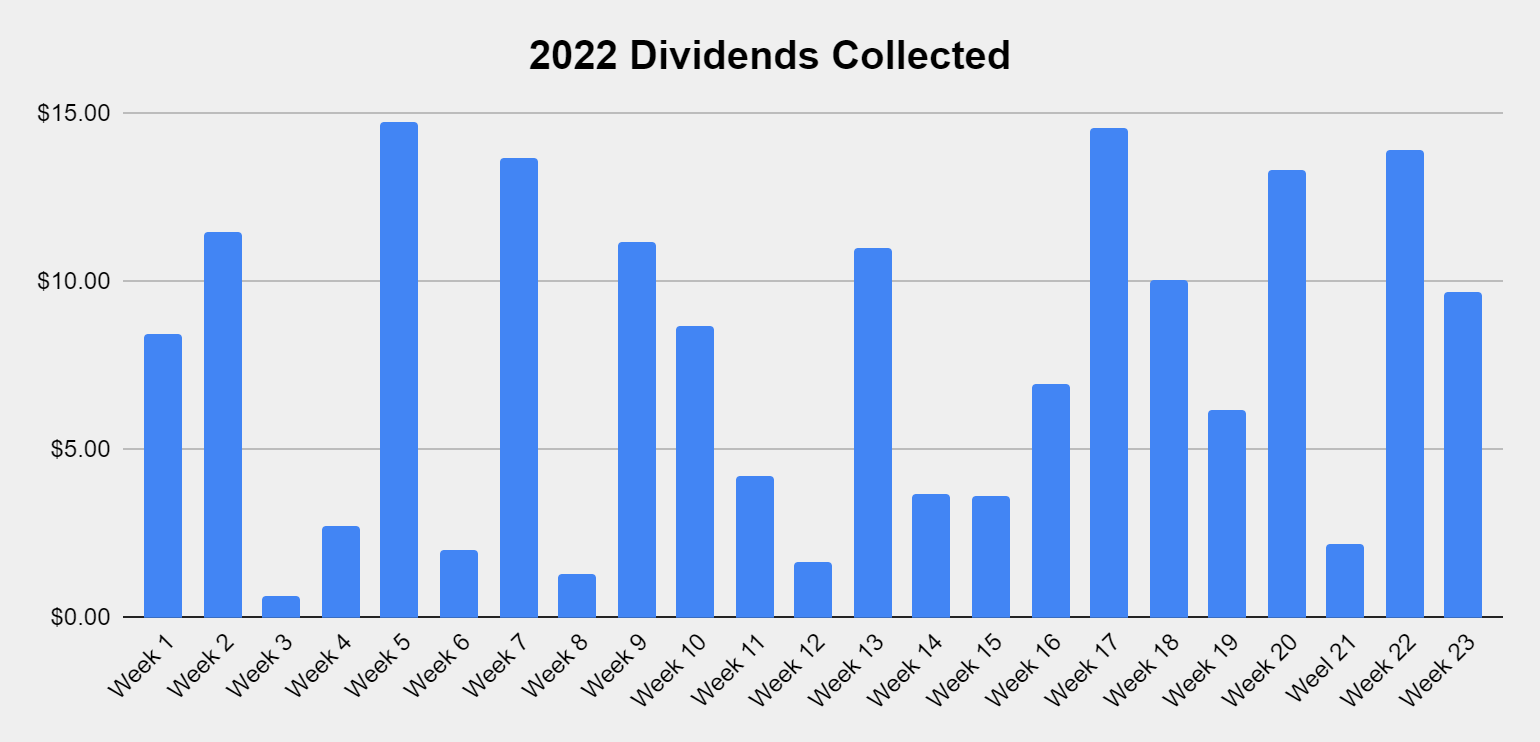
The never-ending stream of dividend income continues to flow within the Dividend Harvesting portfolio. I didn’t add any new positions in week 67, but there are 548 dividends being produced annually. I have my eye on some new positions, and I think this portfolio will defiantly exceed 600 annual dividends and might come closer to 650 annual dividends before 2022 is over.
Steven Fiorillo
The goal of generating enough income from the dividends to purchase an additional share per year has been the never-ending project of this portfolio. There are now 5 positions that are generating at least 1 share annually through their dividends which include the PIMCO Corporate & Income Opportunity Fund (PTY), Broadmark Realty Capital (BRMK), AGNC Investment Corp. (AGNC), the Global X Russell 2000 Covered Call ETF (RYLD), and the Global X NASDAQ 100 Covered Call ETF (QYLD). I am trying to get more of the current positions over the finish line. Eventually, more positions will generate one share per year in dividend income.
|
Shares from Dividends Annually |
||||||||||
|
0-9.9% |
10-19.99% |
20-29.99% |
30-39.99% |
40-49.99% |
50-59.99% |
60-69.99% |
70-79.99% |
80-89.99% |
90-100% |
Generating > 1 share |
|
LGI |
MFC |
ORCC |
PFFA |
GLDI |
T |
THW |
PDI |
OHI |
STWD |
QYLD |
|
CCAP |
FOF |
NYCB |
GSBD |
ALTY |
BCAT |
USA |
ECC |
PTY |
||
|
BBDC |
NRZ |
PFFD |
MO |
BST |
ARCC |
BRMK |
||||
|
AMZA |
C |
KMI |
SLVO |
MPW |
RYLD |
|||||
|
KHC |
MLPX |
INTC |
VZ |
EXG |
AGNC |
|||||
|
BP |
XYLD |
BTI |
||||||||
|
JEPI |
AQN |
UTF |
||||||||
|
CWEN |
QYLG |
NUSI |
||||||||
|
AMLP |
BDJ |
|||||||||
|
SO |
ENB |
|||||||||
|
UTG |
XOM |
|||||||||
|
RQI |
||||||||||
|
THQ |
||||||||||
|
CSCO |
||||||||||
|
SPG |
||||||||||
|
XYLG |
||||||||||
|
OKE |
||||||||||
|
AY |
||||||||||
|
VICI |
||||||||||
|
STAG |
||||||||||
|
O |
||||||||||
|
MMM |
||||||||||
|
ORI |
||||||||||
|
MAIN |
||||||||||
|
ABBV |
||||||||||
|
ED |
||||||||||
|
BMY |
||||||||||
|
HPQ |
||||||||||
|
KO |
||||||||||
|
BAC |
||||||||||
|
WBD |
||||||||||
The Dividend Harvesting Portfolio Composition
ETFs remain the largest segment of the Dividend Harvesting portfolio. Individual equities make up 48.13% of the portfolio and generate 32.42% of the dividend income, while ETFs, CEFs, REITs, BDCs, and ETNs represent 51.87% of the portfolio and generate 67.58% of the dividend income. I have a 20% maximum sector weight, so when a singular sector gets close to that level, I make sure capital is allocated away from that area to balance things out. In 2022, I will make an effort to even out these portfolio percentages. As more capital is deployed, the bottom half of the portfolio weighting will increase.
|
Industry |
Investment |
Portfolio Total |
% of Portfolio |
|
REIT |
$1,074.67 |
$6,732.21 |
15.96% |
|
ETFs |
$1,068.80 |
$6,732.21 |
15.88% |
|
Closed End Funds |
$1,006.39 |
$6,732.21 |
14.95% |
|
Oil, Gas & Consumable Fuels |
$629.66 |
$6,732.21 |
9.35% |
|
Communication Services |
$531.97 |
$6,732.21 |
7.90% |
|
Consumer Staples |
$489.18 |
$6,732.21 |
7.27% |
|
Financials |
$435.41 |
$6,732.21 |
6.47% |
|
Technology |
$392.15 |
$6,732.21 |
5.82% |
|
BDC |
$301.12 |
$6,732.21 |
4.47% |
|
Utility |
$292.42 |
$6,732.21 |
4.34% |
|
Pharmaceuticals |
$222.14 |
$6,732.21 |
3.30% |
|
Industrials |
$139.03 |
$6,732.21 |
2.07% |
|
Independent Power & Renewable Electricity Producers |
$108.20 |
$6,732.21 |
1.61% |
|
ETN |
$40.81 |
$6,732.21 |
0.61% |
|
Cash |
$4.00 |
$6,732.21 |
0.06% |
Exxon Mobil (XOM), Verizon (VZ), and Omega Healthcare Investors (OHI) each remain above 4% of the portfolio holdings. XOM is creeping up to the 5% threshold. I will keep my eye on these, but with no plans of adding to these 3 positions, I am not that concerned about XOM, OHI, or VZ exceeding 5%.
I was asked a question about if I would trim a position if, for some reason, it caught a bid and appreciated unexpectedly. I thought I would add my comment to the series. Hypothetically if VZ went to $70, it would certainly represent more than 5% of the portfolio next week. I wouldn’t sell a single share. The reason is that I am still allocating capital weekly, and the new capital would dilute its percentage of the portfolio over time. If this was a much larger portfolio that I wasn’t adding to, my answer would be different, and I would probably trim a bit.
This doesn’t mean that I wouldn’t take profits on positions in the portfolio, and I have considered selling XOM in the future. XOM has caught fire, and I am slightly worried about this administration. While I believe XOM is a great long-term hold, this could turn into a situation where I sell in the future and reestablish a position if it sells off. I really need to watch XOM and see what happens.
|
Week 67 Top 10 By % |
|
|
XOM |
4.70% |
|
VZ |
4.61% |
|
OHI |
4.28% |
|
STWD |
3.83% |
|
INTC |
3.54% |
|
T |
3.29% |
|
MO |
3.15% |
|
PTY |
2.92% |
|
C |
2.87% |
|
QYLD |
2.85% |
Week 67 Additions
In week 67 I added to the following current positions in the Dividend Harvesting Portfolio:
- New York Community Bancorp (NYCB)
- Global X NASDAQ 100 Covered Call ETF (QYLD)
- Medical Properties Trust (MPW)
- Ares Capital (ARCC)
- Cohen & Steers Closed-End Opportunity Fund (FOF)
NYCB
- My position in NYCB was slightly in the red, and its share price decline pushed its yield past the 7% mark. I believe NYCB will do well in a rising rate environment and that the next several years will be positive for regional banks. I added a share and plan on adding more in the future.
QYLD
- I am a huge fan of QYLD and its cousins from Global X. The Nasdaq has gotten crushed, which has pushed QYLD lower. I added a share to dollar cost average into the position. QYLD has consistently generated double-digit yields and, in 2022, has declined less than the Invesco QQQ ETF (QQQ) on a percentage basis. Regardless of when the markets turn, when the Nasdaq regains the points lost in 2022, QYLD will climb higher. Maybe it will happen in the back half of 2022 or 2023, but until then, I will add shares and reinvest the monthly distributions. With shares of QYLD trading at $17.87, its monthly distribution exceeds 15%.
MPW
- I actually added 2 shares of MPW this week in the Dividend Harvesting Portfolio, in addition to adding shares in my main dividend account. MPW is one of my favorite REITs and has declined to a level that I feel is unjustified. I have an article on MPW coming out next week, and MPW now trades at the lowest FFO to Price multiple from its peer group and eliminated over $1.25 billion in total debt last quarter. With MPW yielding above 7%, this is a buy all day, and I will be adding more to the Dividend Harvesting portfolio.
ARCC
- I previously wrote an article on ARCC and discussed why I am bullish. ARCC is the largest BDC, it trades at an attractive Net investment Income to market cap multiple, and its yield exceeds 8%. ARCC has a long history of growing its dividends while providing a strong coverage ratio. I believe ARCC will do well in a rising rate environment as more small to middle-market companies look to BDC’s for capital.
FOF
- I added a share of FOF because I was down about -4% on the position. FOF is yielding over 9% while trading at a -4.97% discount to NAV. I decided it was time to average down into FOF and if the gap widens between its share price and NAV, I will add another share.
Week 68 Gameplan
I am 100% adding a share of Intel Corp (INTC). INTC closed the week at $39.18 and is down -31.72% on the year. INTC is now yielding 3.73%. I think the move lower is overdone, and these are levels I am happy to dollar cost average at. INTC may be a company that gets added several times over the next 1-2 months. There are also several others I am debating adding as I believe many companies are trading at a discount. MPW could get another share added to its position in week 68, same with Starwood Property Trust (STWD) or Altria Group (MO).
Conclusion
Thank you to everyone who continues to read this series on Seeking Alpha. Please leave any thoughts, ideas, or questions in the comment section. I am closing in on the $500 projected annual income mark, and that should be reached before the summer commences. The next goals will be to reach a portfolio value of $10,000 and generate a projected $1,000 in annual income. As I continue to deploy fresh capital and reinvest each dividend, the snowball effect will continue to grow. I believe that over the next 2 years, this portfolio will reach $1,200 in annual dividends and generate $100 per month in average dividend income. I plan on adding $100 per week indefinitely to this portfolio and documenting the series on Seeking Alpha. It’s going to be exciting to see what this portfolio looks like in 2030 and beyond.
Be the first to comment