jaturonoofer/iStock via Getty Images
Welcome to my dividend growth portfolio review for March and Q1. I made no trades in the month, but it was for a huge reason. I recently accepted and started a new job, so everyday life has taken my attention. That’s been perfectly fine, as I know I’ve gotten my portfolio positioned to be happy with it. It’s been over two months since I’ve made a trade, and it doesn’t bother me.
The first thing I want to highlight is that investing in yourself is always worth it. I’ve learned skills over the past few years in building out my website and tooling for my articles that helped me land a great new job opportunity. This article series has covered my 401k for many years now, and the account itself is even substantially older than the articles. I have some big decisions to make, though I don’t have to make any of them immediately. That also leaves me to ponder over two main questions:
- What will I do with my 401k?
- What will it mean for this article series?
I will likely roll over my 401k, although I’m not positive if it will be to my new company’s plan or an IRA of my choosing. I use M1 Finance on the taxable side, and I really like their tooling. Without becoming too much of a sales pitch, you can create your own custom “pies” and allocate stocks and ETFs to particular weights. From there, any income will automatically go to keeping everything balanced. I think it’s a beautifully simple and easy way to operate, and I love having full control over how my allocations are set up. Of course, it’s not without its downsides; IRAs have much lower yearly limits, so those assets may shift very slowly over time.
On the other hand, I could bring all the assets into my new 401k when that is established. I don’t know what options will be available with that toolset or if there is anything novel, such as the auto-balancing feature. There are benefits in that I can keep the same holdings, and future contributions are at a much higher level than the IRA limits. I’ll have the 401k with my new company; it’s just whether I feel also compelled enough to bring over my other assets.
Finally, it seems incredibly unlikely that I would let the assets sit where they are now. There’s no real benefit to that scenario, new money won’t be going in, and there will be the existing tooling which is rather limited.
When it comes to the article series, I will take a step back for now. I’ve enjoyed writing this series for some time, but it is a labor of love. It takes quite a bit of my free time to aggregate all the data, present it here, and provide my own commentary. With my new opportunity at hand, I will focus my attention there for now. I’ll continue to do my weekly series as I can produce that pretty quickly. I also don’t want to lose the pulse of dividend increases that I care about.
Keeping with the theme, I’ve also stepped down from contributing to the Wheel of Fortune service. I felt it was in the best interest of the service to keep the quality top-notch. I want to thank The Fortune Teller for the opportunity to have my articles featured on his service.
About Me
This article series covers my investing journey towards my eventual retirement as a father of two. Certain stocks or amounts are particular to my self-directed 401k plan.
My portfolio aims to generate a perpetually growing income stream for my wife and me during our golden years. The aim is to live off dividends without touching the principal.
Dividend growth stocks and ETFs are the chosen vehicles to meet that goal. I’m 36 and have 23 years before I can touch this money.
I write as a way also to assist other investors. I hope facets of my strategy that you find attractive and might implement yourself.
Current Year Goals
My goal is to have 10% dividend growth across my holdings. I’m currently at 13.9%. It includes the 4.4% increase from Abbott (ABT), which I have since sold. I didn’t have any increases in March, but I’m quite happy about my progress this year.
YTD, I’ve contributed about $10,000 into my 401k towards the maximum of $20,500. I should reach that goal, although, with my job announcement, it’ll be split across two different plans.
Portfolio Strategy
Buying Criteria
These are the general guidelines I will review to see if something is worth adding to my dividend portfolio or whether I will add to an existing position.
Investing Framework
Here is the first round of questions to review during an initial filtering process of investments.
- What is the opportunity here, and is it better than an existing holding or ETF?
- What are the risks and downsides?
- Will it add meaningful diversification?
- Are we near an all-time high? COVID-19 has shown us how quickly markets can unravel. I may limit how much money I invest when we are near new highs.
- How long is its dividend growth streak, and is it safe (60+ on Simply Safe Dividends)?
Dividend safety scores (Simply Safe Dividends)
Selling Criteria
Here are my guidelines when I may consider a stock sale. I don’t want to sell shares, but I will when circumstances change.
- Company degradation could be deteriorating balance sheets, loss of competitive advantage, and credit rating loss. These factors may come to light before a dividend cut manifests. The pandemic exposed a lot of names in this category.
- A dividend cut, suspension, or paltry increases are red flags.
- Based on available information, I can focus capital on better ideas.
Other Considerations
After announcing its yearly increase, I might add shares before the ex-dividend date. The increase provides a glance into how management thinks the company is operating. A hefty increase is a confirmation from the leadership team that the business is running well.
Trees don’t grow to the sky, and neither do dividend yields. A quality company with a nice dividend increase should see its stock price rise by a similar amount over the year, readjusting to the new and higher dividend amount. I keep tabs when prices dip below their 50/200-day moving averages.
Dividend reinvestment is always on for my holdings. In the past, I played games where I would try to harvest dividends if the cost was above my basis and turn reinvestment on when I could lower it. The stocks and ETFs I want to own should be going up over time. There should be no need to play games. There’s a major red flag if something I own isn’t going up over time or I don’t want more shares.
Finally, I have some simple conditional formatting on my spreadsheet. Cells will be green if I have an opportunity to lower my cost basis. I’ll glance at this when I consider buying more.
Stock cost basis (Dividend Derek)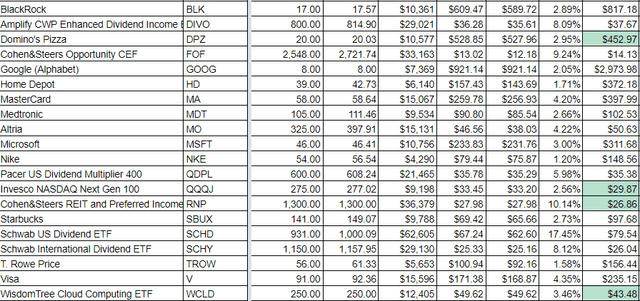
The Portfolio
Here’s the portfolio with a few of my data points highlighted.
| Name | Ticker | % of Portfolio | CCC Status | Percent of Income |
| Apple | (AAPL) | 9.32% | Challenger | 1.62% |
| AbbVie | (ABBV) | 2.78% | Challenger | 3.32% |
| BlackRock | (BLK) | 2.53% | Contender | 2.33% |
| Amplify CWP Enhanced Dividend Income ETF | (DIVO) | 6.17% | None | 10.19% |
| Domino’s Pizza | (DPZ) | 1.58% | Challenger | 0.51% |
| Cohen&Steers Opportunity CEF | (FOF) | 6.84% | None | 19.36% |
| Home Depot | (HD) | 2.67% | Contender | 1.91% |
| Mastercard | (MA) | 4.17% | Contender | 0.78% |
| Medtronic | (MDT) | 2.46% | Champion | 1.90% |
| Altria | (MO) | 4.36% | Contender | 9.67% |
| Microsoft | (MSFT) | 2.68% | Contender | 0.78% |
| Nike | (NKE) | 1.45% | Contender | 0.47% |
| Pacer US Dividend Multiplier 400 | (QDPL) | 4.18% | None | 7.46% |
| Invesco NASDAQ Next Gen 100 | (QQQJ) | 1.57% | None | 0.30% |
| Cohen&Steers REIT & Preferred Income Fund | (RNP) | 6.65% | None | 14.46% |
| Starbucks | (SBUX) | 2.92% | Contender | 2.38% |
| Schwab US Dividend ETF | (SCHD) | 15.94% | None | 15.29% |
| Schwab International Dividend ETF | (SCHY) | 5.97% | None | 3.36% |
| T. Rowe Price | (TROW) | 2.65% | Champion | 2.98% |
| Visa | (V) | 3.95% | Contender | 0.94% |
Here are the values behind the “CCC Status” category:
- Champion/Aristocrat: 25+ years
- Contender: 10-24 years
- Challenger: 5+ years
- King: 50+ years
Dividend Safety
I use the table below to keep tabs on the dividend safety score from Simply Safe Dividends and how that meshes with the S&P credit rating. I also keep tabs on the recent dividend increases for my companies. I add the safety and growth scores to develop an aggregate score. My superstar companies are the ones with a total score of> 100.
| Name | S&P Credit Rating | SSD Safety Score | SSD Growth Score | Total Score |
| BlackRock | AA- | 98 | 18 | 116 |
| Visa | AA- | 99 | 17 | 116 |
| Mastercard | A+ | 99 | 11 | 110 |
| Microsoft | AAA | 99 | 11 | 110 |
| Nike | AA- | 99 | 11 | 110 |
| Medtronic | A | 99 | 8.6 | 107.6 |
| Apple | AA+ | 99 | 7.3 | 106.3 |
| T. Rowe Price | – | 94 | 11 | 105 |
| Home Depot | A | 87 | 15 | 102 |
| AbbVie | BBB+ | 70 | 8.5 | 78.5 |
| Starbucks | BBB+ | 67 | 8.9 | 75.9 |
| Domino’s Pizza | – | 55 | 17 | 72 |
| Altria | BBB | 55 | 4.7 | 59.7 |
This cut of data has led to a few insights and actionable items:
- I mostly own safe (60+ score) companies; Altria is the only one under a 60 rating.
- Generally, out of dividend safety, dividend growth, and current yield, you can pick two.
Performance
Here’s my performance of my holdings versus their benchmark since I’ve first owned shares. Results are sorted against the benchmark, though actual results may not align perfectly with my results due to subsequent purchases. Viewing performance data helps me decide whether I’m better off rolling money into an ETF or adding to my best winners. I have and will sell underperforming holdings based on this data.
| Ticker | Owned Since | Versus Benchmark | Benchmark |
| AAPL | 4/13/2015 | 328.87% | SCHD |
| ABBV | 1/28/2019 | 62.56% | SCHD |
| MSFT | 11/14/2019 | 46.97% | SCHD |
| TROW | 9/29/2016 | 34.74% | SCHD |
| MO | 12/18/2013 | 27.53% | FOF |
| HD | 5/3/2016 | 24.00% | SCHD |
| BLK | 10/16/2019 | 13.48% | SCHD |
| MA | 7/26/2018 | 1.17% | SCHD |
| SCHD | 9/24/2018 | 0.00% | SCHD |
| RNP | 1/12/2022 | -7.51% | VNQ |
| DIVO | 7/8/2021 | -7.81% | SPYD |
| NKE | 5/3/2016 | -8.94% | SCHD |
| FOF | 10/10/2019 | -18.66% | SPYD |
| V | 7/26/2018 | -21.60% | SCHD |
| QQQJ | 6/22/2021 | -24.54% | SCHD |
| DPZ | 11/17/2021 | -28.04% | SCHD |
| MDT | 11/22/2016 | -46.71% | SCHD |
| SBUX | 12/3/2015 | -96.70% | SCHD |
The data runs off the API I host over at Custom Stock Alerts. This set exposes the stock return calculator as an API call available on the web, MS Excel, or Google Sheets.
The next column allows flexibility to define what my benchmark can be. REITs, for example, compare against VNQ. Short of that, I generally compare everything else to SCHD.
Dividend Increases
Dividend Cuts
Trade Summary
My Sells
None
My Buys
None
Charts and Graphs
Dividends
This chart covers a rolling three-month average of my dividend income. The average view smoothens out monthly variations. The data has also fit the blue trend-line pretty closely over time.
Average monthly dividend (Dividend Derek)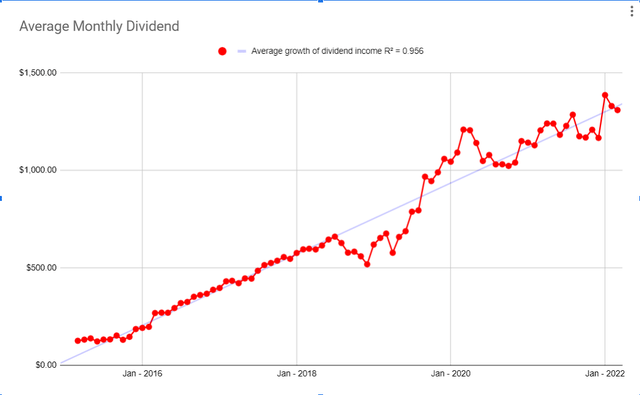
My progress was very steady and consistent for several years. I bounced around from 2019 until 2021 by focusing on growth, then high-yield, and finally back to my core roots.
Dividends by month (Dividend Derek)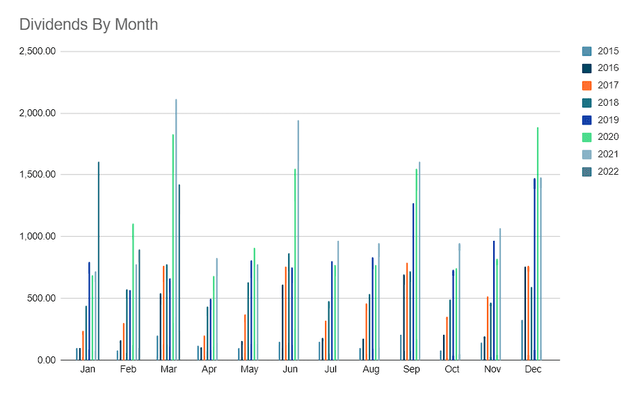
This March was actually only my third best; both 2020 and 2021 beat it in absolute dividends. This has been due to my mix of holdings; I had started accruing more higher-yielding/slower-growing assets in the past. It’s taken two years, but my mix is more balanced now.
Here’s who paid me this month:
Quarterly dividend comparison (Dividend Derek)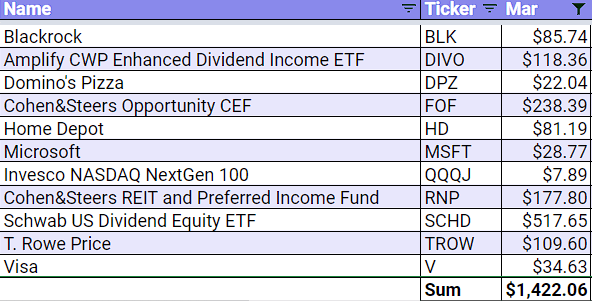
Growth
I created the following graphics to assist in charting my progress over time. This one shows my income per month for the current and prior year and any growth associated. With one-quarter complete, I can begin to make some better observations. I’m currently running about 8.6% ahead of last year, which is some nice growth. That includes the massive hit in absolute terms in March declining from 2021.
Monthly dividend results (Dividend Derek)
Smoothing the data out, here’s the aggregated view of Q1.
Q1 dividend results (Dividend Derek)
The chart below is my projected income view (adding up all known dividend rates multiplied by owned shares). Right now, my best guess is a forward income of $14,816.
Forward-looking income projections (Dividend Derek)
Portfolio Targets
My target portfolio is how I’ve aimed to split money across different asset classes. I shifted my targets a little this month, taking some away from high-yield and giving it to dividend growth.
| Category | Actual | Target | Delta |
| Cash | 0.50% | 5.00% | -4.50% |
| Dividend Growth | 75.77% | 65.00% | 10.77% |
| Growth | 10.24% | 10.00% | 0.24% |
| High Yield | 6.84% | 10.00% | -3.16% |
| REIT | 6.65% | 10.00% | -3.35% |
- “Dividend Growth” comprises my dividend growing holdings and ETFs like (SCHD), (DIVO), and (QDPL).
- “Growth” has my Amazon (AMZN), Alphabet (GOOG) (GOOGL), (QQQJ), and (WCLD) holdings.
- “High Yield” has just (FOF) right now.
- REIT just consists of (RNP).
Visualizations
Income by source (Dividend Derek)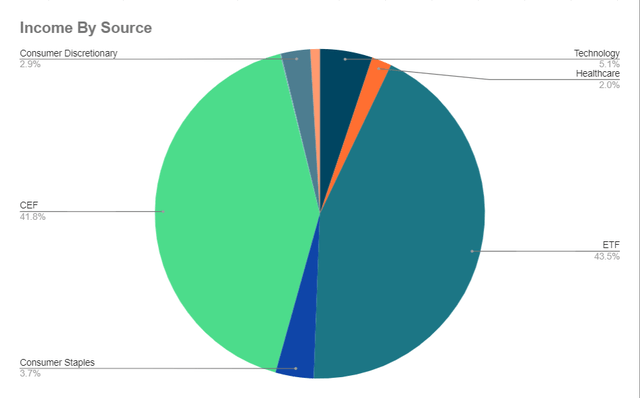
This chart shows the income provided by different sources. ETFs give about 44% of my income, and CEFs (FOF and RNP) now represent about the same at 42%. The remaining 14% I’ve concentrated in a few select sectors.
Sector Allocations
Allocations by sector (Dividend Derek)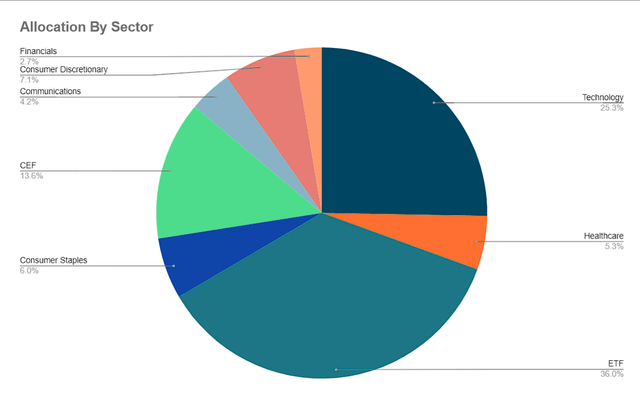
This chart shows how I’ve invested my money. I have 36% in ETFs and 14% in CEFs, allocated across some sectors. I tilt heavily towards tech, and several sectors have no holdings (like industrials, energy, utilities, and materials).
Champion, Contender, Challenger View
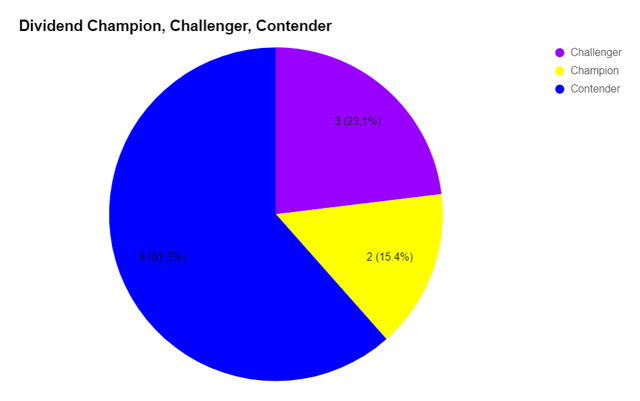
I categorize my picks based on their dividend growth history.
- Kings 50+
- Champions 25+
- Contenders 10+
- Challengers 5+
I use this to help keep me focused on quality, and while it has been beneficial, it is not entirely predictive.
This field on my spreadsheet is an automated pull from my API. I have a “King” status for those with streaks over 50 years. I want to note that the Abbotts per the CCC list are not Champions, though, by legacy S&P rules, they are both Dividend Aristocrats. Also, Altria now shows up as a Challenger and not a King.
Things Coming Up/Action Items
Here’s the new dividend increase scorecard for 2022! Here’s a look at the increases seen this year; Abbott is now hanging on the bottom though I want to keep it for tracking purposes. Next up should be Apple (AAPL) sometime in April.
| Name | 2022 Increase | Increase Month |
| BlackRock | 18.0% | January |
| Domino’s Pizza | 17.0% | February |
| Home Depot | 15.2% | February |
| T. Rowe Price | 11.1% | February |
| AbbVie | 8.4% | January |
| Apple | April | |
| Mastercard | December | |
| Medtronic | June | |
| Altria | July | |
| Microsoft | September | |
| Nike | November | |
| Starbucks | November | |
| Visa | October | |
| Abbott Laboratories | 4.40% | January |
I’ll include one more chart for consideration. Sometime in 2020, I started introducing a scorecard for myself to help with what to buy next.
I give points for:
- When I last purchased it (older earns more points)
- Earnings expectations for individual companies (or a flat score for CEFs and ETFs).
- Bonus points for companies with high dividend safety scores and growth scores
- A few points if the current share price is under my cost basis
- Finally, I tilt for how the position size stacks up against my determined allocation (for example, AAPL is about 9% of my portfolio, and I want it to be 4%). In that example, you can see it near the bottom as the score is punished for being too large to consider buying more.
Portfolio scorecard (Dividend Derek)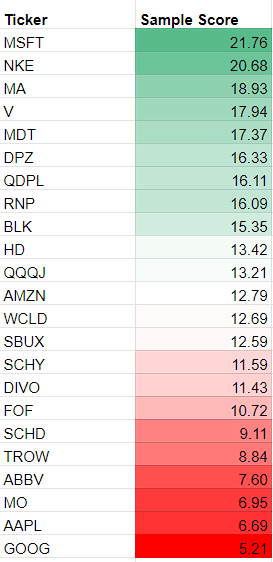
Microsoft and Nike are sitting at the top for having strong expected double-digit earnings growth over the next few years and being relatively underweight per my targets.
Conclusion
The portfolio generated $1,422 in March, down from the $2,114 in 2021. For the quarter, though, I’m up 8.6% over 2021, with $3,927 in dividends.
I haven’t made any trades in a while and probably won’t until I sort out what I want to do with my 401k. I’ll most likely be doing a rollover, but it remains to be seen where the money ends up. Even when that is complete, I’m going to take a step back for now from writing these monthly articles to focus on my new career opportunity. I appreciate all the support, great discussions, and feedback for many years. Thanks for taking the time to read this, and happy investing!


Be the first to comment