

ogichobanov/iStock via Getty Images
Overview
In this series of articles, I will be reviewing Dividend Champions from a specific industry and selecting stocks as long-term buys, current holds, or stocks to avoid based on a variety of financial and valuation metrics. More information regarding the Dividend Champions list can be found here.
I believe that one of the best ways to improve is by looking back and reviewing your past work. Because of this for the first five articles of this series, I will be looking back at the prior articles I wrote on this subject five years ago. For Part 4, I will be looking at Dividend Champions from the food industry sectors. The related article from five years ago can be found here.
Prior Article Review
In the original article from 2017, there were 5 food industry Dividend Champion stocks that I reviewed. Those stocks included:
- Hormel Foods (HRL)
- McCormick & Co. (MKC)
- Lancaster Colony (LANC)
- Sysco (SYY)
- Tootsie Roll Industries (TR)
Based on the metrics I used to review the stocks, the top scoring stock was Hormel and the worst-scoring stock was Tootsie Roll. When looking at each stock’s total returns since the publication of the article, the scoring system performed well, but not as well as I would have liked to see.
Score Ranking vs Total Returns
In the table below, I am listing the 5 reviewed stocks in order of total returns since the original article publication five years ago and comparing that to the score ranking (1 is the highest, 5 lowest) it received at that time.
| Stock | Total Returns Since 11/28/2017 | Score Ranking in Original Article |
| Sysco | 66.46% | 4 |
| McCormick & Company | 62.97% | 2 |
| Lancaster Colony | 49.47% | 3 |
| Hormel Foods | 44.79% | 1 |
| Tootsie Roll | 30.25% | 5 |
As stated earlier, some of the rankings in my prior article were spot on, while a few others did not hit the mark. On the positive side, my 2nd, 3rd, and 5th ranked stocks had total returns that matched exactly with their rankings.
On the negative side, Sysco and Hormel performed in reverse order in terms of their total returns since publication and their rankings within the original article.
Analyzing the Misses
In determining the rankings of the original article, I ranked each stock based on the following criteria: Revenue Growth, Earnings Growth, ROA, ROE, ROIC, Dividend Yield, PE Ratio, and Price to Book value.
Part 4 of this series was a little different than the first 3 in that in the original article there was not a huge difference in the total scores of the stocks and my final recommendation was that Tootsie Roll was the only stock that should be avoided. It has had positive returns over the past five years but also has performed worse than the other four stocks reviewed.
Updating The Scoring System
I will be using a similar ranking system as I used 5 years ago with a few tweaks that I hope will only improve the results in terms of predicting future returns. Each of the metrics I outlined above will continue to be used; however, the following adjustments will be applied:
- Revenue/Earnings Growth – The time frame of these 2 metrics will be shortened from 5 years to 3 years to place more importance on recent growth
- Dividend Growth – This metric will be weighted so that its impact on the total score is reduced by 50%.
- PE Ratio – In the original article, I ranked the stocks based on the trailing PE ratio. For this new series of articles, I will be using its normalized PE ratio to help determine the company’s long-term value.
- Price to Book Value – This metric will be weighted in the same manner as dividend growth
In addition to these updates, I will be adding two additional metrics from YCharts to the rankings of these stocks:
- Fundamental Score – additional details on this score can be found here.
- Momentum Score – additional details on this score can be found here.
Starting in Part 3 of this series of articles, I have also started applying the same weight to the ROA, ROE, and ROIC metrics that have been applied to the Dividend Growth and Price to Book Value metrics.
Stock Changes
As in the prior article, I will only be ranking Dividend Champion stocks. Out of the 5 reviewed stocks from the original article, they all remain on the Dividend Champion stocks list (as of 9/30/2022). There are 5 additional stocks included in the current list (some that appear related to just a change in the naming convention/grouping of industry sectors in the current Dividend Champions list in which both Food Products and Food and Staples Retailing industries are used) and these stocks include:
- Archer-Daniels-Midland (ADM)
- The Andersons (ANDE)
- The J. M. Smucker Company (SJM)
- Walgreens Boots Alliance (WBA)
- Walmart (WMT)
The New Metrics
Revenue Growth
This chart shows revenue growth over the past three years for the ten stocks.
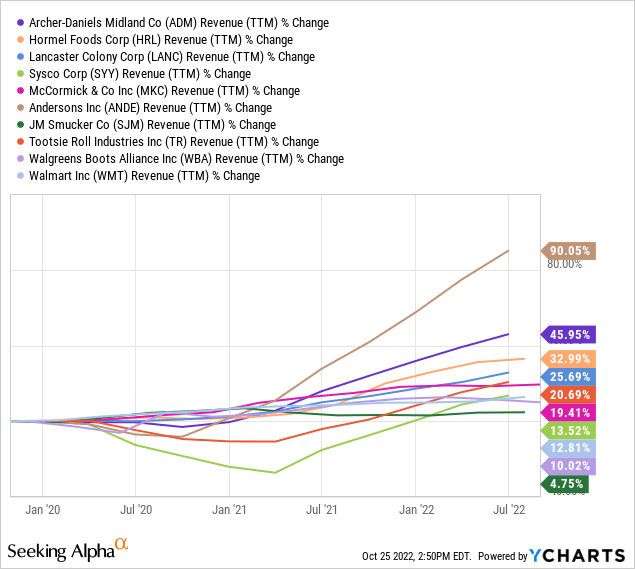
Andersons has seen the highest revenue growth over the past three years by a fairly wide margin. At the bottom of the list is JM Smucker with just 4.75% revenue growth over the past three years.
Earnings Growth
This chart shows the earnings growth of each stock over the past three years.
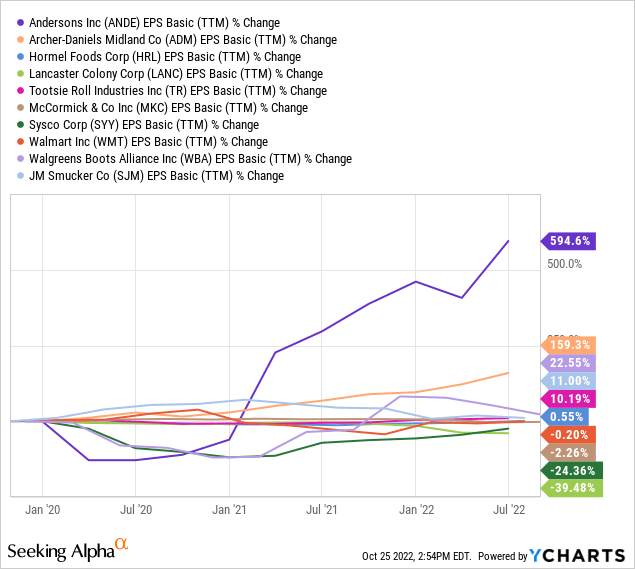
Similar to revenue, Andersons and Archer-Daniels-Midland have seen the highest growth in terms of earnings growth over the past three years. Four of the ten stocks have seen a decline in earnings during this time period with Lancaster Colony seeing the steepest drop.
Return on Assets
This chart shows the current ROA of each of the stocks.
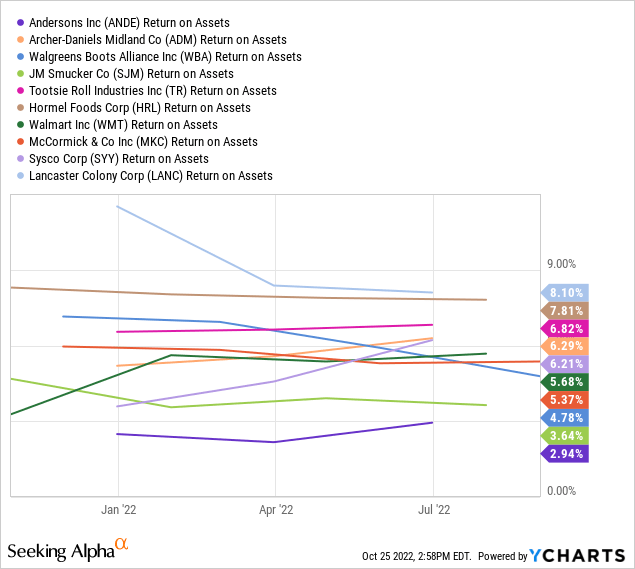
Lancaster Colony has the highest ROA value and Andersons has the lowest.
Return on Equity
This chart shows the ROE values for each stock.
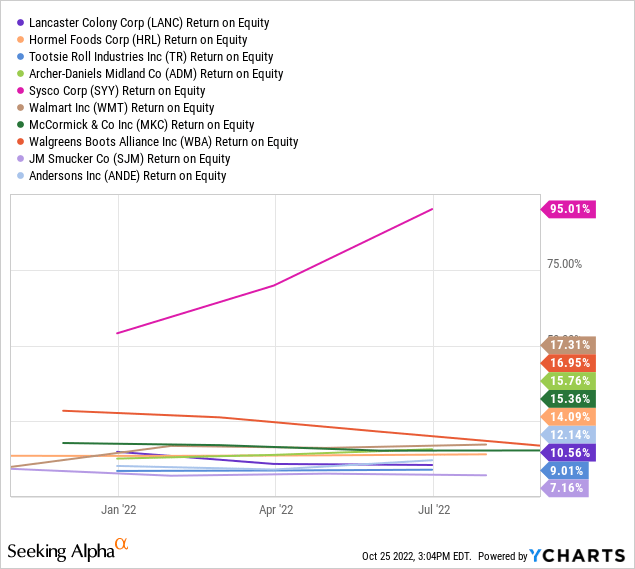
Sysco has the highest ROE value by a pretty wide margin. On the other side of the spectrum, JM Smucker has the lowest ROE value at 7.16%.
Return on Invested Capital
This chart shows the ROIC values for each stock.
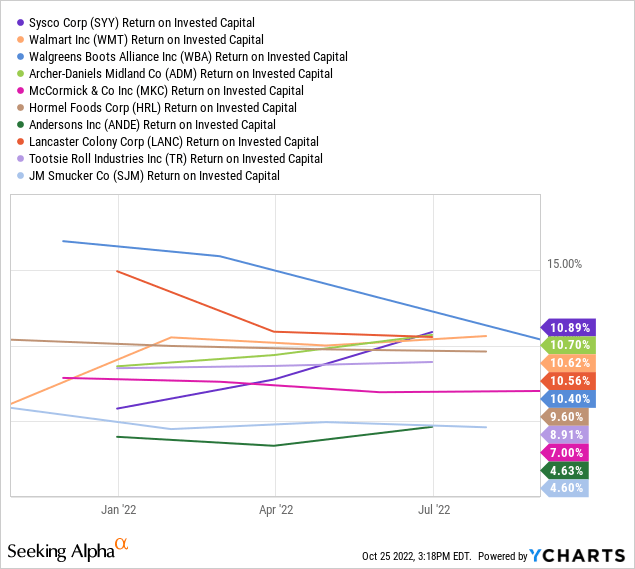
Sysco has the highest ROIC value but is grouped very tightly with the next 6 stocks. JM Smucker has the lowest ROIC value but again is grouped very closely with the next lowest stock, Andersons.
Dividend Yield
This chart shows the current dividend yield of each of the stocks.
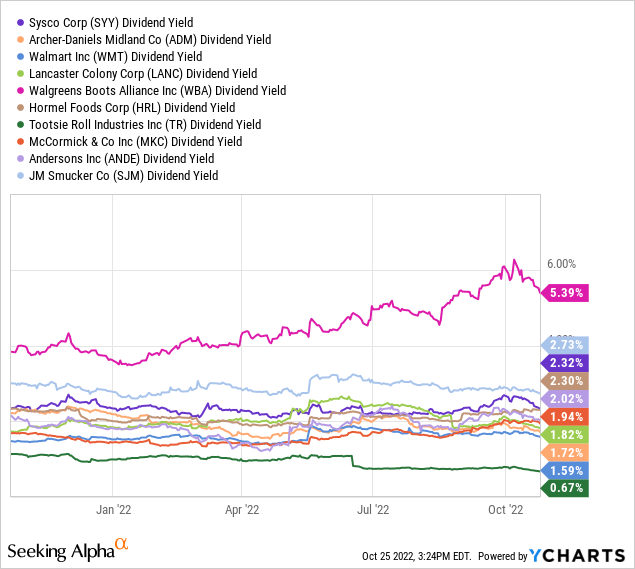
In terms of yield, Walgreens is the only stock with a yield above 3% and has a current yield of 5.39%. On the other end, Tootsie Roll is the only stock with a yield below 1% and has a current yield of 0.67%.
Dividend Growth
The ten stocks listed below are sorted in order of their 5-year dividend growth rate.
- McCormick & Company – 9.50%
- Hormel Foods – 8.87%
- Sysco – 7.78%
- Lancaster Colony – 7.78%
- JM Smucker – 5.66%
- Walgreens – 4.63%
- Archer-Daniels-Midland – 4.50%
- Tootsie Roll – 2.38%
- Andersons – 2.38%
- Walmart – 1.93%
Normalized PE ratio
This chart shows the normalized PE ratio for each of the stocks.
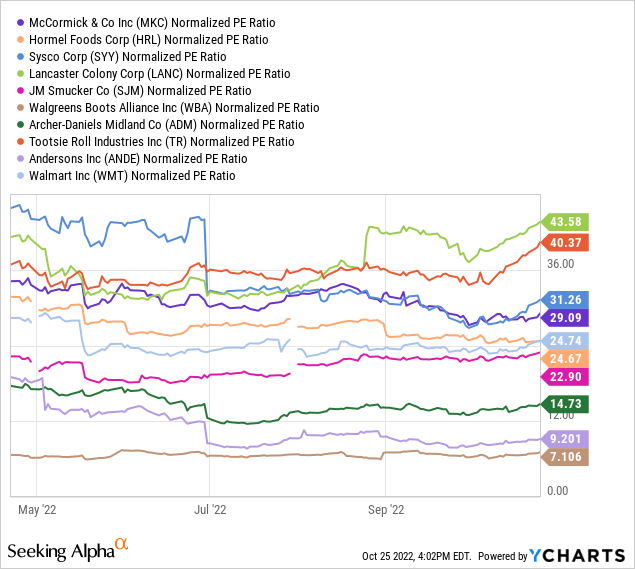
Based on this valuation metric, Walgreens appears to be the most attractively valued and Lancaster Colony is the least attractively valued.
Price to Book Value
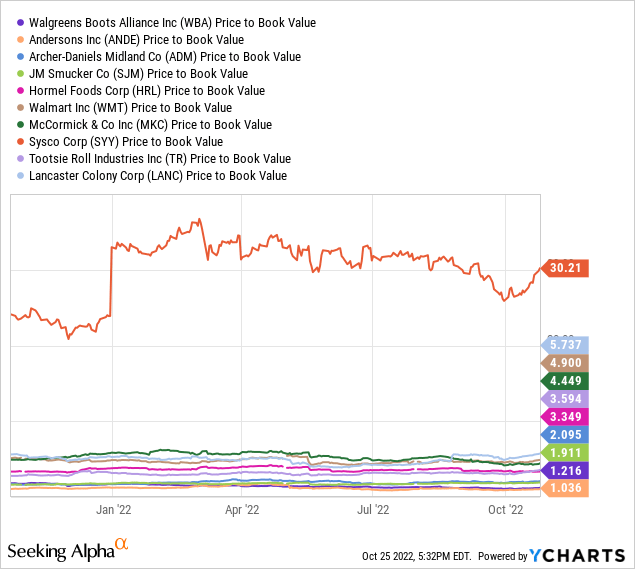
Based on this metric, Andersons appears attractive with 1.04x Price to Book Value while Sysco appears overvalued compared to the rest of the stocks in this list with a soaring 30.21x value.
Fundamental Score
In terms of fundamental scores, two stocks had the highest score of 10 and they are Lancaster Colony and Hormel Foods. Tootsie Roll and JM Smucker each have a score of 9. Sysco has a fundamental score of 7 and Andersons has a fundamental score of 6. The remaining four stocks all have fundamental scores of 8.
Momentum Score
Archer-Daniels-Midland is the only stock with a momentum score of 10, while Walgreens has the lowest score of 5. Walmart also came in near the bottom with a score of 7. Lancaster Colony and McCormick & Company both have scores of 8. The remaining five stocks all have scores of 9.
Score Rankings
In the table below, you will see the 10 stocks sorted in terms of total overall scores. I used pretty much the same system I used in my prior articles with the few adjustments mentioned before. For example, the stock with the highest revenue growth will have a score of 10, while the stock with the lowest revenue growth will have a score of 1. These ranking scores are divided by two for both the Dividend Growth and Price to Book Value metrics as well as the three ROA, ROE, and ROIC metrics. In addition, the two new metrics (Fundamental Score and Momentum Score) will not be scored based on ranking, instead, the actual scores will be added to each stock’s overall score to determine the rankings.
| Revenue Growth Ranking | Earnings Growth Ranking | ROA Ranking | ROE Ranking | ROIC Ranking | Dividend Yield Ranking | Dividend Growth Ranking | Normalized PE Ratio Ranking | Price to Book Value Ranking | Fundamental Score | Momentum Score | Total Score | |
| Archer-Daniels-Midland Company | 9 | 9 | 3.5 | 3.5 | 4.5 | 3 | 2 | 8 | 3.5 | 8 | 10 | 64 |
| Hormel Foods Corporation | 8 | 5 | 4.5 | 2.5 | 2.5 | 7 | 4.5 | 6 | 3 | 10 | 9 | 62 |
| The Andersons, Inc. | 10 | 10 | 0.5 | 2 | 1 | 6 | 1.25 | 9 | 5 | 6 | 9 | 59.75 |
| Walgreens Boots Alliance, Inc. | 2 | 8 | 1.5 | 4 | 3 | 10 | 2.5 | 10 | 4.5 | 8 | 5 | 58.5 |
| The J. M. Smucker Company | 1 | 7 | 1 | 0.5 | 0.5 | 9 | 3 | 7 | 4 | 9 | 9 | 51 |
| Sysco Corporation | 4 | 2 | 3 | 5 | 5 | 8 | 3.75 | 3 | 0.5 | 7 | 9 | 50.25 |
| McCormick & Company, Incorporated | 5 | 3 | 2 | 3 | 1.5 | 5 | 5 | 4 | 2 | 8 | 8 | 46.5 |
| Lancaster Colony Corporation | 7 | 1 | 5 | 1.5 | 3.5 | 4 | 3.75 | 1 | 1 | 10 | 8 | 45.75 |
| Tootsie Roll Industries, Inc. | 6 | 6 | 4 | 1 | 2 | 1 | 1.25 | 2 | 2.5 | 9 | 9 | 43.75 |
| Walmart Inc. | 3 | 4 | 2.5 | 4.5 | 4 | 2 | 0.5 | 5 | 1.5 | 8 | 7 | 42 |
Conclusion
The top 2 stocks
Looking at the table above, you can see that the two stocks with the highest overall scores include:
- Archer-Daniels-Midland – Total score of 64
- Hormel Foods – Total score of 62
The bottom 2 stocks
The score range from the top stocks to the bottom is fairly drastic. The four lowest score stocks include:
- Tootsie Roll – Total score of 43.75
- Walmart – Total score of 42
The remaining 6 stocks
The remaining eight stocks have scores that range from 59.75 to 45.75. These stocks include:
- Andersons – Total score of 59.75
- Walgreens – Total score of 58.5
- JM Smucker – Total score of 51
- Sysco – Total score of 50.25
- McCormick & Company – Total score of 46.5
- Lancaster Colony – Total score of 45.75
Final Thoughts
Tootsie Roll was the one stock I said should be avoided in my original article five years ago and it performed the worst when compared to the other stocks reviewed in that original article. Things don’t seem to have gotten much better as the stock ranked 2nd to last this time around. It was able to escape the bottom only because of the poor performance by Walmart in terms of revenue/earnings growth and the worst dividend growth over the past five years.
There is nothing I see about these two stocks that would suggest they should be considered over the other 8 stocks in these food industry sectors, especially the top two stocks of ADM and HRL.
In terms of the middle six stocks, I think they all remain decent picks for long term investors based on their overall goals. While Andersons has the lowest fundamental score and some of the lowest ROA, ROIC, ROE values, the stock has seen the highest revenue and earnings growth over the past three years.
Walgreens will certainly be attractive to income investors with its yield over 5%, while McCormick & Company could be a great fit for dividend growth investors as it has seen the highest 5-year dividend growth rate out of these ten stocks.
As always, I suggest individual investors perform their own research before making any investment decisions. For part 5 of this series, I will be using the updated metrics and ranking system from reviewing my past articles and applying them to the Dividend Champion stocks within the Water Utilities industry.
Be the first to comment