

DNY59/E+ via Getty Images
Investment Thesis
There is no doubt that the market did not expect Digital Turbine, Inc (NASDAQ:APPS) to report revenues of $184.1M in FQ4’22. However, it is essential to note that this is attributed to the changes in its accounting report methods, since the company still reported decent YoY revenue growth of 19%. Nonetheless, given the potential deceleration of revenue growth against the hypergrowth during the COVID-19 pandemic, the stock would have declined anyway, though at an admittedly slower rate.
As a result, though APPS represents a solid stock for a long-term hold, it is apparent that the time to add is not here yet, given the potential retracement in the next few weeks as the market continues to dwell in bearish sentiments.
APPS’ Pandemic Hyper-Growth Has Officially Ended By FQ4’22
APPS Revenue and Gross Income
S&P Capital IQ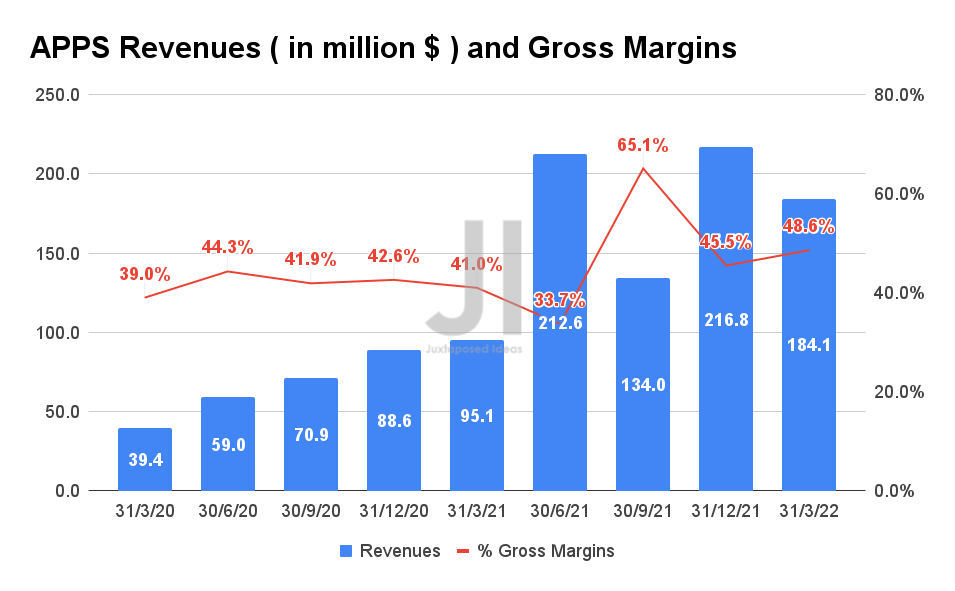
In the past five years, APPS reported revenue growth at an impressive CAGR of 79.43%, mostly attributed to the tremendous growth in the past two years at an average of 130% YoY. For FY2022, the company reported revenues of $747.6M, representing an excellent increase of 41% YoY, with revenues of $184.1M in FQ4’22, with YoY growth of 19%, both on a pro forma basis. Its gross margin also improved YoY from 41% in FQ4’21 to 48.6% in FQ4’22. However, it is also important to note that these were partly attributed to its recent acquisitions of Appreciate, AdColony, and Fyber in 2021.
Nonetheless, since analysts and investors were expecting revenues in the range of $300M with a consensus revenue estimate of $336.45M, representing YoY growth of 253.9%, it is apparent that many were taken aback by the changes in its accounting reporting method. Therefore, it is evident that the stock experienced a 41.2% stock price decline from its pre-earnings call stock price of $25.43 on 31 May 2022 to $14.94 on 16 June 2022.
Nonetheless, due to APPS’ aggressive expansion of its product offerings and media collaborations with key media partners, such as TikTok and AccuWeather, we may expect to see sustained improvement in its revenue growth moving forward, given the excellent growth in its revenue per device. In the US alone, the company had reported impressive revenue per device growth at a CAGR of 49.6% in the past two years, from $2.10 in FY2020, $3.30 in FY21, and finally $4.70 in FY2022. In addition, with 19.8% YoY growth in added devices from 222M in FY2021 to 266M in FY2022, we concur with consensus estimates on APPS’ projected revenue growth moving forward.
APPS Net Income and Net Income Margin
S&P Capital IQ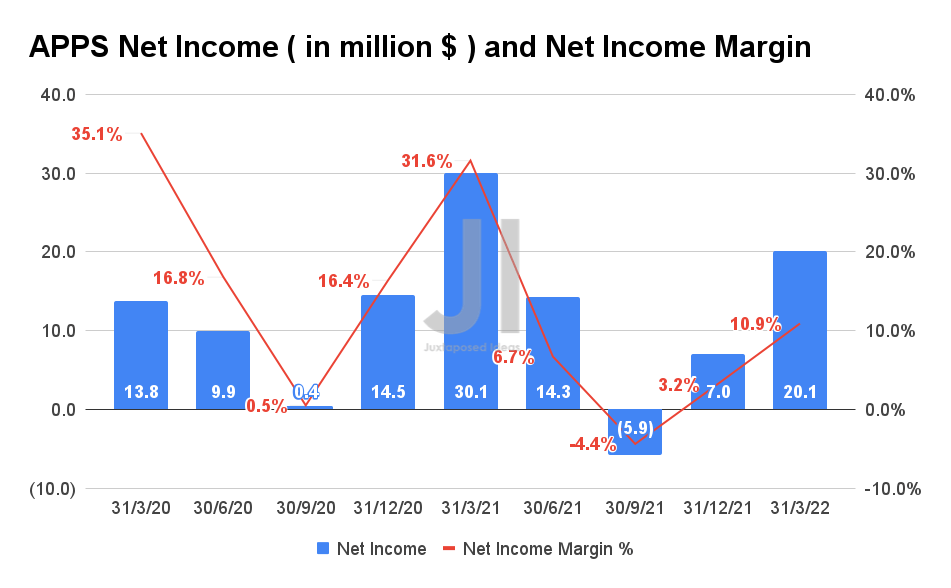
In FQ4’22, APP reported net incomes of $20.1M with a net income margin of 10.9%, representing an increase of 40.5% and 4.2 percentage points YoY, respectively. The company also reported a Free Cash Flow (FCF) of $33.7M in FQ4’22 with improved FCF margins of 33.7%, representing YoY growth of 293% and 6.2 percentage points, respectively. Therefore, it is evident that APPS reported decent profitability in FQ4’22, though the company also increased its reliance on debt to increase its cash and equivalents to $127.2M on its balance sheet to support its high operating costs.
APPS Cash/ Equivalents, FCF, and FCF Margins
S&P Capital IQ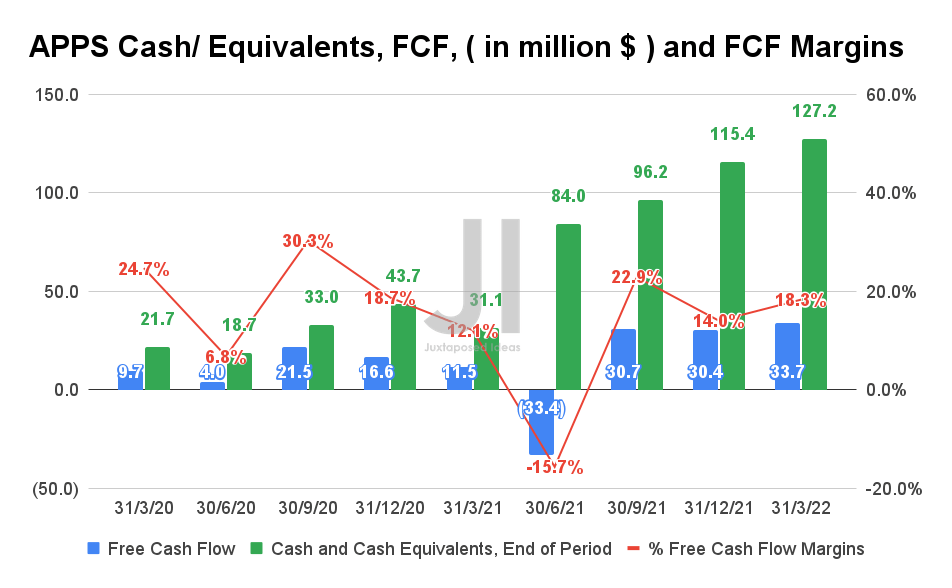
APPS Operating Expense
S&P Capital IQ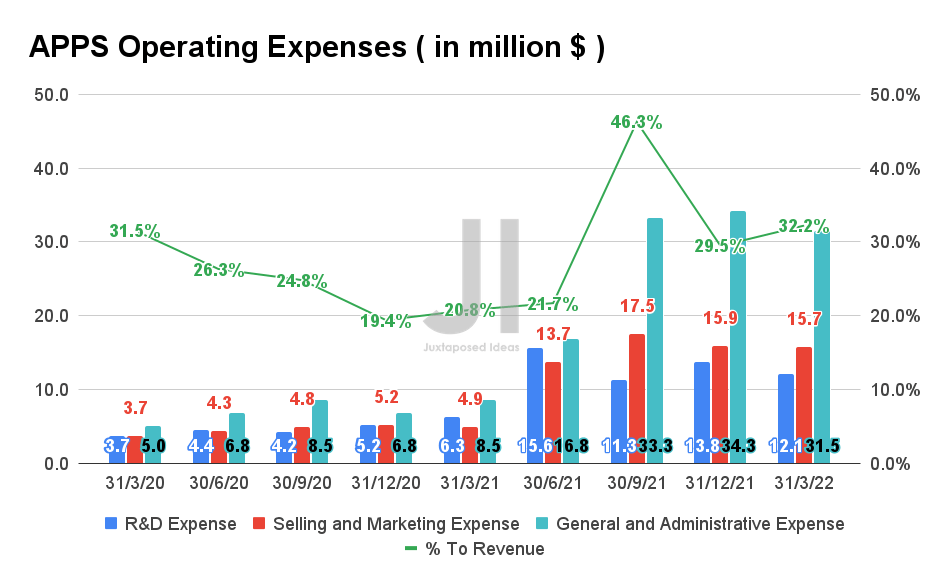
In FY2022, APPS spent a total of $231.33M in operational expenses, representing 30.9% of its revenue, 650.7% of its net income, and 376.3% of its FCF for the year. Since these numbers also represent YoY growth of 330.2%, it is evident that the company would need to raise more capital in the near future, given its lower profitability. Without strategic cost-cutting measures, APPS’ stock performance and valuations may also fall even more in the next few quarters, given its decelerating revenue growth.
APPS Long-Term Debt and Share Dilution
S&P Capital IQ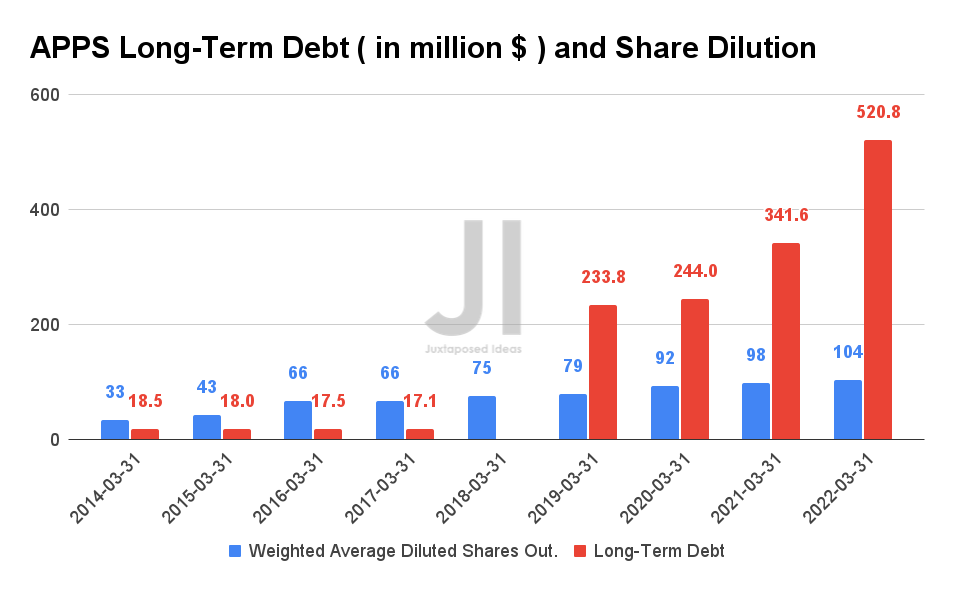
It is also evident that long-term APPS investors have been diluted by over 3 fold in the past eight years at total diluted shares outstanding of 104M as of FY2022. The company also increased its reliance on debt leveraging, with a total long-term debt of $520.8M in the latest fiscal year. APPS also reported massive stock-based compensation (SBC) with a total of $19.3M in SBC expenses in FY2022, representing 328% YoY growth. Given the recent fall in its stock price, we could potentially expect the company to spend up to $60M in SBC expenses in FY2023, which may further impact its profitability moving forward. We shall see.
APPS Projected Revenue and Net Income
S&P Capital IQ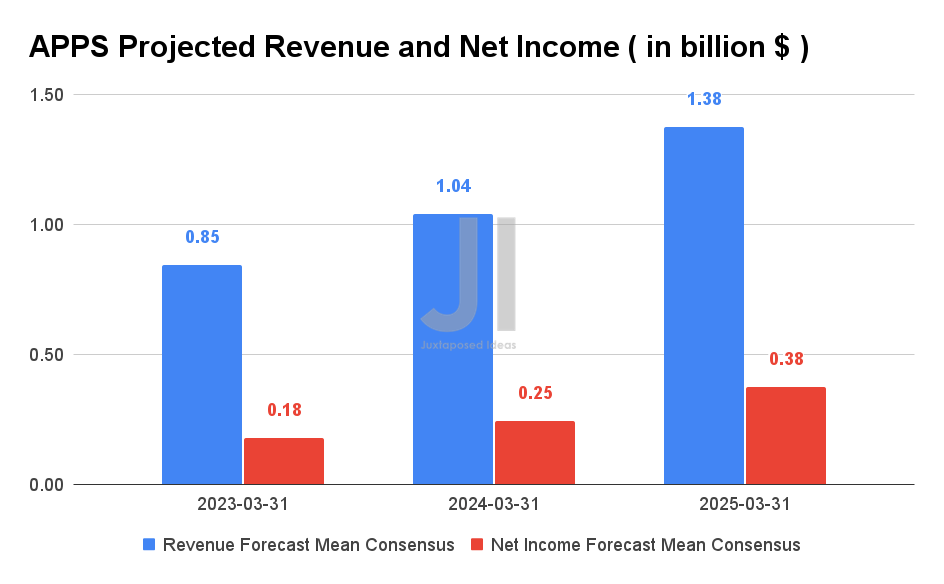
Over the next three years, APPS is expected to grow its revenue and net income at an impressive CAGR of 81.64% and 80.82%, respectively. Consensus estimates that the company will report revenues of $0.85B and net income of $0.18B in FY2023, representing excellent YoY growth of 13.6% and 506.3%, respectively. APPS profitability is also projected to improve over time, from a net income margin of 17.5% in FY2021 to 27.5% in FY2025.
Nonetheless, with the guidance of FQ1’23 revenues of up to $187M, we could be looking at 1.5% QoQ growth (on a pro forma basis), thereby highlighting the deceleration of its revenue growth post-reopening cadence. Therefore, the APPS stock would experience an uphill battle for its stock recovery, similarly experienced by many advertising tech companies, given the macro issues, the ongoing Ukraine war, and a potential recession. APPS CEO, Bill Stone, said:
I think that we’re seeing some ad spend softness, as many others have talked about in Europe. I think I kind of equate this time a little bit to when IDFA came out a year ago. (Seeking Alpha)
So, Is APPS Stock A Buy, Sell, or Hold?
APPS 5Y EV/Revenue and P/E Valuations
S&P Capital IQ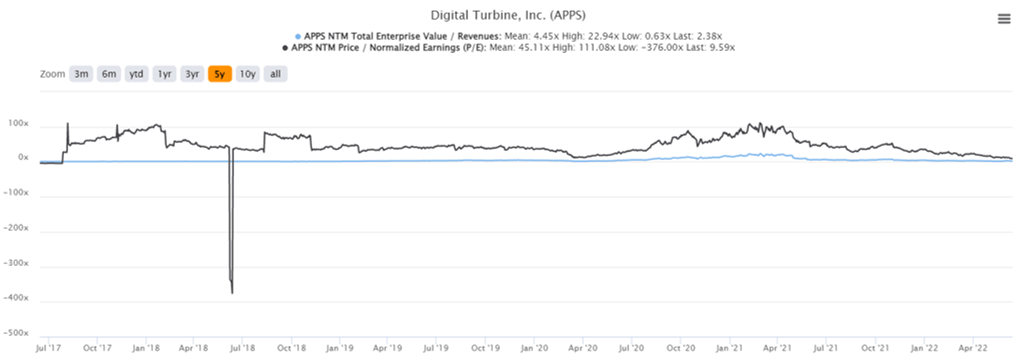
APPS is currently trading at an EV/NTM Revenue of 2.38x and NTM P/E of 9.59x, lower than its 5Y mean of 4.45x and 45.11x, respectively. The stock is also trading at $14.94, down 84.1% from its 52 weeks high of $93.98 while also hitting a new 52 weeks low.
APPS 5Y Stock Price
Seeking Alpha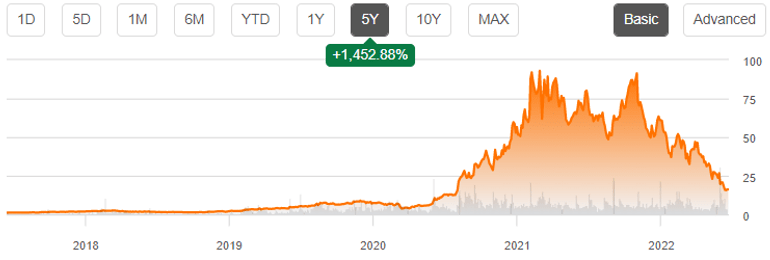
Despite the strong buy rating from consensus estimates with a price target of $55, we are less optimistic, given that it is evident that APPS’ revenue growth will be slowing down moving forward. The company may also continue to rely on long-term debt and SBC expenses to fund its higher operating costs after the end of its virtual work arrangement.
Therefore, we believe that the stock would potentially fall even further, before settling at a new low in the next few weeks. That would be a more attractive entry point for interested tech investors.
Therefore, we rate APPS stock as a Hold for now.
Be the first to comment