

JWJarrett/iStock via Getty Images
Midland, Texas based Diamondback Energy (NASDAQ:FANG) is an independent O&G producer operating in the Permian Basin. FANG was a mid-sized O&G company when it went public in 2012, but has grown into one of the largest Permian producers on the back of two acquisitions (Energen and QEP Resources) and with management’s wise allocation of capital. With the current relatively high price environment for oil and natural gas, investors can expect a stellar Q2 EPS report after the close on Monday (August 1). They can also expect a future increase in returns because management has committed to returning “at least” 50% of free-cash-flow to shareholders.
Diamondback Energy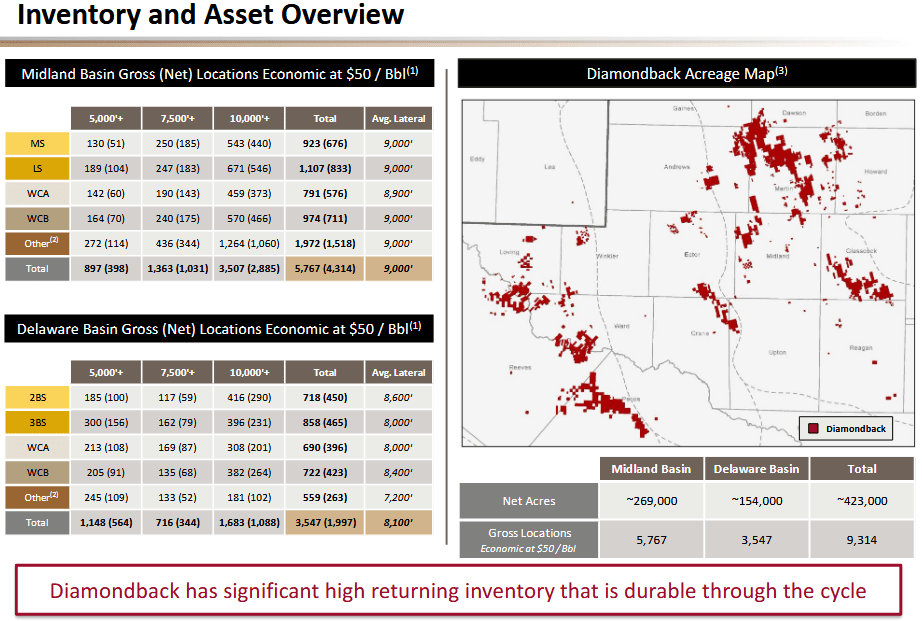
Source: May Investor Presentation
Investment Thesis
With the sale of its Bakken assets closing last October, Diamondback Energy is now a pure-play on the Permian Basin. As shown in the graphic above, FANG has a 423,000 acre leasehold in the Permian spread across the Midland & Delaware Basins with over 9,300 drilling locations at $50/bbl WTI.
FANG has an investment grade balance sheet and, as of the end of Q1, had reduced debt by $1.8 billion yoy. As a result, the company ended Q1 with net-debt of $5.8 billion and a net-debt to TTM adjusted EBITDA of only 1.2x. That being the case, and given the current high oil & gas price environment, management should be in a great position to exceed its commitment of returning “at least 50% of FCF to shareholders”:
Diamondback Energy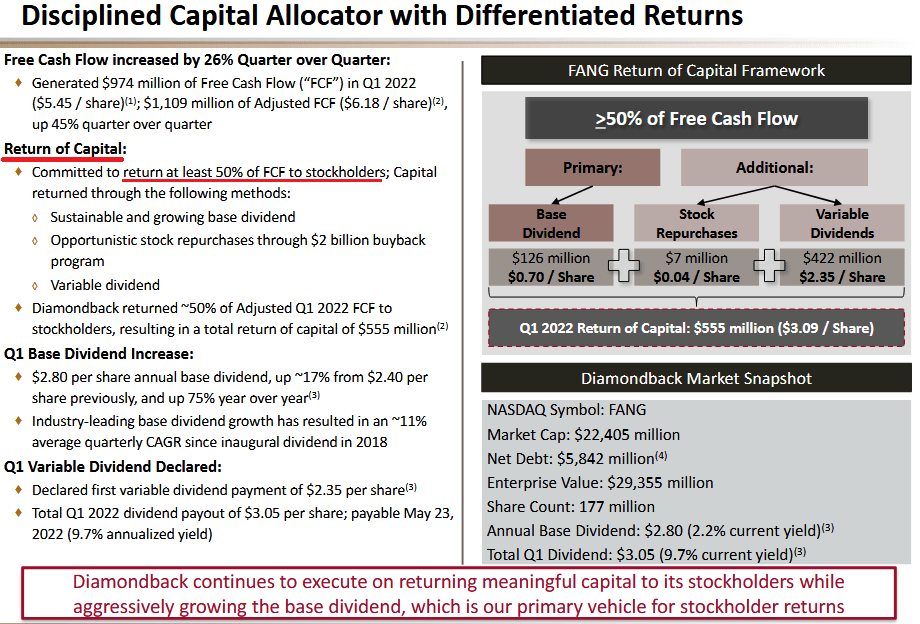
Earnings
Back in May, Diamondback delivered a very strong Q1 EPS report. Highlights included:
- Average production of 381,400 boe/d (222,800 bpd oil).
- Net income was $779 million ($4.36/share). Adjusted net income was $929 million ($5.20/share).
- Free-cash-flow of $974 million (an estimated $5.90/share based on 178,555,000 fully diluted shares outstanding).
- Repurchased 57,300 shares of common stock during Q1 for ~$6.7 million at a weighted average price of ~$117.34/share.
- Total return of capital to shareholders was $555 million (57% of Q1 FCF).
While the Q1 results and FCF generation were excellent, Q2 is setup to be even better due to continued strength in oil and gas prices. Indeed, consensus earnings estimates have been rising for FANG:
Yahoo Finance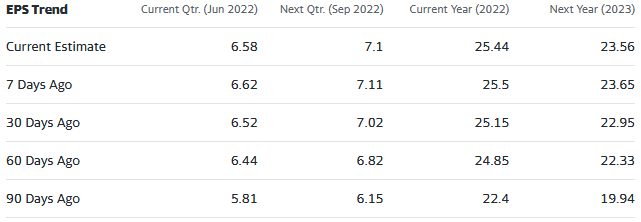
Q2 estimates are up $0.77/share over the past 3-months and analysts now expect the company to earn $6.58/share in Q2. That would be up 26.5% sequentially as compared to the $5.20/share in adjusted EPS in Q1.
Going forward, FANG’s guidance for FY22 is for a very disciplined approach. The company plans to keep production relatively flat yoy by increasing capital expenditures by ~23% to $1.8 billion. While that may not seem very exciting, the fact that FCF is expected to grow by ~50% yoy to $3.6 billion is.
Shareholder Returns
Note that FANG has adopted the base+variable dividend model and that although the quarterly base dividend shown on the side above ($0.70/share) was up 75% yoy, in June FANG announced an increase in the quarterly base dividend to $0.75/share. Somewhat surprisingly, the company also reported it will keep its base+variable dividend payout at $3.05/share for Q2. In effect, that equates to a $0.05/share cut in the variable dividend as compared to Q1. But before investors feel short-changed, note the dividend announcement also reported the company had (up to that date in Q2) bought 1,966,516 shares of its common stock for ~$253 million during the quarter at a weighted average price of ~$128.42 per share and said:
While the second quarter has not yet ended, the Company expects that the combination of these stock repurchases together with its expected base-plus-variable dividends for the quarter will constitute a return of capital to stockholders well in excess of 50% of Diamondback’s Free Cash Flow for the second quarter.
Annualized, the Q2 payout ($12.20/share) at the current stock price of $128, equates to an estimated yield of 9.5%.
Risks
Being an O&G producer (and commodity price taker), FANG is exposed to the typical risk of the commodity price cycle. Increased domestic and/or international oil production and/or reduced global demand for oil and gas due to a slowing global economy could negatively affect the company.
In May, and two weeks after the Q1 report, Diamondback announced it was rolling up its Rattler Midstream LP (RTLR) by acquiring the ~26% of the units the company didn’t already own in an all-stock transaction (0.113 shares of FANG for each unit of RTLR). This is likely due to the fact that RTLR was no longer trading at a premium valuation (i.e., less than ~6x EBITDA versus the more typical ~10x midstream valuation). While FANG’s Viper Energy Partners LP (VNOM) will continue to trade, the consolidation of RTLR will make for a simpler corporate structure at the expense of some modest dilution of the FANG shareholder base.
Note that management significantly increased share buybacks during Q2 with an average price just about where the stock closed on Friday. Energy companies have a long history of buying shares during commodity up-cycles (i.e., when the shares are expensive) and suspending buybacks during down-cycles during which time the shares typically represent much more value.
Summary & Conclusion
Given the current macro-environment since Putin’s horrific war-of-choice on Ukraine, and the resulting sanctions placed on Russia by the U.S. and its Democratic and NATO allies – the combination of which have effectively broken the global energy supply (and food …) supply chains – the prospects for continued strong oil & gas pricing is quite high in my opinion. That, combined with the fact that FANG’s forward P/E is only ~5x and it has a strong balance sheet, the stock looks attractive here. FANG could easily trade up to the $150 level before year-end. Combined with the dividend, that’s an opportunity for investors to notch a 20%+ total return over just the next 6-months.
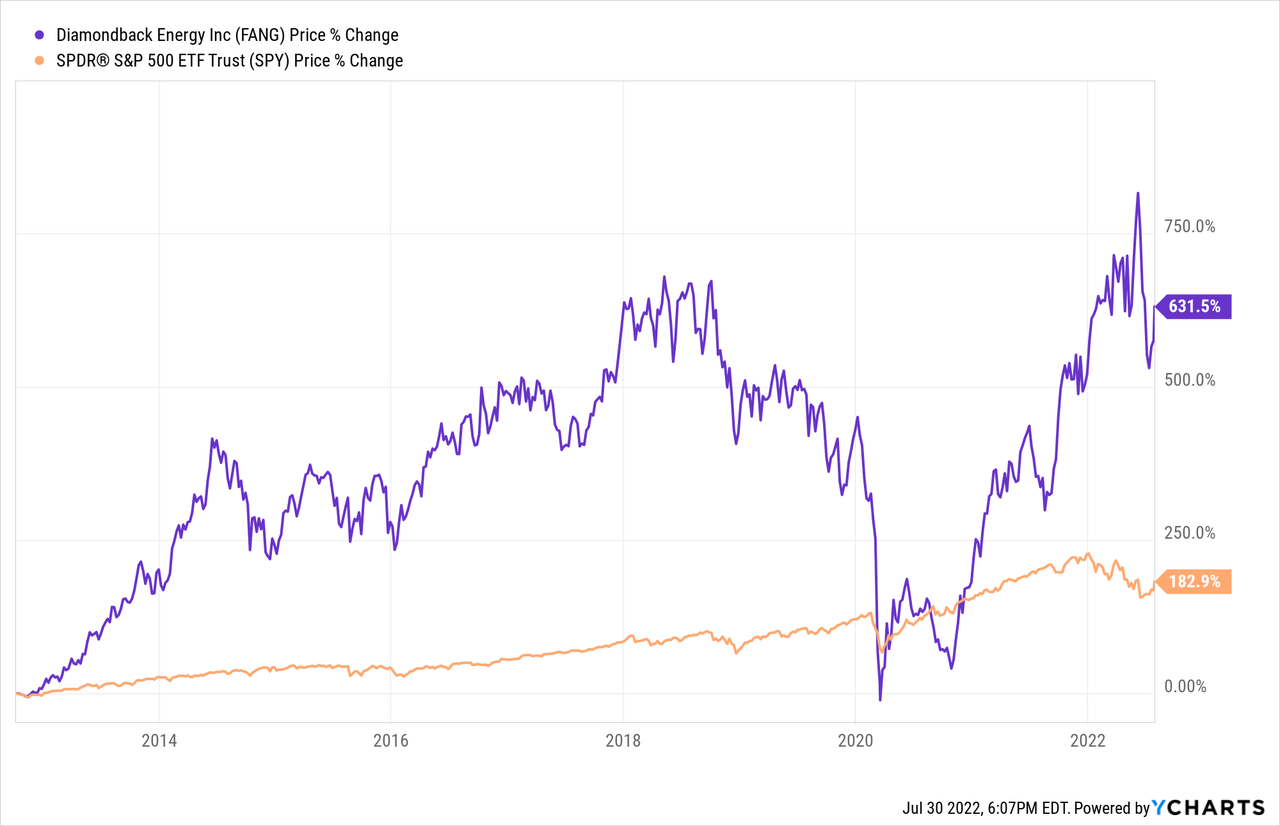
I’ll end with a 10-year price chart of FANG and note that it has significantly outperformed the S&P 500 as represented by the (SPY) ETF:
Be the first to comment