

jacoblund/iStock via Getty Images
Just over eight months ago, I wrote on Destination XL Group (NASDAQ:NASDAQ:DXLG), noting that while it was reasonably valued at $5.60, the stock was not without risk, especially with a riskier market backdrop. This was because the stock was up 1500% from its lows and running into resistance when the S&P 500 (SPY) was trading in nosebleed territory from a valuation standpoint. Often, in periods of market weakness, the first names to get sold are the best performers, given that they offer an area to raise cash without realizing losses.
DXLG Chart (TC2000.com)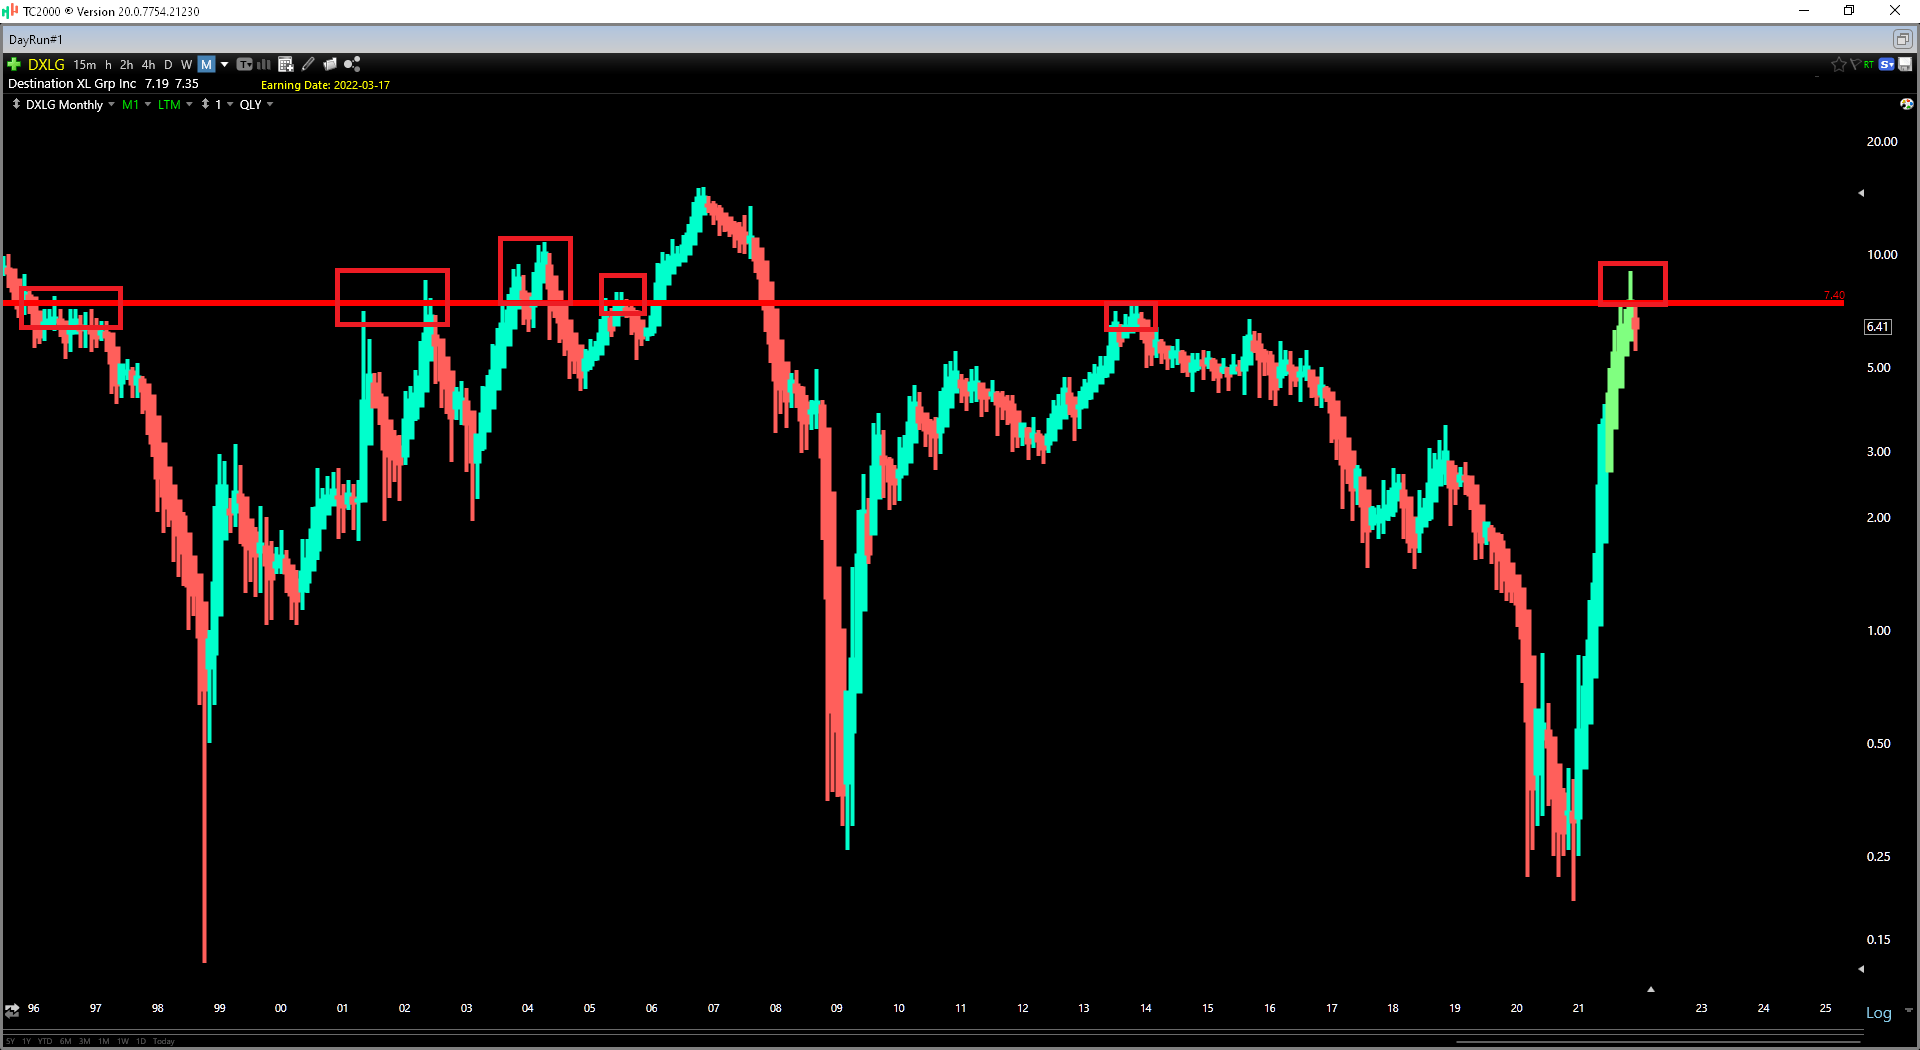
While I didn’t expect a 25% correction in less than three months, taking profits on DXLG was the right move, with the stock sliding more than 40% over the following six months to a low near $3.30. Since then, the stock has put together an incredible rally following a stronger-than-expected Q2 report. With DXLG trading at less than 8x earnings with its turnaround making solid progress, paying up for the stock here might be tempting. However, with DXLG nearly 100% above its 200-week moving average and short-term extended, I don’t see any way to justify chasing the stock above $6.35.
Sales Performance
Destination XL Group (“Destination XL”) released its Q2 results last month, reporting revenue of $144.6 million, a 4% increase from the year-ago period. This was driven by comp sales of 6.1% vs. Q2 2021 levels, with a 3.6% increase in retail sales and a 12.7% increase in direct sales. While these figures may not seem that impressive, this was during a period where several retailers struggled immensely due to the pullback in demand, especially as rising gas prices further dented disposable income. Given this solid sales performance, management raised guidance by $10 million at the mid-point to $530 million, translating to sales growth in a recessionary environment despite lapping difficult re-opening comps last year.
Destination XL Group – Quarterly Revenue (Company Filings, Author’s Chart)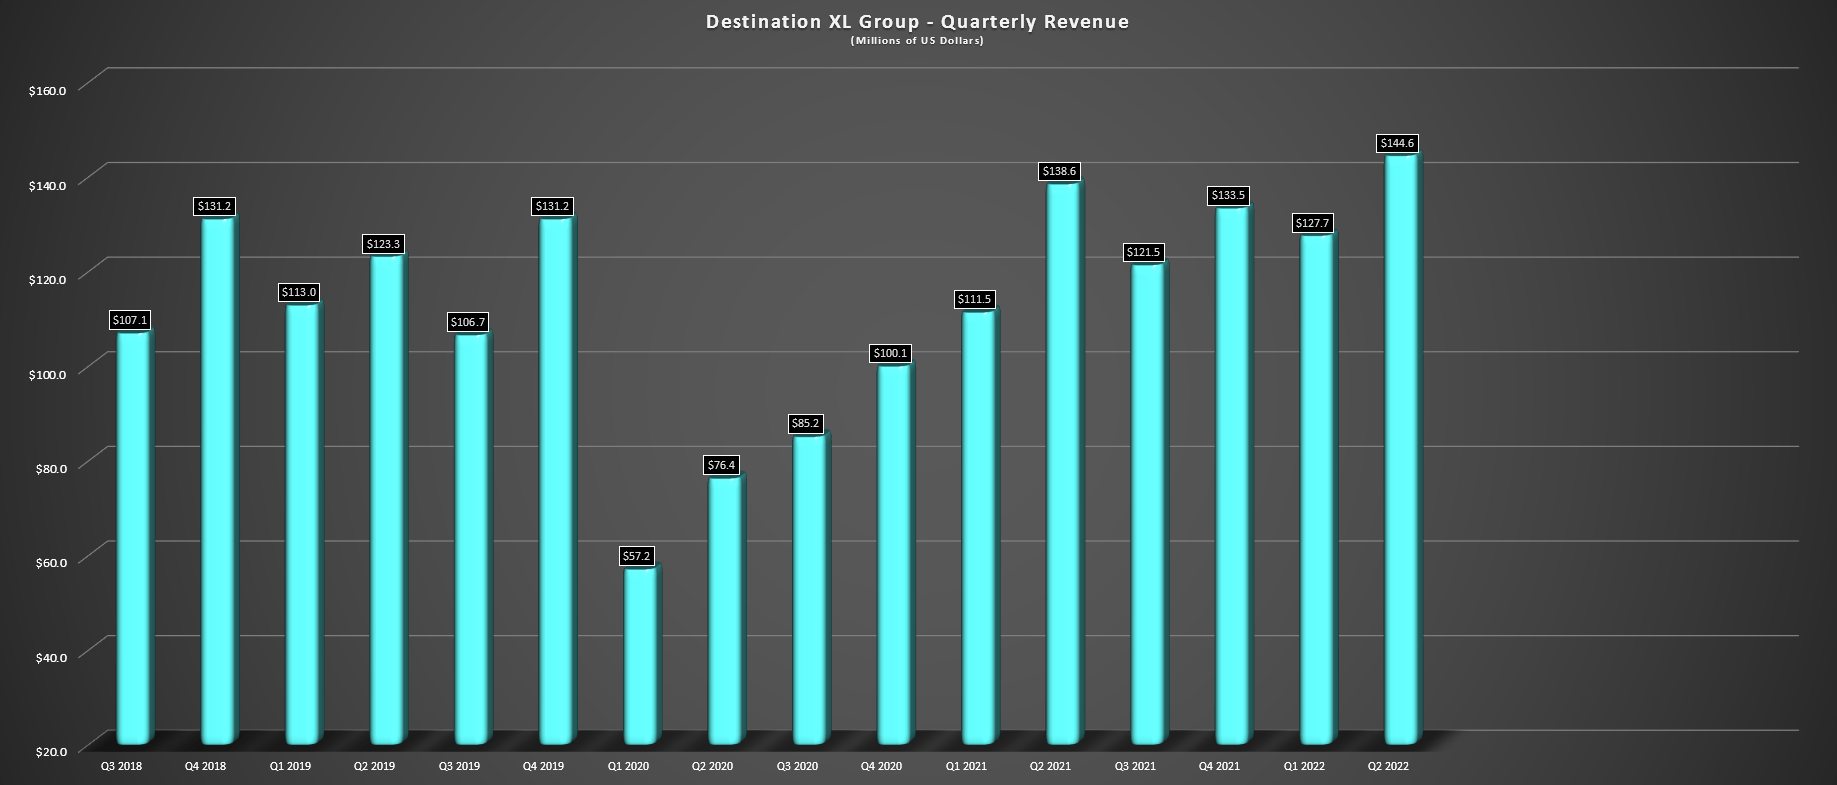
According to management, the robust sales performance was helped by higher average order values, with a deeper penetration in higher ticket items and fewer markdowns. While the former could be an unusual boost with a return to weddings and formal events after an unusual two years due to lockdowns and social distancing, Destination XL’s brand repositioning has contributed to less promotional pricing and clearance inventory sitting at multi-year lows. This was evidenced by the clearance inventory being 400 basis points lower than 2019 levels at just 6.9%. Notably, its level of clearance discounting has also increased from a maximum of 40% vs. up to 75%, a meaningful improvement.
Finally, given the strong digital sales performance (~30% of sales were digital vs. 28% in Q2 2021), management reiterated its belief that it has the potential to see 35-40% digital sales long-term, which would be a very positive development. The company also noted that it’s rolling out a revamped loyalty program in Q3, potentially providing better customer insights and visits to help the company better weather the difficult macro backdrop of declining personal savings rates. Let’s look at margins and earnings:
Margins & Earnings Trend
Moving over to margin performance, Destination XL reported flat margins despite the impact of higher freight and materials costs, with margins coming in at 52.1%. On a full-year basis, the company now expects margins to be flat or better than last year, setting the company up for annual EPS growth when combined with higher sales and share buybacks. Notably, the company did a great job with its share buybacks year-to-date, repurchasing 2.9 million shares at ~$4.38/share, well below current levels. It currently has authorization for another $2.3 million in share buybacks as of quarter-end, representing just ~0.50% of its float.
Destination XL Group – Gross Margins (Company Filings, Author’s Chart)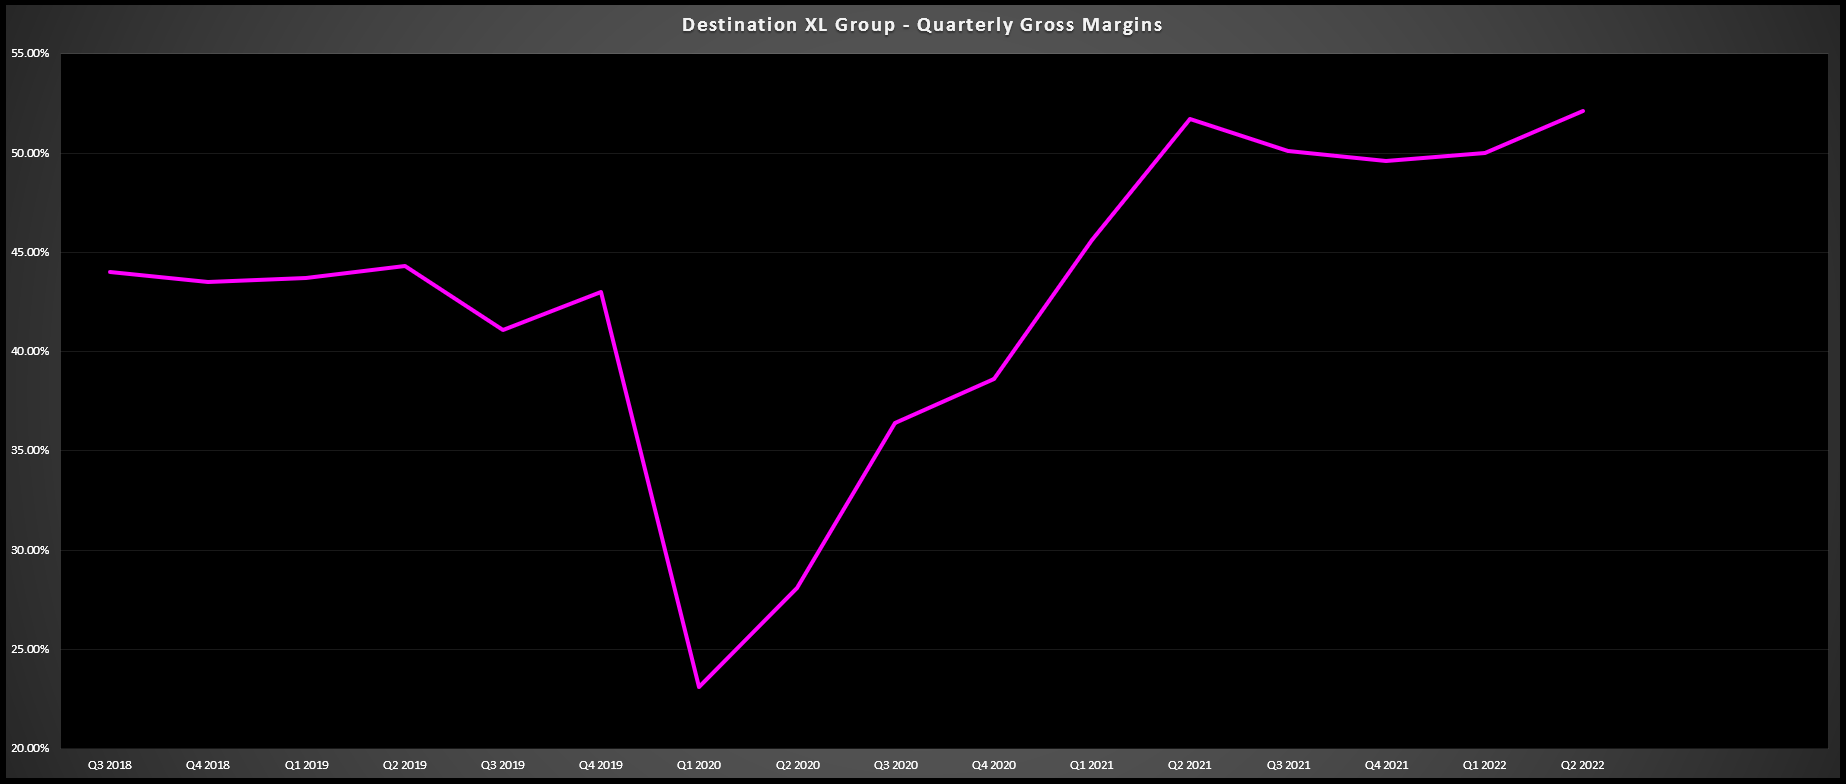
Given the solid margin performance due to better-than-expected sales in H1, Destination XL is on track to grow annual EPS year-over-year despite a blockbuster year in FY2021. Even using the lower end of earnings estimates, annual EPS should increase year-over-year to $0.85, with the potential for further earnings growth in FY2023, assuming we see some moderation in freight costs. A single-digit annual EPS growth rate may not seem like a big deal, but when we compare this to retailers like American Eagle (AEO) and Abercrombie (ANF), which were also up against tough comps and have seen earnings fall off a cliff, this performance is very commendable.
DXLG Earnings Trend (YCharts.com, Author’s Chart)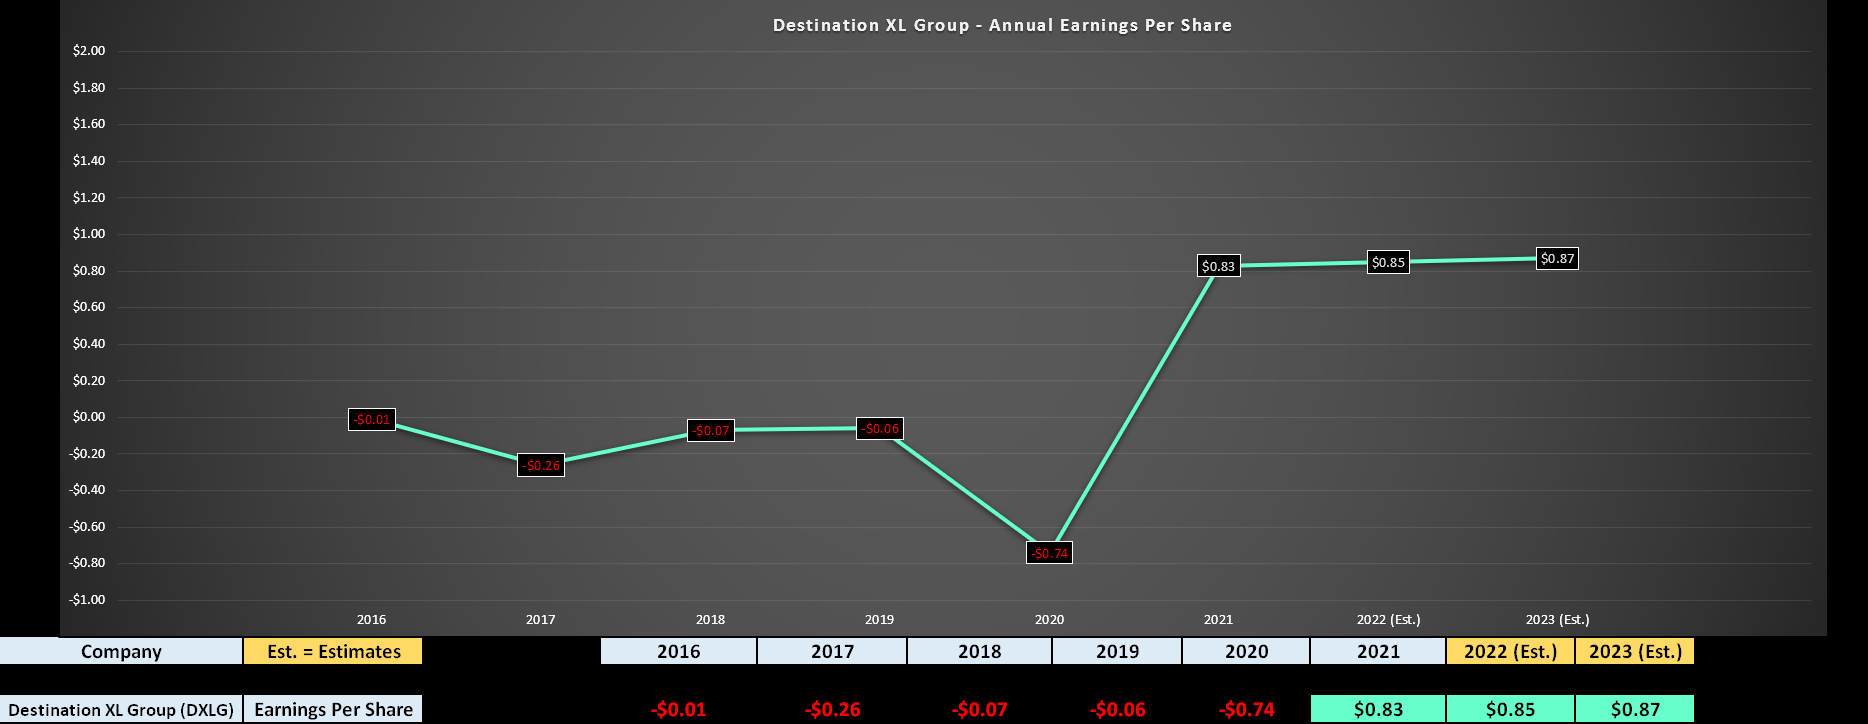
One potential reason for the outperformance is that Destination XL is in a league of its own, being one of the only companies serving its category in its capacity. Combined with its digital transformation and brand repositioning that is driving higher order values, this allows it to grow sales with higher orders, offsetting the difficult comps from a traffic standpoint. So, while there’s no such thing as recession-resistant in a discretionary segment of Retail like clothing, Destination XL could be more immune than its peers, given that it’s not fighting for peers with a shrinking pool of discretionary dollars from consumers given its unique market position.
Valuation
Based on ~62 million shares and a share price of US$6.35, Destination XL Group trades at a market cap of ~$394 million, an estimated free cash flow yield of ~10%, and approximately 7.5x FY2022 earnings estimates. This is a very reasonable valuation for a company in a successful turnaround and is certainly the case if the company can deliver on its goal of double-digit unit growth over the next few years and 35%+ digital sales. That said, small-cap stocks typically trade at a much lower valuation than their mid-cap and large-cap peers due to more inferior liquidity, meaning that larger funds cannot own these stocks in most cases.
Given what I believe to be a fair earnings multiple of 9.0, I see a fair value for DXLG of $7.65. While this points to more than a 20% upside to fair value, assuming the company meets or beats earnings estimates, there are several other value names in the Retail/Apparel space thanks to the recent market turbulence. Some examples include Crocs (CROX) at just 7x FY2022 earnings estimates and Capri Holdings (CPRI) at less than 7x FY2022 earnings estimates.
CROX Historical Earnings Multiple (FASTGraphs.com)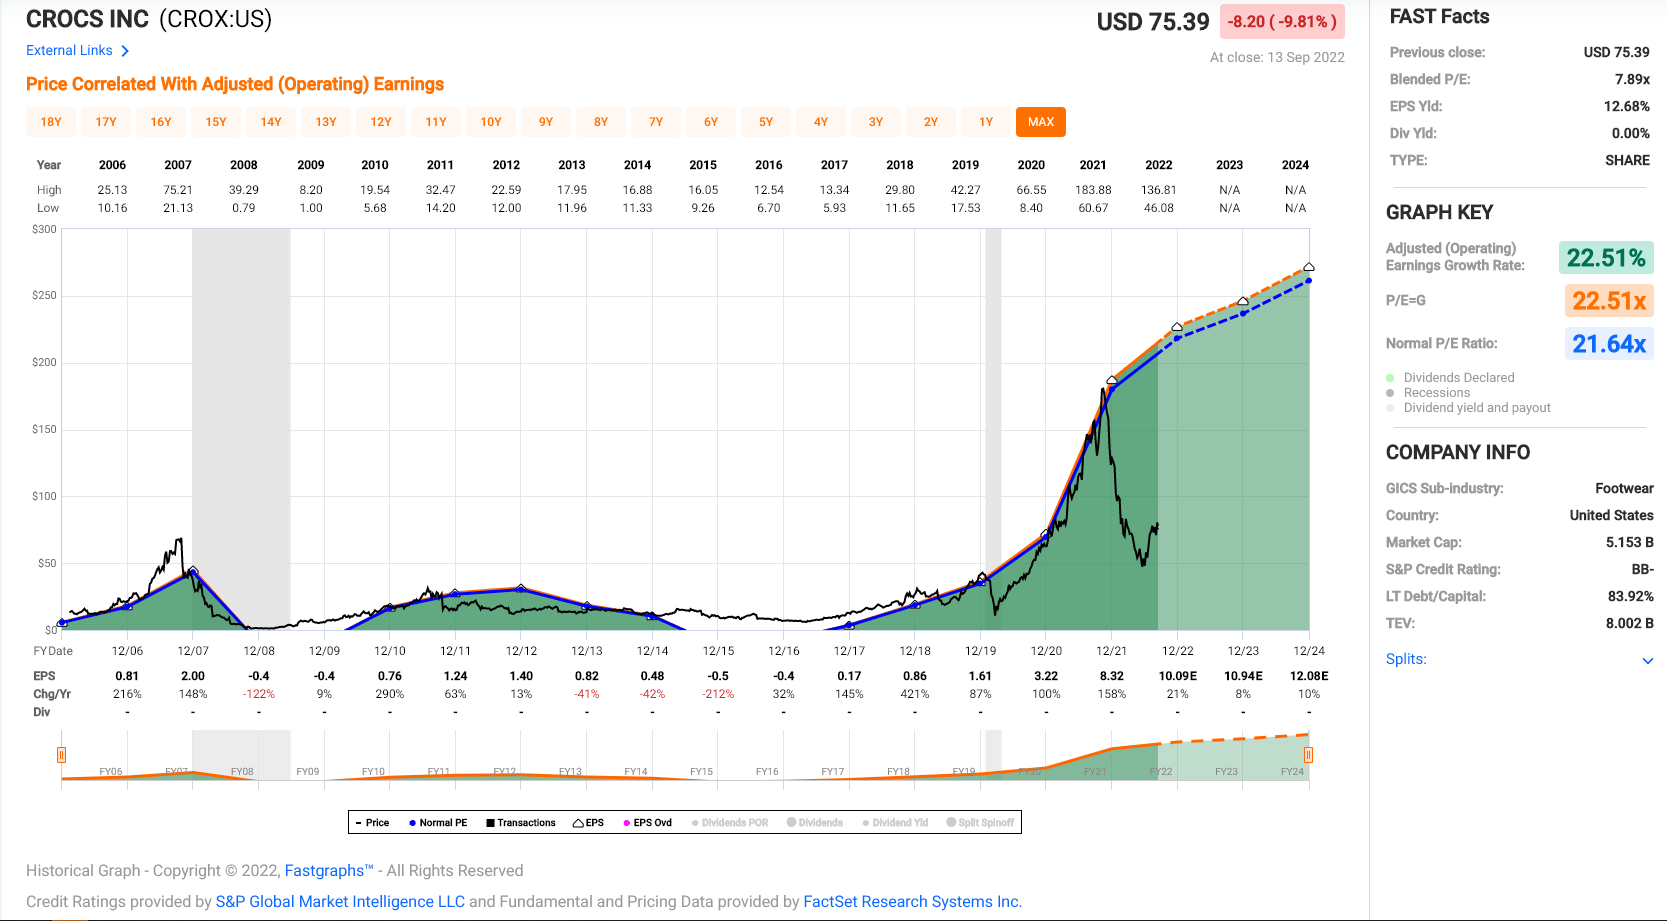
In summary, although DXLG is cheap, I see these names as a little more attractive, given that they have historically traded at double-digit earnings multiples but have fallen out of favor. Having said that, Destination XL is unique in that it benefits from a lack of competition, potentially making it more recession-resistant given that it isn’t fighting with peers over slowing traffic in its category. Let’s look at the technical picture:
Technical Picture
While the valuation points to further upside, DXLG is on a tear from a technical standpoint, up 90% in less than three months and 10% year-to-date. This extreme relative strength is a positive development and suggests the stock might be under accumulation, but it’s left the stock in the upper portion of its expected trading range, with a reward/risk ratio of 0.35 to 1.0. The reward/risk ratio is based on having just $1.00 in potential upside to strong resistance at $7.35 (previously broken support) and $2.90 in potential downside to strong support at $3.45.
DXLG – 1-Year Chart (TC2000.com)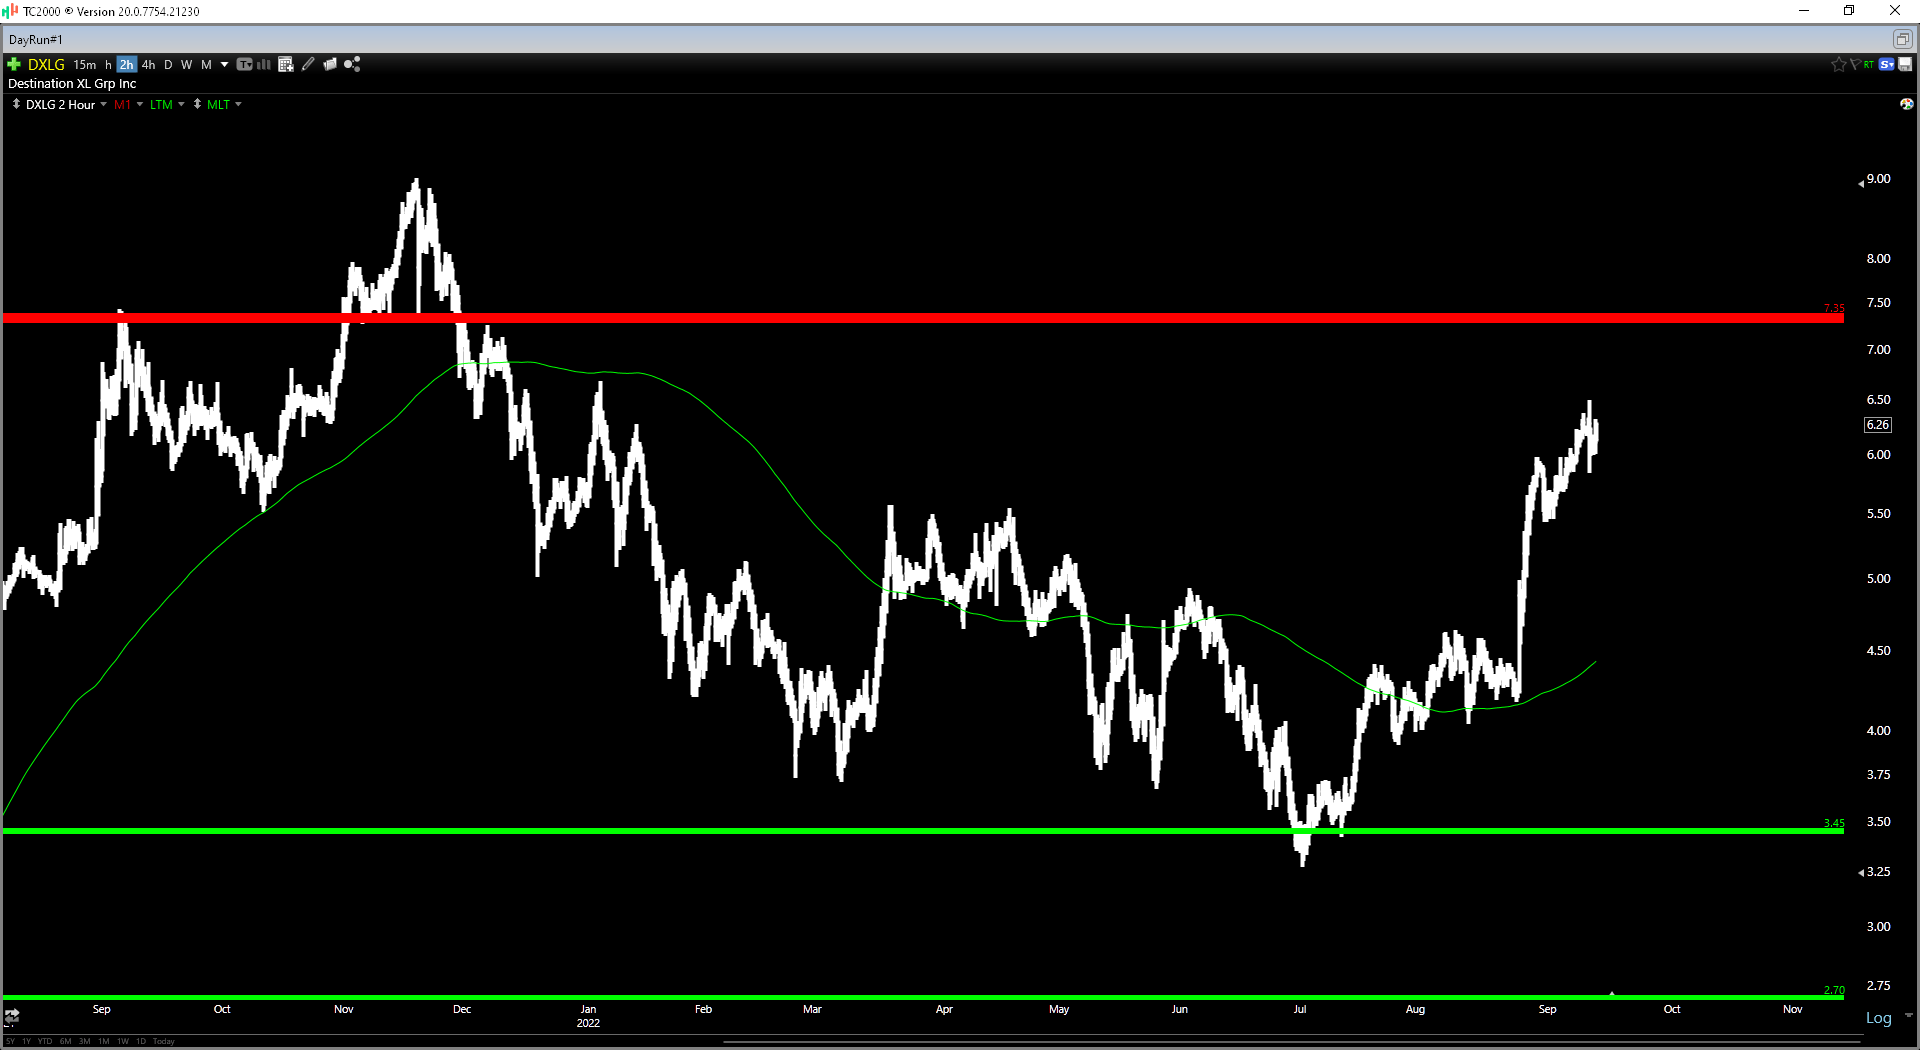
Meanwhile, if we look at the weekly chart and zoom out, we can see that when DXLG has reversed back into an uptrend, the stock has moved in a very volatile fashion, with the best strategy being to buy the stock on sharp pullbacks vs. chase rallies. This is evidenced by the stock during 2001-2005 when it staged multiple violent rallies but always came back down to test its 200-week moving average (green line). As the second chart shows below, DXLG is currently more than 40% above this moving average, making this a risky entry if we do see history play out similarly. So, while DXLG might be cheap, it is extended short term at $6.35 per share.
DXLG Weekly Chart (1999-2007) (TC2000.com)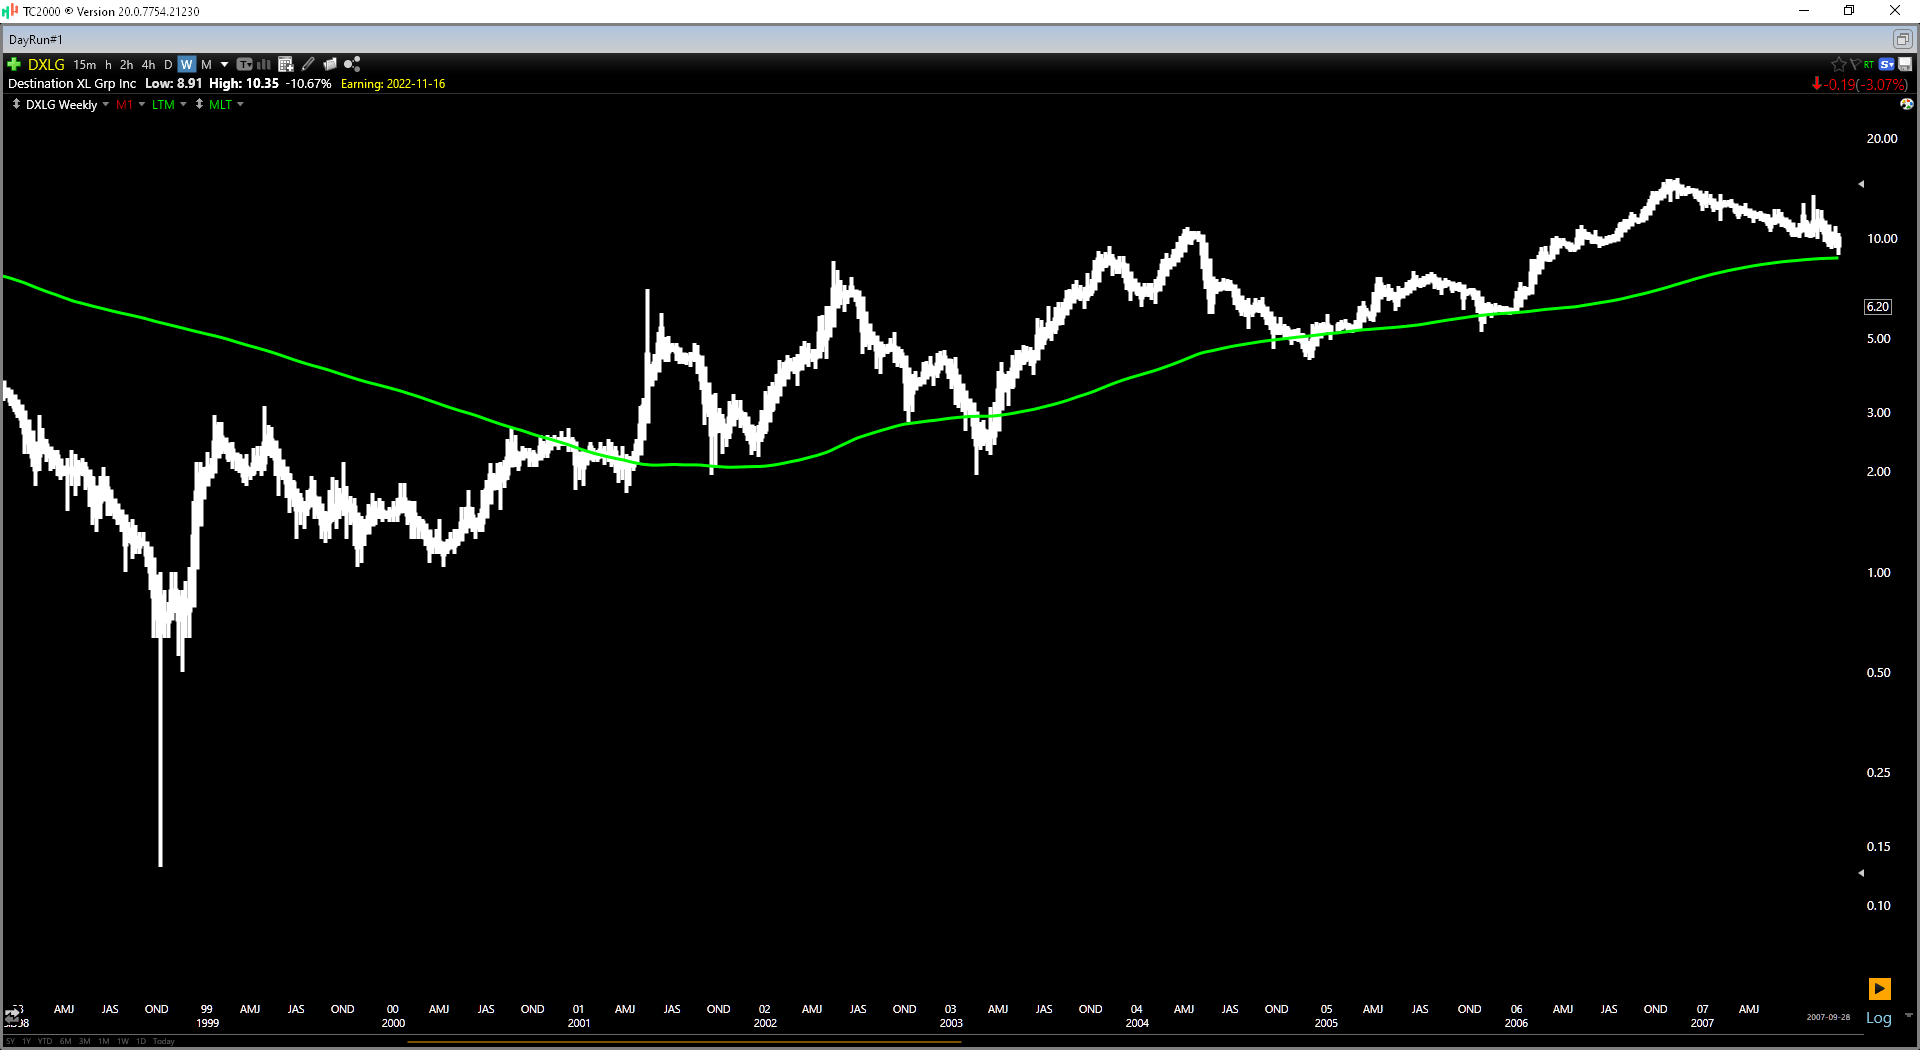
DXLG Weekly Chart (TC2000.com)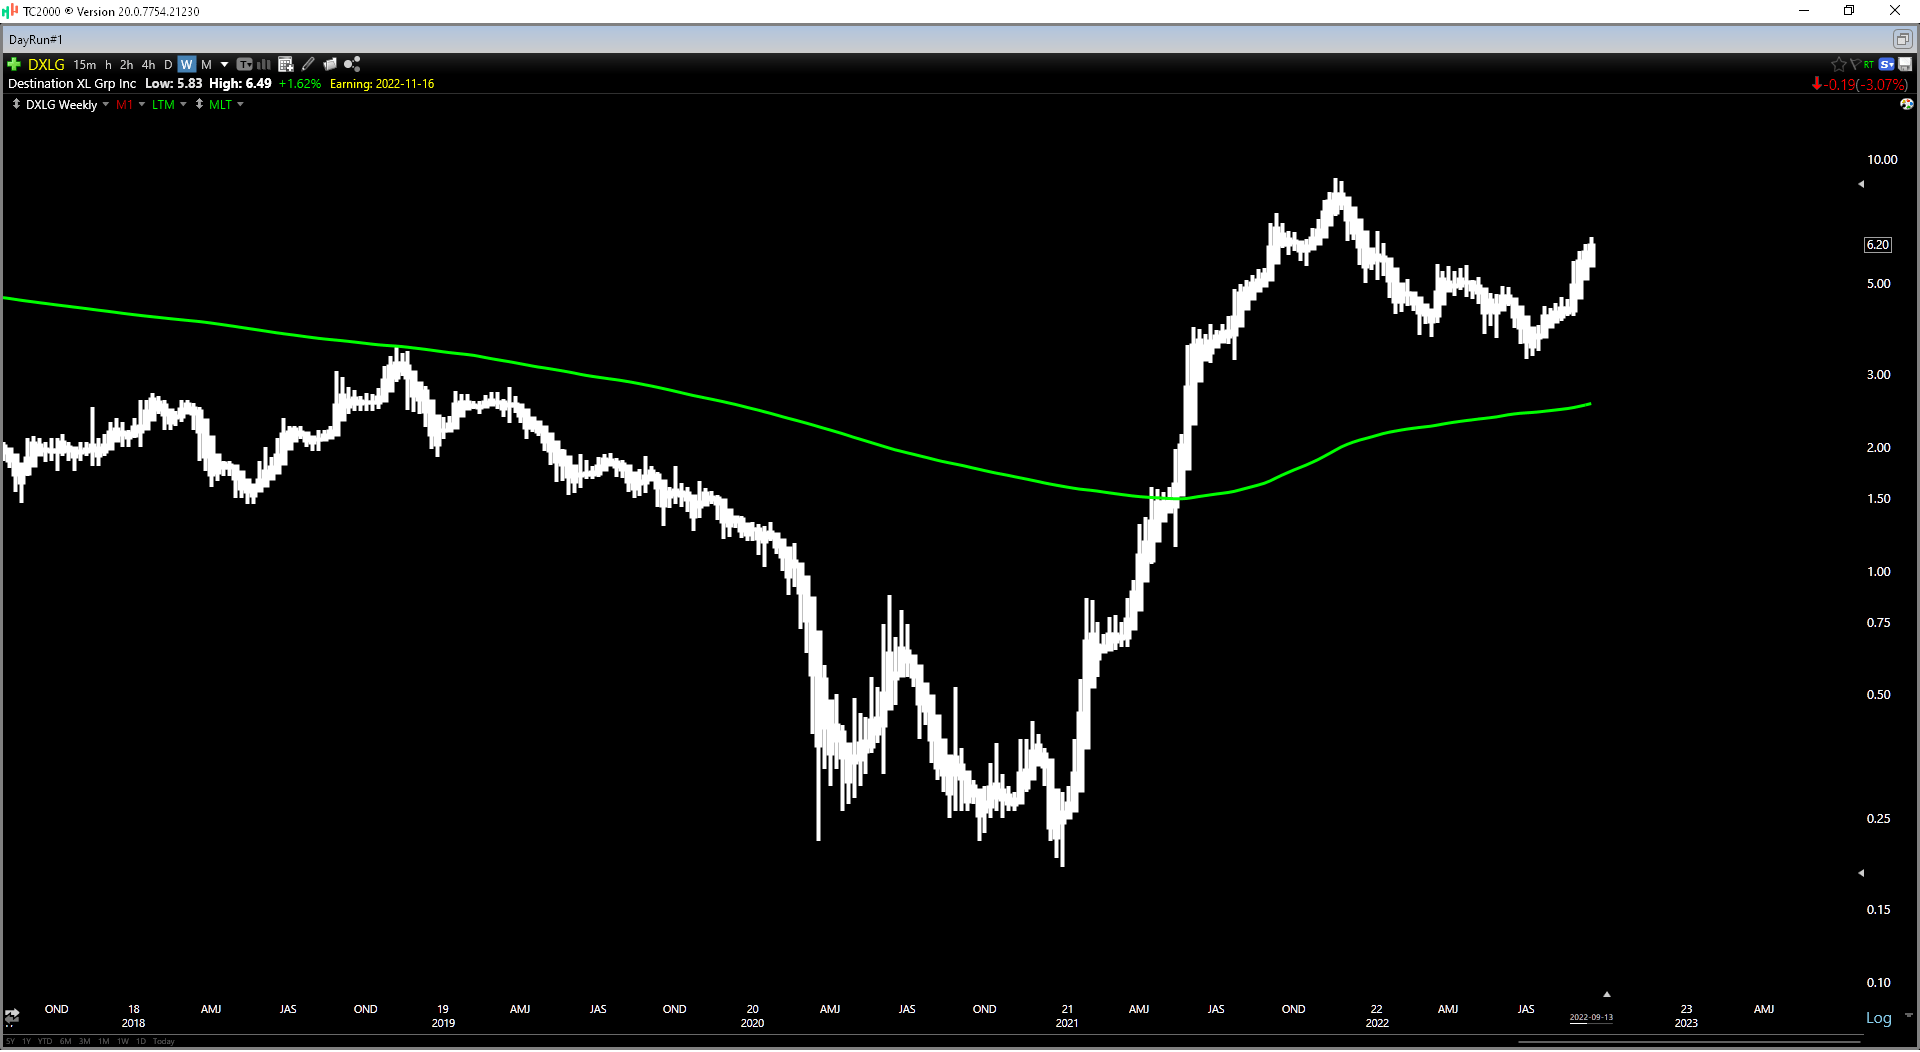
Summary
Destination XL had another solid quarter, and the stock has launched higher with the potential for further share buybacks, a sales guidance raise, and the company’s optimism about its future. That said, it rarely pays to chase stocks when they’re extended, and this is especially true in a turbulent market environment. So, while I think a case can be made for buying sharp pullbacks in DXLG, I don’t see any way to justify chasing the stock above $6.35. For investors looking for value in the Retail Sector (XRT), my preference would be Crocs, but I would prefer the stock on a pullback below $65.00.
Be the first to comment