

syahrir maulana
DEEP strategy and portfolio
The Roundhill Acquirers Deep Value ETF (NYSEARCA:DEEP) was launched in September 2014 and has been tracking the Acquirers Deep Value Index since 2020. It holds 99 stocks, has a distribution Yield of 1.49%, and a total expense ratio of 0.80%. It is a competitor of the SPDR S&P 600 Small Cap Value ETF (SLYV) and the iShares S&P Small Cap 600 Value ETF (IJS). SLYV and IJS are older: they were launched in 2000. They are also more liquid and have higher assets under management.
As described in the prospectus by Roundhill Investments, the underlying index “tracks the performance of a portfolio of 100 of the most undervalued, fundamentally strong stocks drawn from the smallest 75% of stocks listed in the United States by market capitalization meeting certain liquidity thresholds”.
Stocks are selected in four steps. First, they are ranked based on assets, earnings, and cash flows. Then, they are filtered with statistical measures of fraud, earnings manipulation, and financial distress. The set of eligible stocks at this stage is reduced to companies showing a wide discount to valuation, a strong balance sheet, and a robust business generating free cash flow. In the last step, a forensic accounting due diligence review is performed “in accordance with the Index methodology”. Constituents are equal-weighted at each quarterly reconstitution.
DEEP is much cheaper than the small-cap value benchmark IJS regarding aggregate P/E ratios, and to a lesser extent price/cash flow ratios. However, price to book and price to sales are similar for both funds, as reported in the next table.
|
DEEP |
IJS |
|
|
Price/Earnings TTM |
6.08 |
11.23 |
|
Price/Book |
1.52 |
1.32 |
|
Price/Sales |
0.63 |
0.67 |
|
Price/Cash Flow |
6.5 |
8.48 |
Source: Fidelity
DEEP currently holds 99 stocks. Constituents were in equal weight at the latest reconstitution. As of writing, weights have drifted between 0.69% and 1.37%. The risk related to any individual stock is very low. The top 10 holdings, listed in the next table with valuation ratios, represent 12.8% of asset value.
|
Ticker |
Name |
Weight |
P/E ttm |
P/E fwd |
P/Sales |
P/Book |
P/FCF |
Yield |
|
Cowen Inc |
1.37% |
6.50 |
8.77 |
0.65 |
1.09 |
N/A |
1.35 |
|
|
Infrastructure and Energy Alternatives Inc |
1.37% |
N/A |
16.72 |
0.31 |
94.31 |
N/A |
0 |
|
|
SIGA Technologies Inc |
1.37% |
18.82 |
26.15 |
9.15 |
7.60 |
17.48 |
0 |
|
|
Resolute Forest Products Inc |
1.31% |
3.78 |
3.60 |
0.42 |
0.91 |
2.98 |
0 |
|
|
Sleep Number Corp |
1.24% |
10.82 |
14.17 |
0.48 |
N/A |
7.68 |
0 |
|
|
The Shyft Group, Inc. |
1.20% |
21.51 |
23.32 |
0.91 |
3.85 |
111.18 |
0.79 |
|
|
Perdoceo Education Corp |
1.19% |
8.83 |
N/A |
1.39 |
1.42 |
6.24 |
0 |
|
|
Winnebago Industries, Inc. |
1.19% |
5.19 |
4.43 |
0.41 |
1.56 |
8.67 |
1.20 |
|
|
Mueller Industries Inc. |
1.18% |
5.76 |
6.61 |
0.93 |
2.51 |
8.85 |
1.49 |
|
|
BlueLinx Holdings Inc. |
1.16% |
2.24 |
2.81 |
0.18 |
1.71 |
5.38 |
0 |
Ratios: Portfolio123
The heaviest sectors are consumer discretionary (31.7%), industrials (19%), and financials (16.3%). Other sectors are below 9%. Compared to the S&P 600 value ETF (IJS), DEEP massively overweights consumer discretionary. It underweights real estate, energy, financials, healthcare, communication, and ignores utilities.
DEEP sectors (chart: author; data: Fidelity)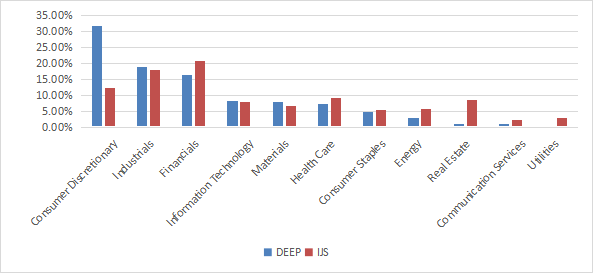
Since inception (09/22/2014), DEEP has lagged the S&P 600 Value Index and even more the wider small-cap benchmark S&P 600.
|
since Sept 2014 |
Total Return |
Annual.Return |
Drawdown |
Sharpe ratio |
Volatility |
|
DEEP |
70.38% |
7.03% |
-49.22% |
0.38 |
21.82% |
|
S&P 600 Value Index (IJS) |
102.71% |
9.43% |
-47.45% |
0.48 |
21.83% |
|
S&P 600 Index (IJR) |
117.33% |
10.41% |
-44.48% |
0.54 |
20.44% |
Data calculated with Portfolio123
However, DEEP and IJS are almost tie in the last 12 months (see next chart).
DEEP vs. IJS, trailing 12 months (Portfolio123)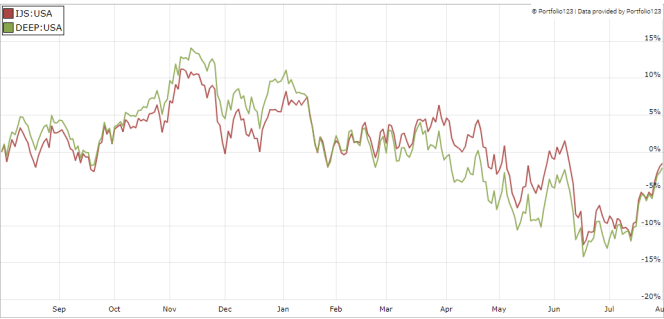
Comparison with my Dashboard List model
The Dashboard List is a list of 80 stocks in the S&P 1500 index, updated every month based on a simple quantitative methodology. All stocks in the Dashboard List are cheaper than their respective industry median in Price/Earnings, Price/Sales, and Price/Free Cash Flow. After this filter, the 10 companies with the highest Return on Equity in every sector are kept in the list. Some sectors are grouped together: energy with materials, communication with technology. Real estate is excluded because these valuation metrics don’t work well in this sector. I have been updating the Dashboard List every month on Seeking Alpha since December 2015, first in free-access articles, then in Quantitative Risk & Value.
The next table compares DEEP since inception with the Dashboard List model, with a tweak: the list is reconstituted quarterly instead of once a month to make it comparable to DEEP underlying index.
|
since Sept 2014 |
Total Return |
Annual.Return |
Drawdown |
Sharpe ratio |
Volatility |
|
DEEP |
70.38% |
7.03% |
-49.22% |
0.38 |
21.82% |
|
Dashboard List (quarterly) |
130.82% |
11.26% |
-40.07% |
0.64 |
18.37% |
Past performance is not a guarantee of future returns. Data Source: Portfolio123
The Dashboard List outperforms DEEP by 4.2 percentage points in annualized return and has better risk metrics (drawdown and volatility). However, DEEP price history is real and the model performance is hypothetical.
I like the idea of mixing various ratios to rank value stocks like DEEP index does. However, the underlying index is complicated and not very transparent about how metrics are used. Simple methodologies often perform better and are more consistent in time.
The next table shows the return and risk metrics of the cheapest quarter of the S&P 500 (i.e. 125 stocks) measured in price/book, price/earnings, price/sales, and price/free cash flow. The sets are reconstituted annually between 1/1/1999 and 1/1/2022 with elements in equal weight.
|
Annual.Return |
Drawdown |
Sharpe ratio |
Volatility |
|
|
Cheapest quarter in P/B |
9.95% |
-72.36% |
0.48 |
21.05% |
|
Cheapest quarter in P/E |
11.25% |
-65.09% |
0.57 |
18.91% |
|
Cheapest quarter in P/S |
12.62% |
-65.66% |
0.6 |
20.46% |
|
Cheapest quarter in P/FCF |
12.23% |
-63.55% |
0.61 |
19.05% |
Data calculated with Portfolio123
This table explains why I use P/E, P/S, and P/FCF in my Dashboard List model (more info at the end of this post).
Takeaway
DEEP follows a complicated quantitative methodology to select 100 small-cap stocks with a wide discount to valuation. It is overweight in consumer discretionary. DEEP past performance since 2014 is underwhelming. It doesn’t meet expectations of bringing added value to a small-cap value benchmark or a wider small-cap benchmark. Weak liquidity and AUM don’t make it attractive either. However, past performance may not be representative of future returns. Personally, I prefer simpler methodologies. I also think an efficient value model should compare stocks in comparable sets (sector, industry), like my Dashboard List since 2015. This model uses only three valuation metrics. Moreover, a simple ROE rule helps filter out some value traps and normalize the number of components.
Be the first to comment