

cemagraphics
iM DBi Managed Futures Strategy ETF (NYSEARCA:DBMF) is a risk-diversifying asset with a low correlation to stocks or bonds or real estate which I have in my portfolio and in client portfolios.
iMGP DBi Managed Futures Strategy ETF | iMGP Funds
It is a weekly reconstituted ETF using fully rules-based, long/short positions in a small set of deeply liquid commodity futures to track the gross performance of a major commodities trading index based on the daily reported returns of 20 of the largest commodities trading hedge funds, but with full daily liquidity and low expenses.
Role In The Portfolio
- Add a low correlation diversifier to stock exposure
- Provide a long/short hedging feature to potentially experience less severe drawdowns during stock Bear markets
- To be a partial substitute for the fixed income allocation to potentially avoid price declines during periods of rising interest rates
- To potentially benefit from long/short trading in foreign exchange rates
- Track better than average CTA hedge fund returns with this fund to eliminate need to invest in several CTA funds to reduce manager selection risk
- Typical retail investor may invest in only 1 or 2 which carries high manager selection risk
- Typical large pension may invest in possibly 10 funds to minimize manager selection risk.
Taxation
This fund does not issue a K-1 as a commodity trading partnership would do. As an ETF, it reports via 1099.
Futures are taxed differently than stocks and bonds, but with the 1099 tax reporting of ETFs, income is characterized into the same categories as 1099 reports from other funds.
Futures gains are all classified as 60% long-term and 40% short-term regardless of the time held. Any futures position held as of Dec 31 is taxed as if sold (I presume that reduces cost basis, but not sure).
For 2021, the 1099 for DBMF was in round numbers 33% long-term gains, 11% short-term gains, and 56% ordinary income.
Performance
This data uses the SocGen CTA Hedge Fund Index (“CTA index”, defined below) which DBMF tracks in a zero-fee (or gross return) emulation to enable a hypothetical long-term comparison with US large-cap stocks and US aggregate bonds.
Large-cap stocks are in blue. Aggregate bonds are in red. The CTA index is in yellow.
Importantly, because futures can just as easily be held short as well as long, commodity trading can avoid the interest rate sensitivity of bonds, and even benefit from rising rates when bonds are hurt. You can see that in the 2022 part of the chart below.
Portfolio Visualizer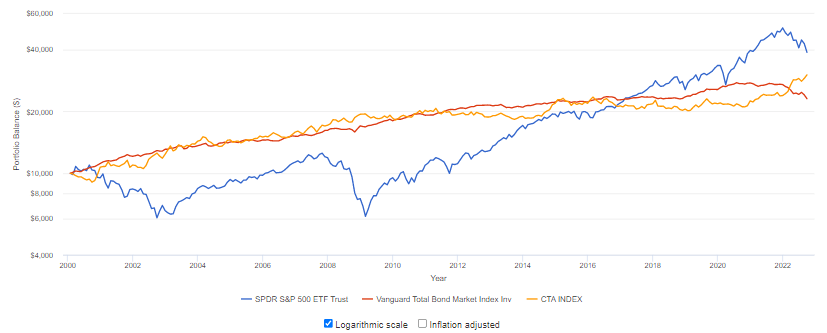
The SG CTA Index is the SocGen CTA Hedge Fund Index which tracks the daily returns of the 20 large CTA hedge funds.
SocGen stands for Société Générale S.A., a Paris-based multinational financial services company founded in 1864.
CTA stands for Commodity Trading Advisors.
Here is the actual performance of DBMF (in yellow) versus SPY (in blue) and VBMFX (in red) since the inception of DBMF in 2019.
Portfolio Visualizer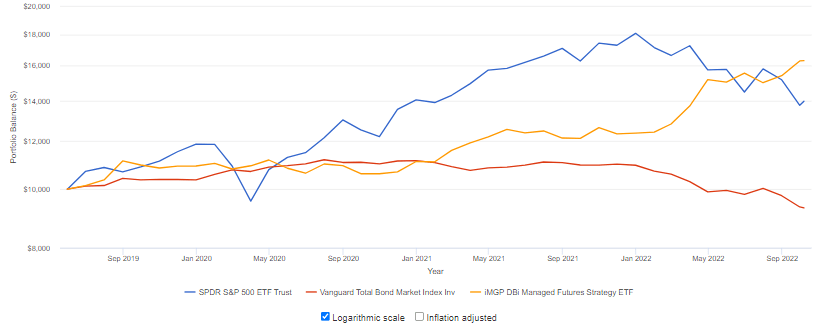
Morningstar uses a different index as the benchmark for CTA funds. It uses Credit Suisse Managed Futures Liquid TR USD index, and it classifies DBMF within “US Systematic Trend”.
Below is a comparison of DBMF to all mutual funds and ETFs within the US Systematic Trend category.
DBMF is in blue. The Credit Suisse index is red, and the category is in yellow. The values in this chart all begin at an assumed $10,000 investment.
Morningstar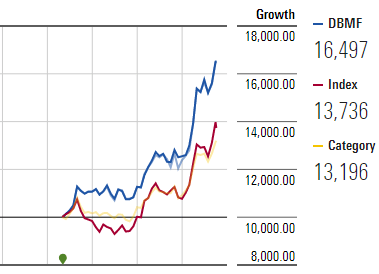
This is the cross-correlation with the Aggregate Bond market and the S&P 500. The low correlation to bonds and negative correlation to stocks is generally a good thing for a risk diversifier.
QVM Group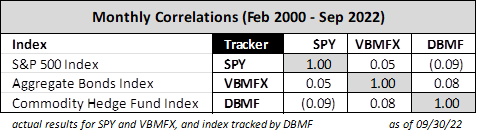
These are growth, volatility, drawdown and risk ratings for Aggregate Bonds and the S&P 500 versus DBMF.
QVM Group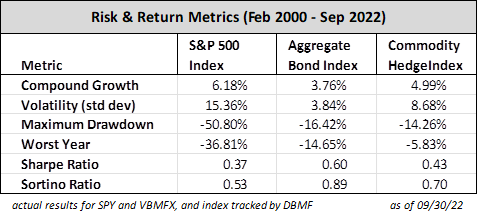
This is an illustration of how commodity trading through DBMF could impact outcomes when used as a partial substitute in the bond allocation of a 60/40 or 40/60 portfolio. There is not much difference created until a bad year for bonds in which case DBMF would have and currently does help significantly.
QVM Group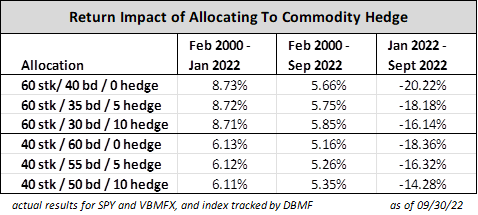
Performance in Down Stock Markets
The SC GTA Index outperformed the MSCI World stocks index and the Bloomberg Global Bonds index in each of the major downturns of the past 20+ years. Similarly, DBMF is intended for portfolios to serve the same Bear market relative return pattern going forward.
DBMF presentation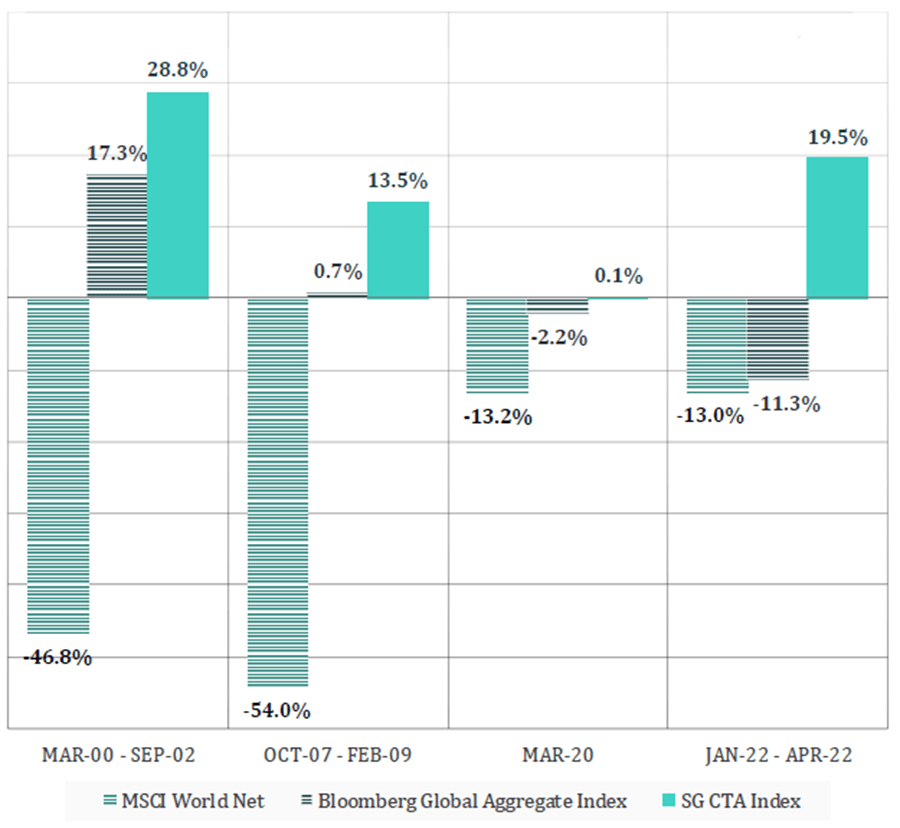
Why Is This Commodity Trading ETF Attractive?
- Commodity trading has a low correlation to stocks and bonds, which is important to risk diversification
- The average commodity trading fund performance is attractive relative to bonds, but the dispersion of results by individual managers around the average is very high and the persistence of performance of individual managers is low
- This fund solves the dispersion and persistence problem through its gross index return tracking methodology
- The fees and expenses of commodity trading funds is high, approximately 5% per year on average for private funds and about 1.5% for public funds
- This fund expense ratio is only 0.95%
- They believe the key to generating Alpha in commodity trading is to closely track the gross (before fees) index average at low expense
- Fee Reduction is the Purest Form of Alpha.
The Dispersion And Persistence Problem
Individual trading hedge funds almost all use some form of trend following. However, they do not all follow the same assets or commodities. They do not use the same trend-following methods. Their methods reflect what they think is important which is different from what another fund thinks is important. They tend to allow personal judgments to override their methodology rules, or they may not have rules, only guidelines. For these sorts of reasons, returns very widely among and between funds – DISPERSION.
Also quite important, any one approach may work well in one set of market conditions and not in another, resulting in a lack of return PERSISTENCE. When persistence fails it sometimes does so catastrophically, and as the DBMF portfolio manager Andrew Beer said, “They can rip your face off.”
DBMF presentation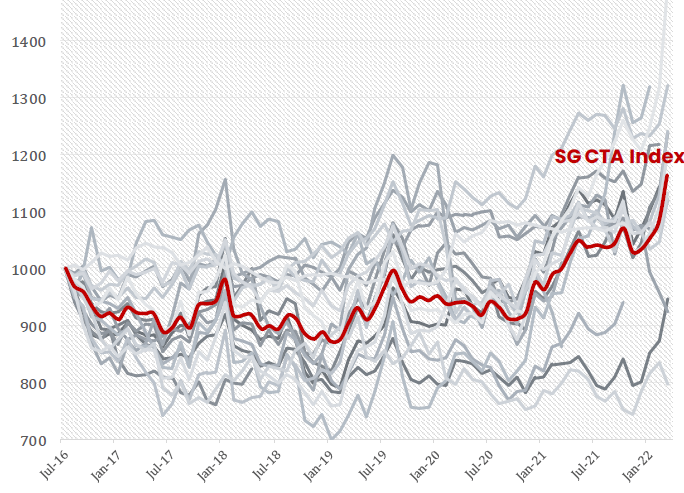
The DBMF Solution To The Dispersion And Persistence Problem
- Don’t have an opinion or view of the direction of any commodity
- Use rules-based regression weekly to reconstitute the portfolio to replicate the return of the gross SocGen CTA hedge fund index return with a fixed, limited set of highly liquid futures
- Operate with a well below industry expense ratio to outperform the index.
DBI has been running their method since 2016, although the ETF inception was May 7, 2019. Here it is (in light blue) versus 20 large CTA hedge funds (in shades of gray) and the average (in red, the SocGen CTA Hedge Fund index).
DBMF presentation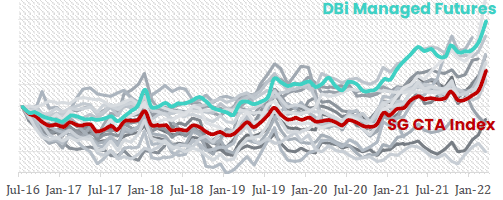
Methodology
Let’s begin with excerpts from the Principal Investment Strategies as described in the prospectus:
- managed futures strategy employs long and short positions in derivatives, primarily futures contracts and forward contracts, across the broad asset classes of equities, fixed income, currencies
- positions in those contracts are determined based on a proprietary, quantitative model – the Dynamic Beta Engine – that seeks to identify the main drivers of performance by approximating the current asset allocation of a selected pool of the largest commodity trading advisor hedge funds (“CTA”)
- the Dynamic Beta Engine analyzes recent historical performance in order to estimate the current asset allocation of a selected pool of the largest CTAs
- The Sub-Adviser relies exclusively on the model and does not have discretion to override the model-determined asset allocation or portfolio weights
- The Sub-Adviser will periodically review whether instruments should be added to or removed from the model in order to improve the model’s efficiency
- The model’s asset allocation is limited to asset classes that are traded on U.S.-based exchanges.
- Based on this analysis, the Fund will invest in an optimized portfolio of long and short positions in domestically-traded, liquid derivative contracts selected from a pool of the most liquid derivative contracts
- expects to limit its investments to highly-liquid, domestically-traded contracts that the Sub-Adviser believes exhibit the highest correlation to what the Sub-Adviser perceives to be the core positions of the target hedge funds
- target an annualized volatility level for the Fund of 8-10%
- in addition to its use of futures … the Fund expects, under normal circumstances, to invest in debt securities to collateralize its derivatives investments, for liquidity purposes, or to enhance yield
Based on an interview with Andrew Beer, one of the two developers of the methodology and two portfolio managers, the “Dynamic Beta Engine” works about like this:
- Each Monday the Engine calculates the 20-day trailing return of the SocGen CTA Hedge Fund index which reports the average of the daily returns of 20 large CTA firms
- The Engine adds to that return the period equivalent of a 5% expense factor characteristic of large private CTA funds (such as the typical 2% mgt fee and 20% carry)
- Basically, estimating the zero-fee equivalent (gross return) of the large CTA’s
- That becomes the target return for the Engine
- The Engine then uses a regression optimization program of the 10 or so highly liquid futures that tend to be at the core of large CTA portfolios to:
- Find an allocation using only those core futures as longs or shorts that would have resulted in the target return over the same period
- The Engine further optimizes the allocation to achieve 8% to 10% volatility.
- Each Monday, the managers populate the portfolio with futures contracts as specified by the Engine
- Each Monday they repeat the process.
Such regression modeling of a portfolio out of a specified list of securities, including target returns and volatility is a well and long-established technology. I am sure there are proprietary settings, and they may tweak the settings over time, but in the end, this is a totally rules-based system with a clearly articulated methodology.
Fundamental to their approach is that they do not have a view or opinion. Their sole objective is to replicate the estimated gross return of the SocGen index as closely as possible. They do not second guess or manually override the allocation conclusion of their rules-based, regression-driven methodology.
These are the highly liquid commodity futures that DBMF believes comprise the core positions of most of the large private CTA’s
- Fed Funds Rate
- 2-Yr Treasuries
- 10-yr Treasuries
- 30-yr Treasuries
- Yen
- Euro
- S&P 500
- MSCI EAFE
- MSCI Emerging Markets
- Oil
- Gold
Methodologies of the Other Funds: Including DBMF, there are 24 mutual funds or ETFs in the Morningstar US Systematic Trend category with at least 1 year of operation. After reading the Principal Investment Strategies of the others, you are unable to say what they actually do or how they do it. Most are based on portfolio manager analysis and judgment with the authority to go far and wide to utilize all manner of instruments, and generally to position for where the manager believes the market is going. Some funds mention rules-based proprietary systems but provide no explanation beyond saying the system exists and is proprietary. A few funds delegate management to several sub-advisors, each of which have their own opaque description of what they do and how they do it.
For practical purposes, to use the other funds the choice would have to be limited to manager reputation and track record without understanding how they operate.
In the case of DBMF, the manager is not widely known, and the fund track record is short but good. The key to selecting them is (1) the transparency of their rules-based method using variations of well-established tools, and (2) their goal to meet or exceed the gross average of the diffuse performance of the many large CTA’s but with lower expenses.
DBMF will be unlikely to be a bottom or top performer in any short period, but by being near or above the average most of the time, they are likely to be among the top performers over the long-term. That is the way it is for any fund in any category.
Importantly we can sleep well at night because we understand what they do, how they do it and why they do it. Can’t say the same for the others.
What About Other Public CTA Fund Alternatives?
After eliminating multiple share classes of mutual funds, there are 24 mutual funds and ETFs classified by Morningstar as “US Systematic Trend” which also have at least 1 year of operations, shown in the comparison table below.
Total Return sorted by YTD performance:
DBMF is above average for all periods which is their objective. If they should be top or near top performer, it would mean they are not tracking the gross index return. It is well demonstrated that if a fund can manage to be in the top high over many periods, they end up as top 10% or so over the long term – outperforming in the long-term by not underperforming in the short-term.
QVM Group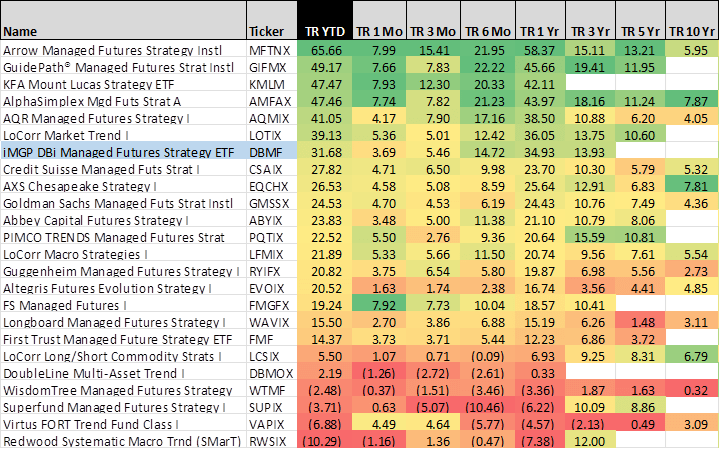
Costs and Returns After Annual Taxes
DBMF has:
- Below average expense ratio
- Above average distribution
- Well above average after-tax annual total return (that is annual tax, not tax on exit from the fund).
QVM Group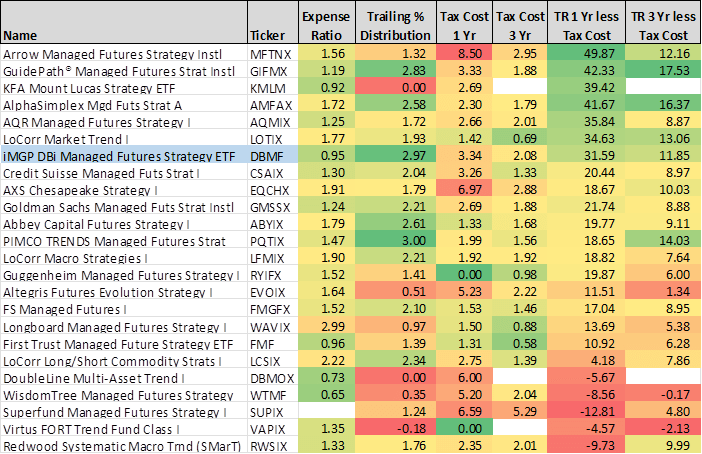
Tax Cost Ratio Explanation from Morningstar
“The Morningstar Tax Cost Ratio measures how much a fund’s annualized return is reduced by the taxes investors pay on distributions. … For example, if a fund had a 2% tax cost ratio for the three-year period, it means that on average each year, investors in that fund lost 2% of their assets to taxes. If the fund had a three-year annualized pre-tax return of 10%, an investor in the fund took home about 8% on an after-tax basis. (Because the returns are compounded, the after-tax return is actually 7.8%.)”
Risk Profile
DBMF has an above average return to risk profile in terms of the Sharpe Ratio, Sortino Ratio and Worst Drawdown over the period of DBMF’s operation.
- The Sharpe Ratio which is return in excess of the 3-month T-Bill rate, that excess return divided by the volatility (annualized standard deviation) – return for volatility risk experienced.
- The Sortino Ratio is the same as the Sharpe Ratio, but it only counts volatility on the downside
- Worst Drawdown is the largest drop from peak to trough during the measurement period (not a calendar year measure).
QVM Group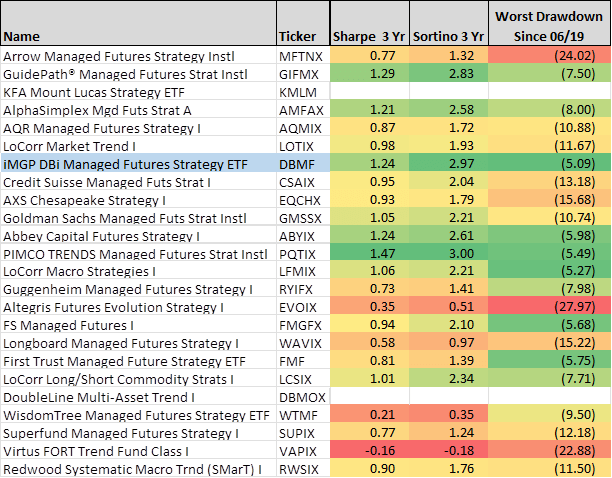
Performance Comparison with CTA Alternatives
The alternative CTA funds from “big name” institutions: PIMCO, Goldman Sachs and Credit Suisse did not have a higher cumulative return over the period of DBMF operations. The prominent alternatives mutual fund manager AQR also did not outperform DBMF. Three funds did have a higher cumulative return, but not by much, and in the case of one, that was achieved with more drawdown risk. In all the cases the disclosure of their methodology in their prospectus was not helpful in understanding how they do what they do.
Bedrock QVM philosophy is the need to know what you own and why, and to tilt as much as possible to clearly articulated rules-based methodology. Only DBMF satisfies that philosophy and produces good category specific returns.
- MFTNX is a fund of funds.
- GIFMX uses an undisclosed trend following methods that is not stated as rules-based.
- AMFAX uses undisclosed proprietary trend methods, and “will have great flexibility to allocate” – not rules-based.
- The methodology descriptions by PIMCO, Goldman Sachs, Credit Suisse and AQR are no clearer and are not rules-based.
DBMF has met its goal of outperforming the SocGen CTA Hedge Fund index and demonstrated its ability to do well even when stocks and bonds are suffering from rising interest rates.
QVM Group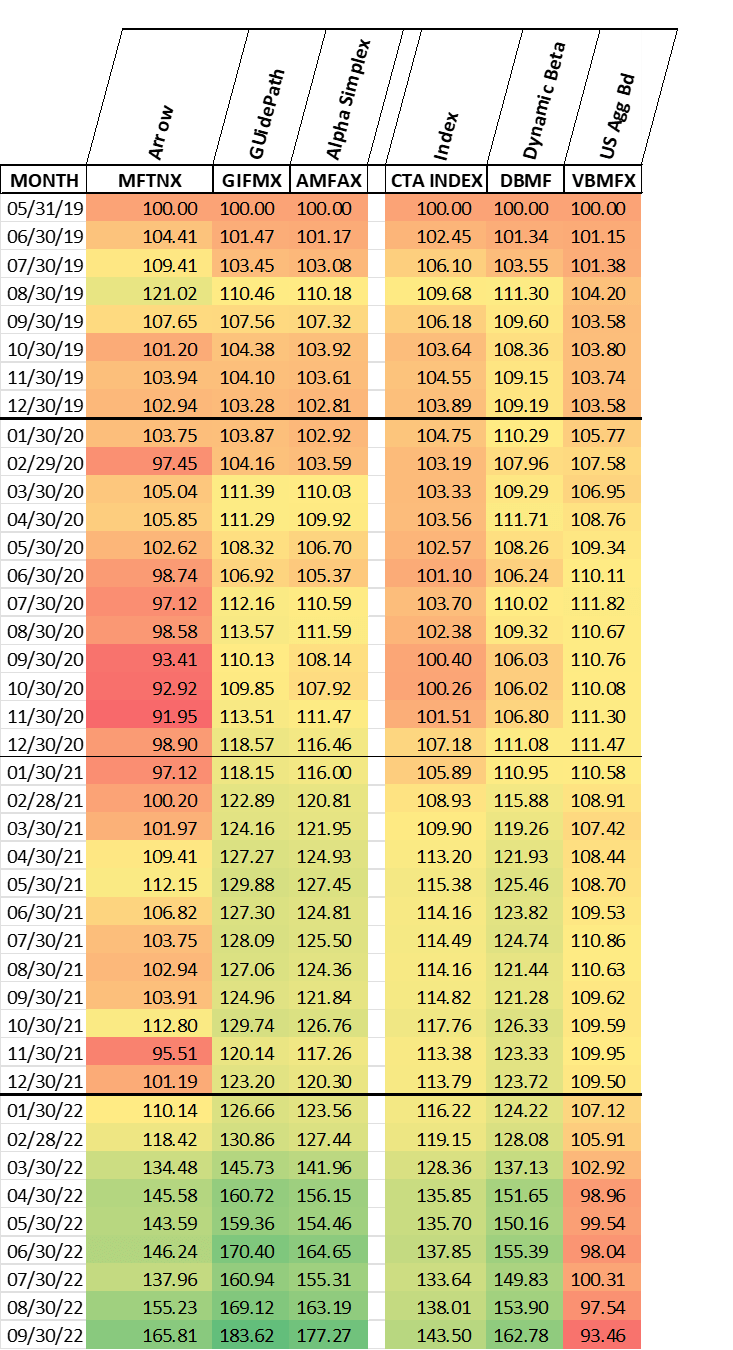
DBMF has risen from near obscurity to a substantial asset size this year, as stock and bond markets have declined. Look at this AUM chart.
YCharts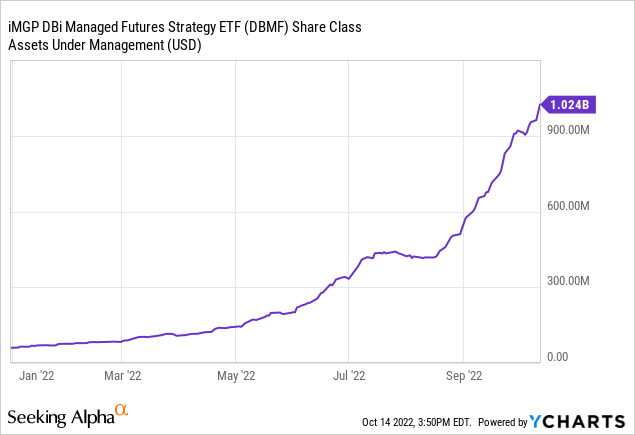
Some small funds’ strong performance opportunity declines as they become much larger because their minimum bite size increases so much that they cannot effectively access the smaller companies that were the basis of their strong early performance.
According to portfolio manager Andrew Beer, the markets in which DBMF invests are so liquid and so deep that there is no effective reduction in performance as the fund increases in size.
It also means to me that we should not be concerned that they are prone to stub their toes as a result of rapid growth.
David Swensen said in his 2005 book for individual investors that category allocations less than 5% aren’t able to move the dial much on risk diversification or total return.
DBMF is in a category quite distinct from stocks or bonds or real estate.
This article was part of a client letter last week. Let’s close today with a series of charts as of the close of business 10/14/22 comparing DBMF to SPY (S&L 500) and IEF (7-yr to 10-yr bonds) and SCHH (top 100 REITs). They pretty much speak for themselves.
5-Days
YCharts
3-Months
YCharts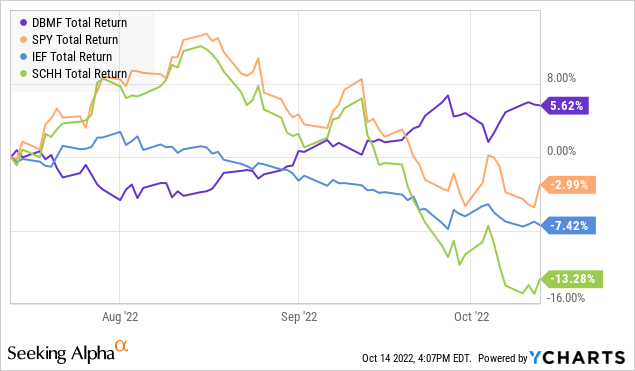
YTD
YCharts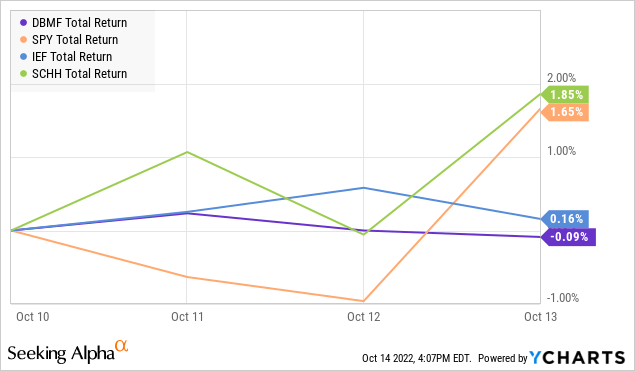
3-Years
Y-Chart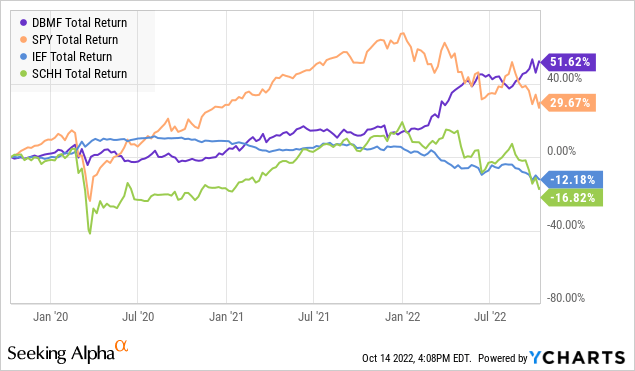
Be the first to comment