

cagkansayin/iStock via Getty Images
Written by Nick Ackerman, co-produced by Stanford Chemist. This article was originally published to members of the CEF/ETF Income Laboratory on July 4th, 2022.
DoubleLine Opportunistic Credit Fund (NYSE:DBL) is one of three Jeffrey Gundlach funds. The other two are the DoubleLine Income Solutions Fund (DSL) and DoubleLine Yield Opportunities Fund (DLY). We recently covered DSL providing an update, and our last update on DLY isn’t too old either.
Looking at these three sister funds, YTD, we can see that DBL is holding up the best on a total share price and total NAV return basis. The credit quality is a bit higher in their portfolio, and the actual underlying bond prices appear to be holding up better. All the funds’ share prices are performing worse than their total NAV return would suggest.
Ycharts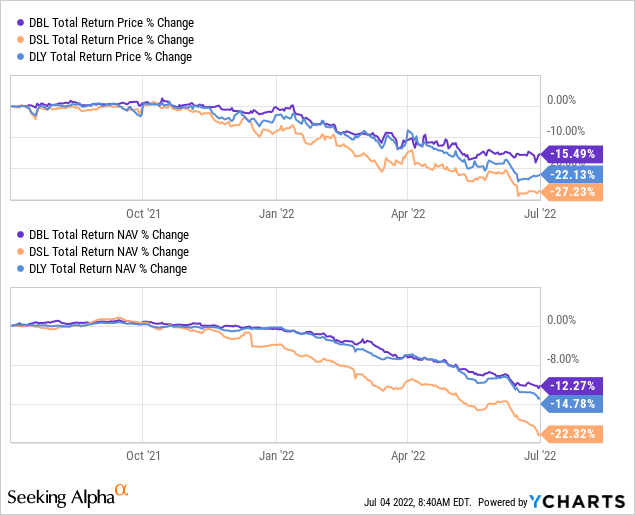
That is often the case in the closed-end fund space. This is particularly noticeable when there is greater volatility. The average CEF discount at the beginning of 2022 was a historically narrow 2.28%. This has now expanded to around 5.60% at the end of June, according to RiverNorth.
CEF Historical Discount (RiverNorth)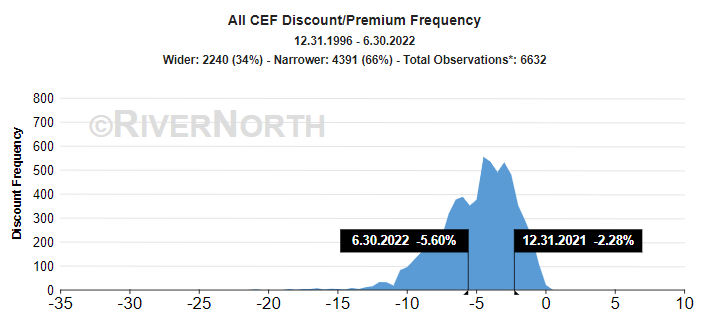
Due to the widening discounts in the other funds and not seeing a similar decline in DBL’s discount (as well as the underlying portfolio), it would suggest that DBL might not be the best choice at this time. Instead, if you can handle more uncertainty and risk, DLY or DSL could present a better opportunity for potential appreciation. On the other hand, the differentiated positioning sets it apart from the other sister funds too.
The Basics Of DBL
- 1-Year Z-score: -0.47
- Discount: 2.37%
- Distribution Yield: 8.45%
- Expense Ratio: 1.60% (including interest expense)
- Leverage: 13.03%
- Managed Assets: $303.554 million
- Structure: Perpetual
DBL’s investment objective is “to seek high total investment return by providing a high level of current income and the potential for capital appreciation.”
To potentially achieve this objective, the fund will invest “in debt securities and income-producing investments of any kind, including, without limitation, residential and commercial mortgage-backed securities, asset-backed securities, U.S. Government securities, corporate debt, international sovereign debt, and short-term investments.”
This leaves the fund quite flexible to invest where they see fit. This can sometimes be a good thing as it doesn’t limit the managers to necessarily investing when they might not feel too confident in a specific sector or asset.
At around 13% leverage, it is the least leveraged of the DoubleLine trio. It is also the smallest in terms of total managed assets at only around $303 million. That compares to DLY with over $1.088 billion and DSL’s even larger ~$1.988 billion in AUM.
Having a smaller fund can impact the trading volume. DBL averages 62k shares a day, DLY is around 170k and DSL averages nearly 393k shares per day of volume. That helps highlight a direct link between the size of the fund and the average number of shares traded daily.
Valuation Amongst The Trio
The discount/premium mechanic in CEFs is a key focus in valuing a CEF. We can see how much better DBL has been holding up on a YTD basis. DLY and DSL have shaven off what was an unusually sharp discount expansion recently. As the market becomes more volatile, discounts tend to become more volatile overall.
Ycharts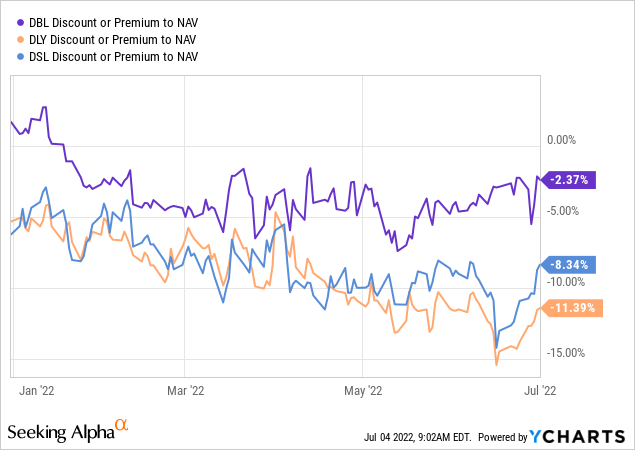
However, the raw discount/premium doesn’t tell us the whole story. Instead, a better gauge is when we look at the historical discount/premium and where a fund tends to trade. DLY launched only in 2020, so I’m leaving that one off the next chart. Comparing DBL and DSL can give us a better look as we can go back almost over a decade. DSL launched in 2013, so it’ll be a bit shy.
What the average tells us is that DBL is only trading slightly below its average. On the other hand, DSL is trading well below its average.
Ycharts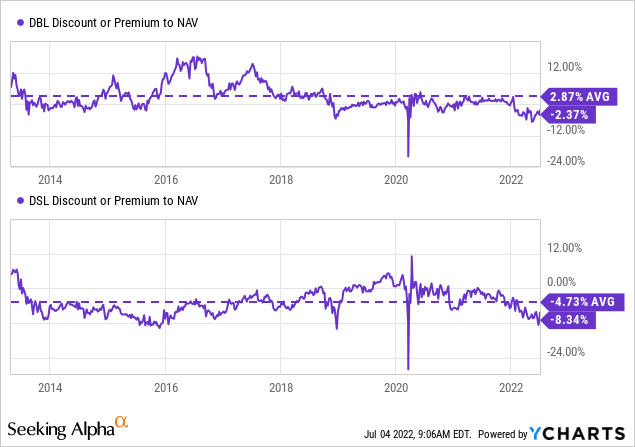
Why The Valuation Difference?
CEFs tend to trade at different valuations for a number of reasons. They aren’t always apparent. Sometimes, it is as simple as a fund sponsor’s name. PIMCO tends to be a fund sponsor that is viewed as highly favored in managing fixed-income funds. They have a strong historical performance that helps back that up too. So they tend to trade at a higher valuation, often times at premiums for several of their funds.
Another main reason why CEFs can trade at larger discounts relative to each other would be different portfolio positioning. Giving different exposure is going to provide whether or not investors are willing to pay up or not.
DBL, DLY and DSL – while all similar and having some overlap – aren’t necessarily the same funds. I’ve noticed that DSL tends to favor overweight exposure to emerging markets. It comes in at a nearly 41% allocation at this time.
DLY is more of a traditional multi-sector bond fund approach. With DBL, we have a higher concentration of MBS exposure and collateralized loan obligations [CLOs].
The MBS exposure comes via non-agency commercial MBS, Agency RMBS, non-agency residential MBS and to a smaller extent, agency commercial MBS.
DBL Portfolio Breakdown (DoubleLine)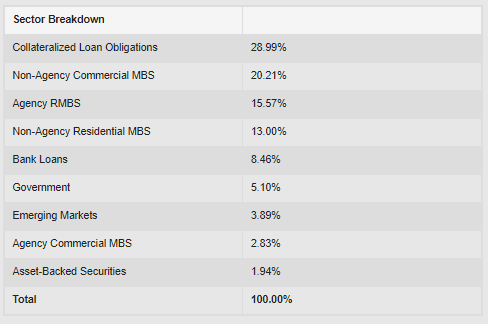
This type of portfolio weighting gives a more even split between investment grade and below-investment grade. When we see agency and government names in a fixed-income portfolio, it often means higher quality bond positions. On top of this, they have another nearly 27% of the portfolio in investment-grade positions. These three categories account for almost 49% of the portfolio.
DBL Credit Quality (DoubleLine)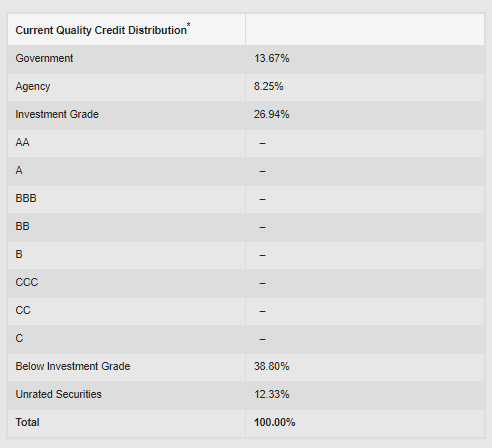
The “junk” or high yield portion of the portfolio comes to only around 39%. DLY has nearly 63% of its portfolio invested in below-investment-grade and another 19.53% in unrated bonds. DSL is even junkier at over 79% in junk bonds and another 11.63% in unrated.
That makes another link we can draw quite clear. As we are heading into this year, credit risk has become a big topic due to the potential of being in a recession already or going to be in a recession. This would come about as the Fed is raising interest rates. Once a rate hiking cycle begins, it often doesn’t stop until a recession.
DBL has what could be considered the safest portfolio, DLY leans towards a junkier portfolio, and DSL is the heaviest in the most speculative holdings. The link here is that DSL has also performed the worst on a YTD basis.
Does that mean losses in the portfolio are actually happening? At this point, I think not. I don’t believe they are actually holding positions that are defaulting or going bankrupt. Instead, I believe that it is discounting the fund for what might happen.
This is reflected in the underlying average market price of the portfolios.
For DBL, we see that the underlying bonds are actually trading above par still. Which is quite shocking overall, in my opinion. That is the figure they provide though, so I’m just passing the information along.
DBL Portfolio Characteristics (DoubleLine)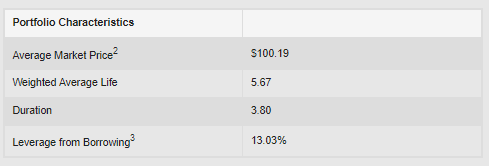
DLY’s portfolio is discounted at an average market price of $91.51. So you get a fairly attractive discount on the fund, then another discount on the underlying portfolio.
DLY Portfolio Characteristics (DoubleLine)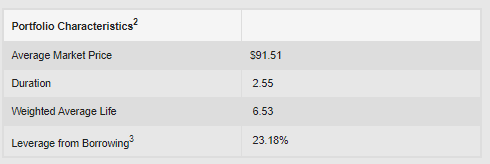
Moving onto DSL, we have their portfolio’s average market price of $79.18.
DSL Portfolio Characteristics (DoubleLine)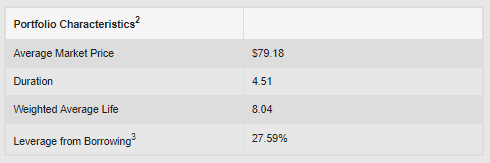
You are getting a massive discount, but it might be appropriate given the unclear economic future we are presented with at this time.
A Look At DBL Distribution
Since the fund launched, it has had a fairly steady distribution. They cut once, but otherwise. Investors have been getting a fairly consistent payout. This currently works out to a distribution yield of 8.45% and a NAV yield of 8.24%.
DBL Distribution History (CEFConnect)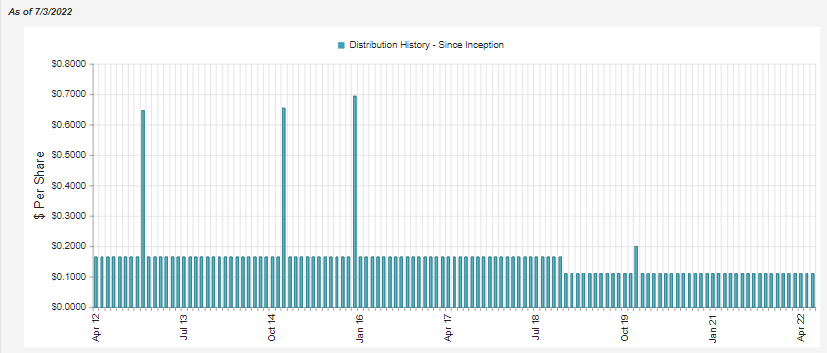
As is the case with any fixed-income fund, most of the distribution should be covered by net investment income. In fact, in an ideal world, it should be entirely covered by NII. Capital gains in the fixed-income space should be the cherry on top.
DBL Semi-Annual Report (DoubleLine)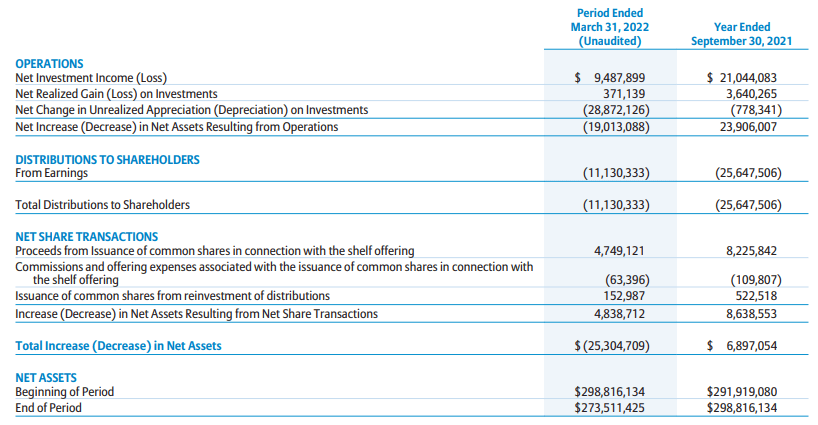
In their latest report for the six months ending March 31st, 2022, NII coverage reached 85.24%. That marks a small improvement from the 82.05% in the previous fiscal year. We aren’t at the ideal 100%+ level, but the actual yield on a NAV isn’t overly egregious. I would suspect that they will continue with the current payout for now. However, it is really at a 50/50 chance where I don’t have a strong conviction either way.
Conclusion
Of the DoubleLine trio of funds, DBL offers the least compelling valuation argument, in my opinion. The discount is closer to its longer-term average, and the underlying portfolio hasn’t been hit quite as hard.
On the other hand, these funds appear to highlight a direct correlation between risks taken and valuation. If one is more risk-averse, the more modest leverage and tilt towards some investment-grade positioning might make one more comfortable. DBL is fairly evenly split between higher quality positions (government, agency and investment-grade) and below-investment-grade bonds.
If one can tolerate a higher potential for loss to gain a higher potential reward, DLY and DSL also represent fairly attractive options. DSL was hit the hardest as it holds the junkiest portfolio. DLY was also hit as it is overweight below-investment-grade positions too. However, the underlying portfolios already reflect these greater risks. The funds also have larger discounts due to the perceived higher risk of a recession at this time.
I’ve personally invested in DLY. However, taking a closer look at all three of these funds side-by-side, I could easily see an argument being made for any one of these funds. They are differentiated enough to achieve a different outcome depending on the economic situation that might be to come.
Be the first to comment