

GERMANY 40 (DAX), EUR/USD ANALYSIS
- Weak German, French and EU PMI’s.
- DAX, EUR/USD overlooks economic data.
- DAX pushes above 15600.
- EUR/USD rectangle support tested.
EURO AREA FUNDAMENTAL BACKDROP
GERMAN GIVES PRECURSOR TO EU PMI’S
After yesterdays FOMC decision to begin tapering later this year (November/December), markets are still mulling over the announcement by Fed Chair Jerome Powell. The fundamental environment will obviously remain extremely supportive until then, so equities may continue its rise. The U.S. dollar did gain marginally against the Euro which could be a safe-haven play as the Evergrande debt deadline draws closer. Germany (the regions strongest economy) along with France missed PMI forecasts prior to the EU print which followed suit – see economic calendar below. The manufacturing and production sectors slumped primarily due to a shortage in supply which led to bottlenecks while demand remains high. Although business activity is slowing MoM, one positive is the index remains above the 50 midpoint level and could be quickly reversed should supply-side challenges abate.
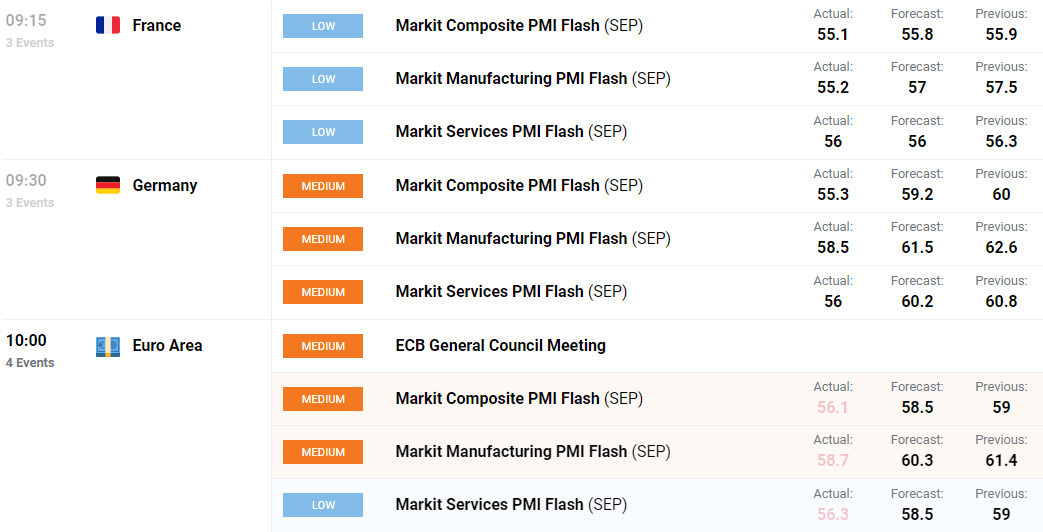
Source: DailyFX economic calendar
Focus will now shift to the Evergrande situation as well as German elections over the weekend. The German election is key for the nation as outgoing Chancellor Angela Merkel built a strong foundation with foreign peers (united foreign policy) which enhances the nations attractiveness in the business space. This is evident from the revenue generation split on the Germany 40 (DAX) index – refer to diagram below:
DAX REVENUE EXPOSURE SPLIT
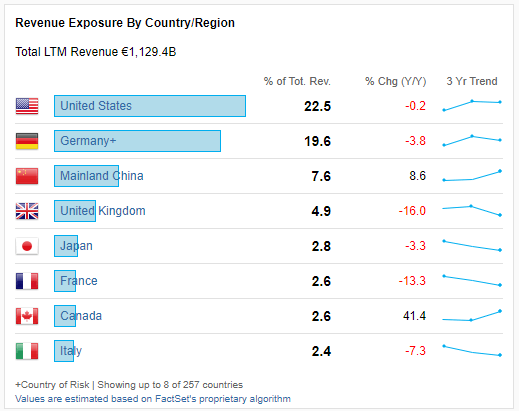
Source: FactSet
TECHNICAL ANALYSIS
DAX DAILY CHART
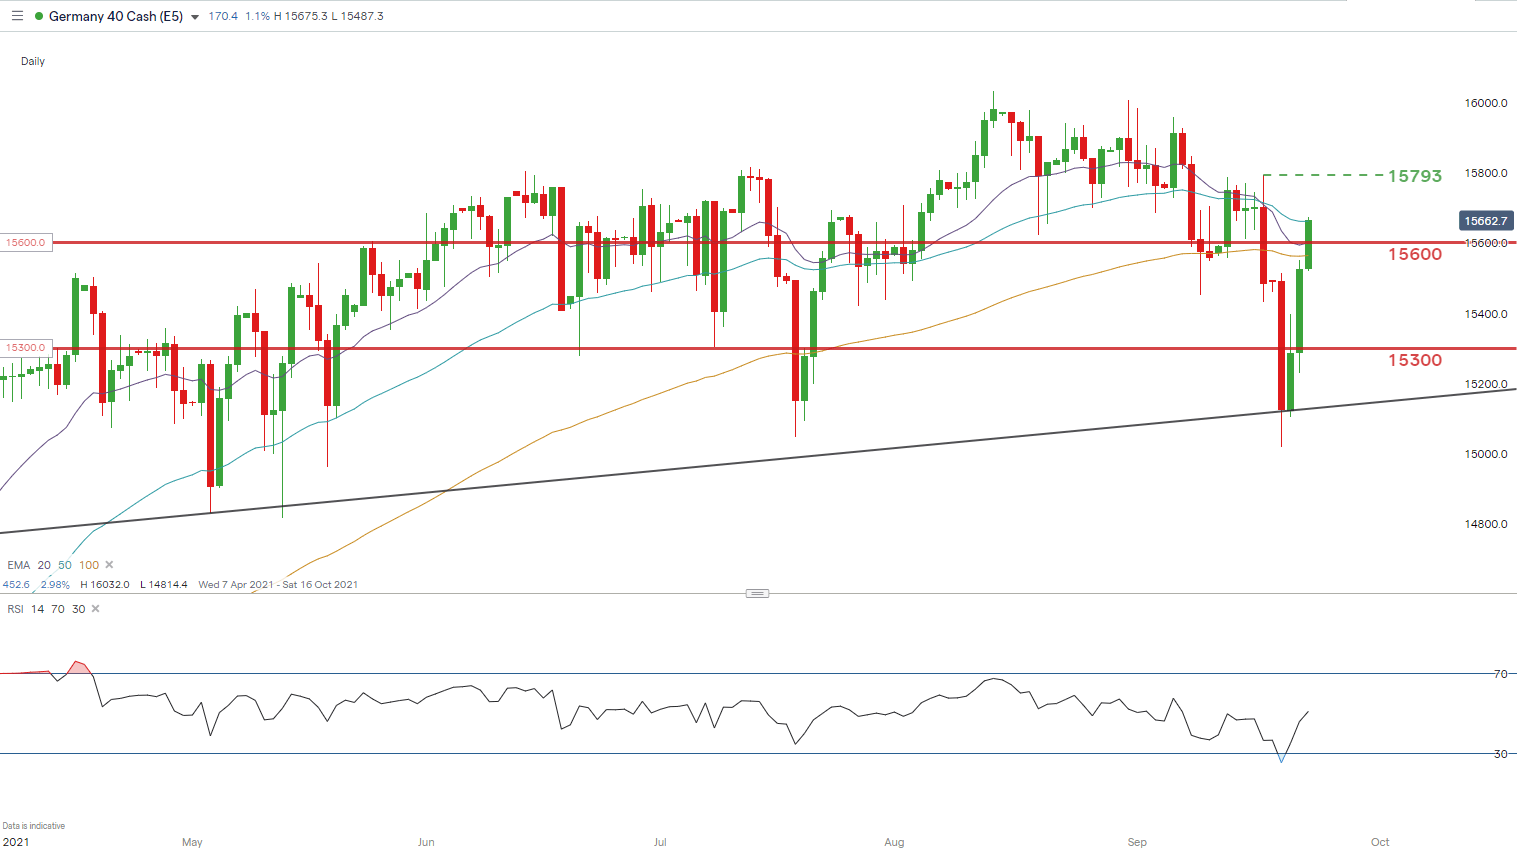
Chart prepared by Warren Venketas, IG
A third straight day of gains for the DAX index were not hampered by poor German and Euro PMI data. Rallying on the back off Fed Chair Powell’s statement, European equities are largely positive today. The DAX has found support alongside the medium-term trendline (black) in line with the oversold Relative Strength Index (RSI). Prices may find resistance at the 20-day EMA (purple) short-term but could soon test the recent swing high.
Resistance levels:
Support levels:
EUR/USD DAILY CHART
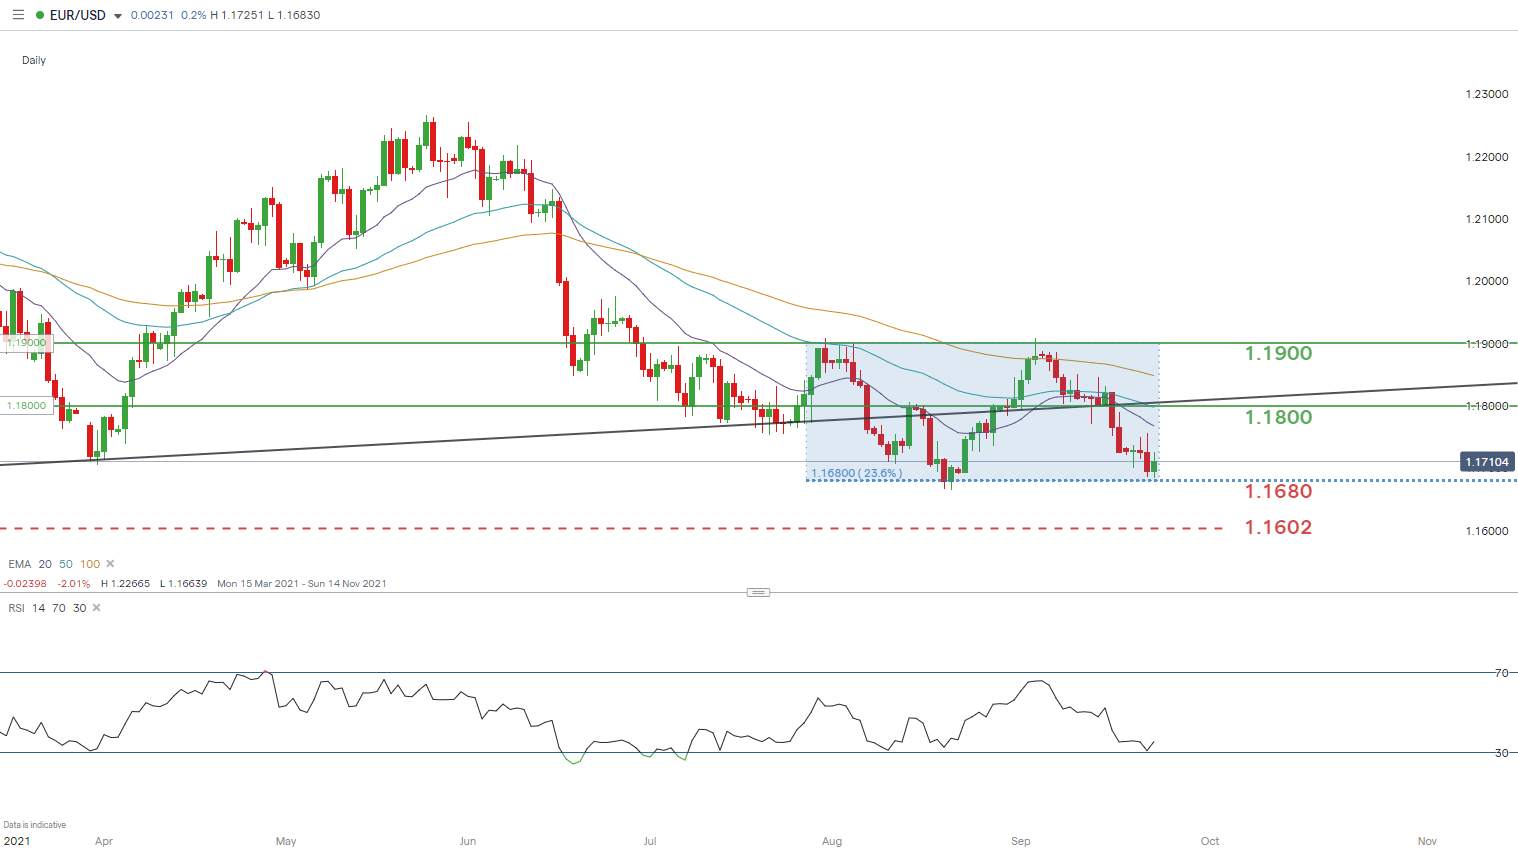
Chart prepared by Warren Venketas, IG
The daily EUR/USD chart outlines the minimal change post-announcement while price action pushes off short-term support at 1.1680 (23.6% Fibonacci level). Highlighted in blue is the formation of a rectangle pattern which whereby traders will look for a confirmation daily candle close above or below support or resistance for a breakout. close to oversold territory but may exhausted as the accommodative outlook by the Federal Reserve endures.
Resistance levels:
Support levels:
— Written by Warren Venketas for DailyFX.com
Contact and follow Warren on Twitter: @WVenketas
Be the first to comment