

Justin Sullivan
Just over nine months ago, I wrote on Darden Restaurants (NYSE:DRI), noting that while it was a very solid business, I didn’t see enough margin of safety to justify chasing the stock above $149.00. Since then, the stock has declined over 15%, with a drawdown of 25% at its June 2022 lows. Unfortunately, while inflation may be peaking, the macro backdrop has become much more tricky, with industry-wide traffic having a very rough year, even after factoring in the slight recovery we saw from a traffic standpoint in August.
The good news is that Darden is pricing below inflation and not taking advantage of its customers, and its guest scores remain at or near all-time highs at several of its brands (Olive Garden, Texas Longhorn, Cheddar’s). That said, the company’s margins have remained under pressure, and while Darden might be able to eke out earnings per share gains [EPS] this year, it won’t be easy given the current environment. So, while I see the stock as one of the better buy-the-dip candidates sector-wide, I don’t see enough margin of safety just yet.
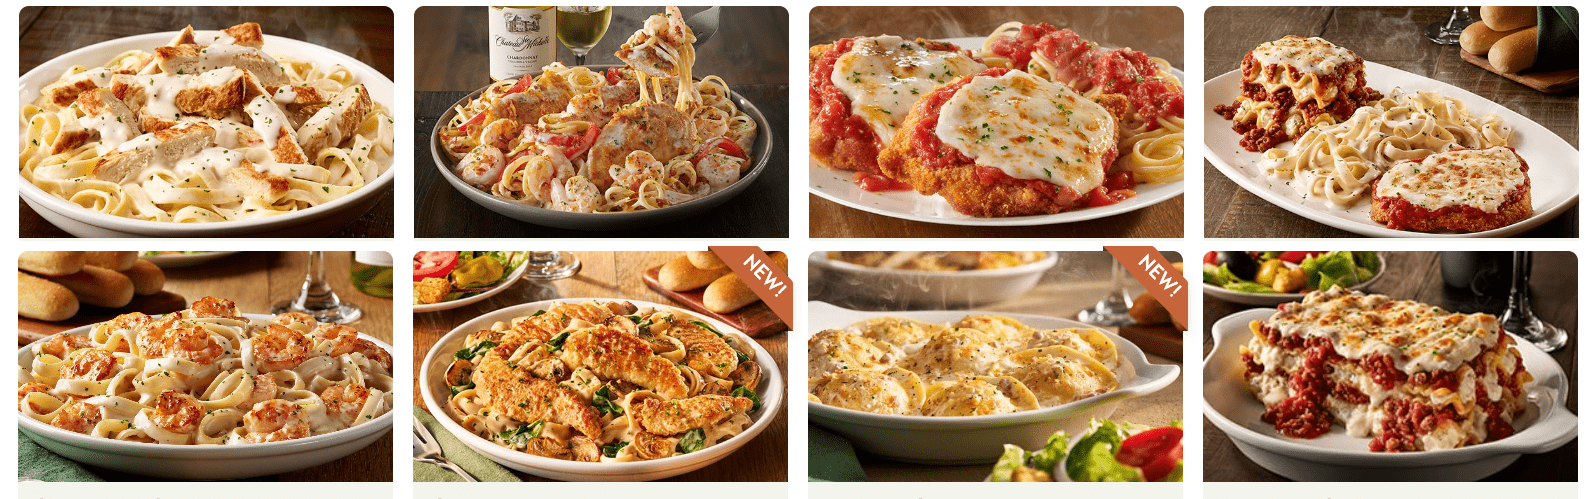
Olive Garden Menu Offerings (Company Website)
Q1 Results
Darden released its fiscal Q1 2023 results last month, reporting quarterly revenue of $2,446 million, a 6% increase from the year-ago period. This was driven by 4.2% same-store sales growth and 34 net new restaurant openings in the period, with same-store sales being helped by higher menu prices, offset by declining industry-wide traffic. Looking across the portfolio, the star performers were its Other segment (Cheddar’s, Bahama Breeze, Yard House, Seasons 52) and Fine Dining (Eddie V’s, Capital Grille), which saw 7.6% same-store sales growth in Q1, while Olive Garden and Longhorn were up just 2.3% and 4.2%, respectively.
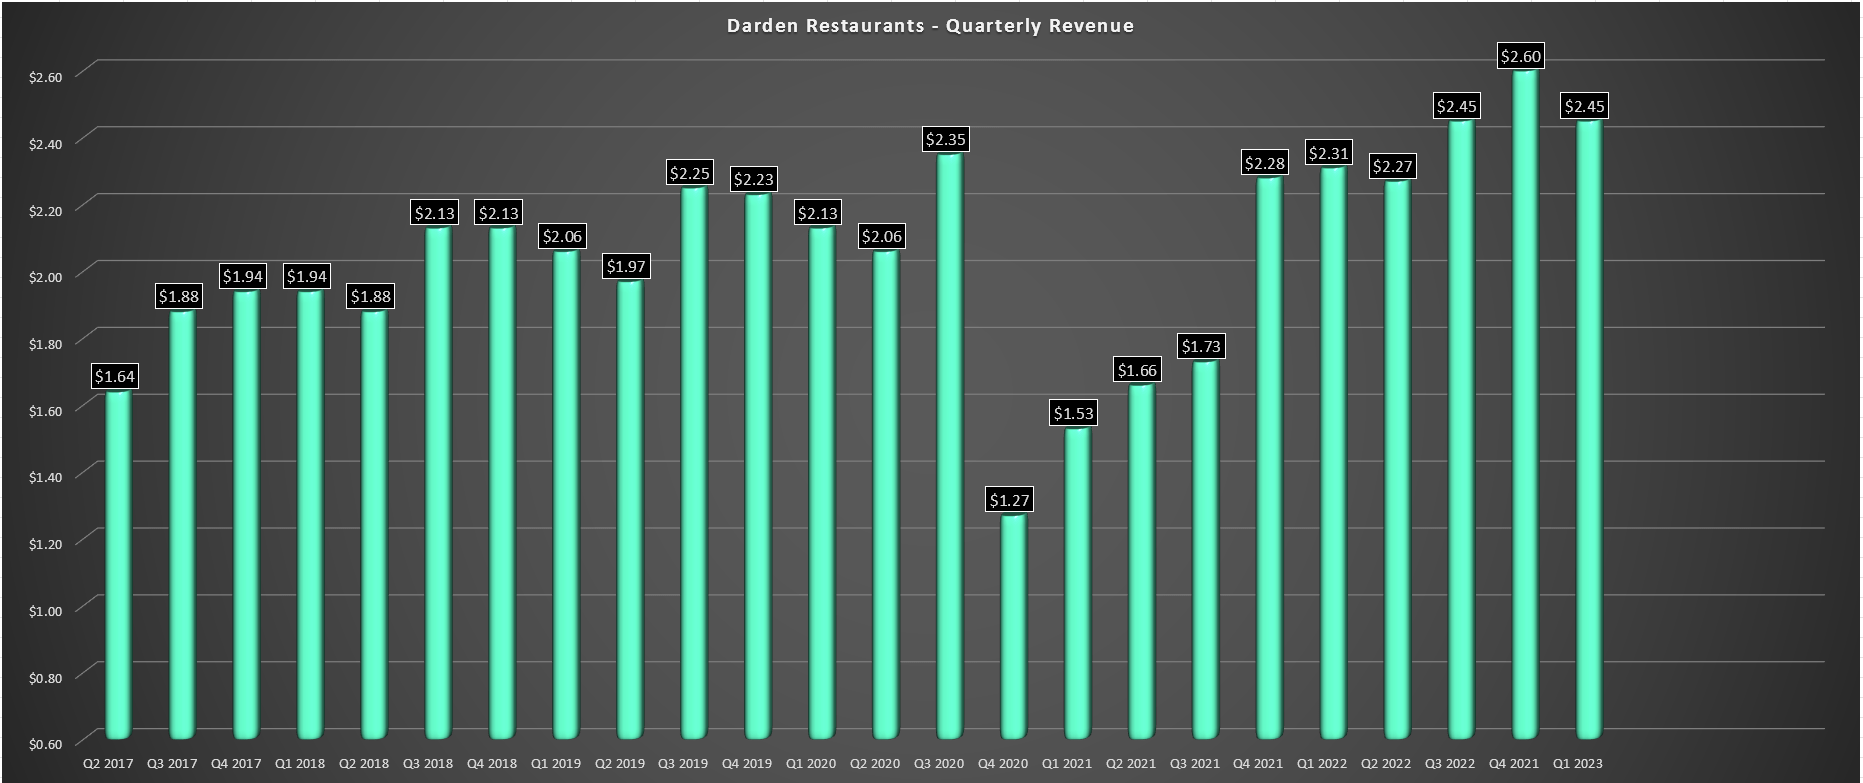
Darden – Quarterly Revenue (Company Filings, Author’s Chart)
The company noted in its prepared remarks that it continues to expect 4-6% same-store sales growth this year, and 55-60 new restaurant openings, with the latter translating to 3% unit growth year-over-year. Meanwhile, even though segment sales were a little softer than expected at Olive Garden (up 3.7% year-over-year), as were average weekly sales, which implies that traffic is down ~9% vs. pre-COVID-19 levels, guest scores remain at or near all-time highs at several brands, an encouraging sign. Just as importantly, the company is seeing stronger applicant flow and manager retention near pre-COVID-19 levels. This could be helped by Darden’s choice to train its staff properly and patiently even if staffing is sub-par vs. just throwing them into roles unprepared.
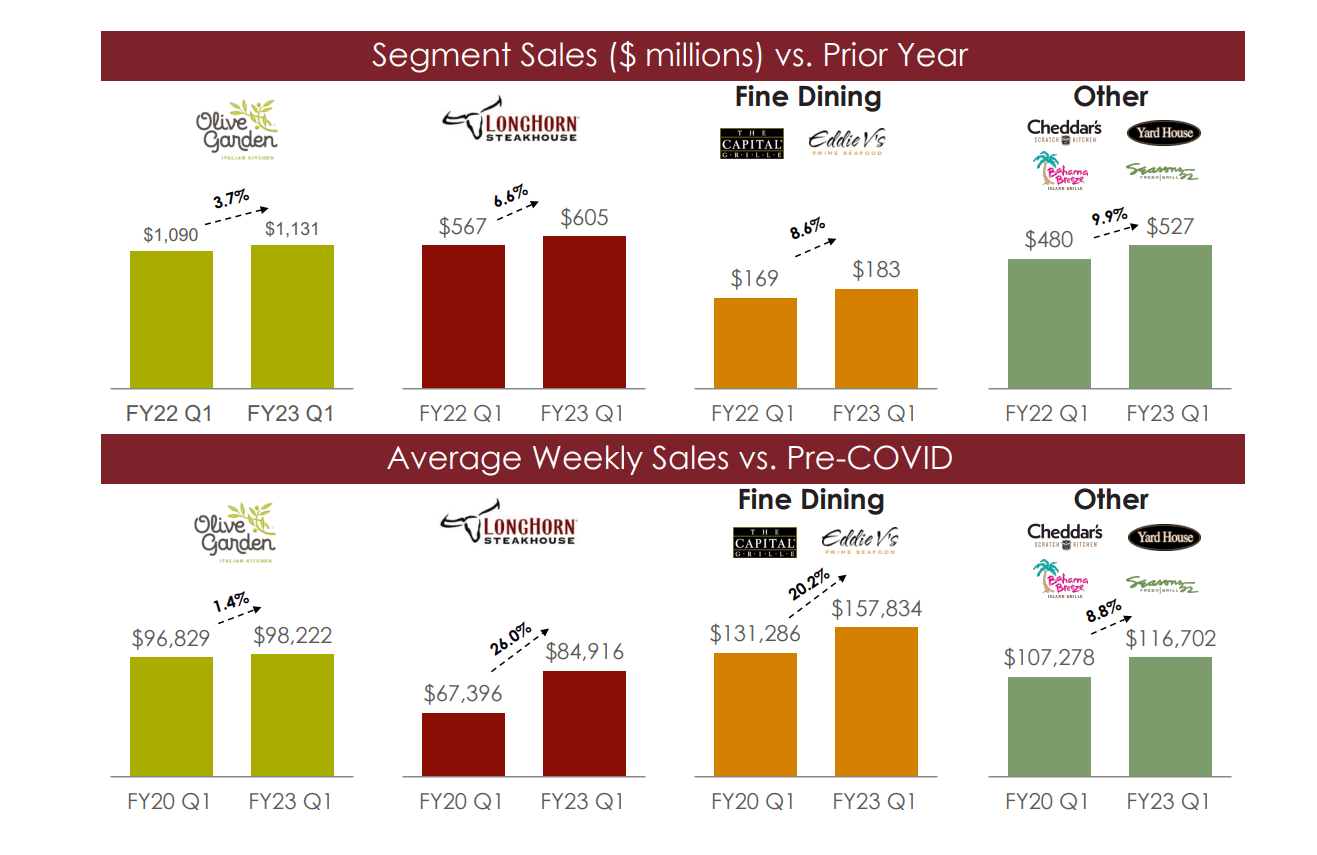
Segment Sales & Weekly Sales (Company Presentation)
On the negative side, Darden noted that it is seeing some check management at Cheddar’s and that it seems to be a tale of two guests across its portfolio. While Olive Garden and Cheddar’s indexes more towards less affluent customers, and the company is seeing some softness in demand from its guests with sub $50,000 household incomes, it believes its higher income guest is latter is based on there being little pushback to higher menu prices in Fine Dining and the outperformance in its slightly higher check brands (Yard House/Seasons 52). So, while Darden may be seeing a bit of pressure in one segment, it seems to be more resistant in the other. Finally, it is worth noting that Olive Garden is more promotions pre-COVID-19, and the company doesn’t mind losing their least profitable transactions.
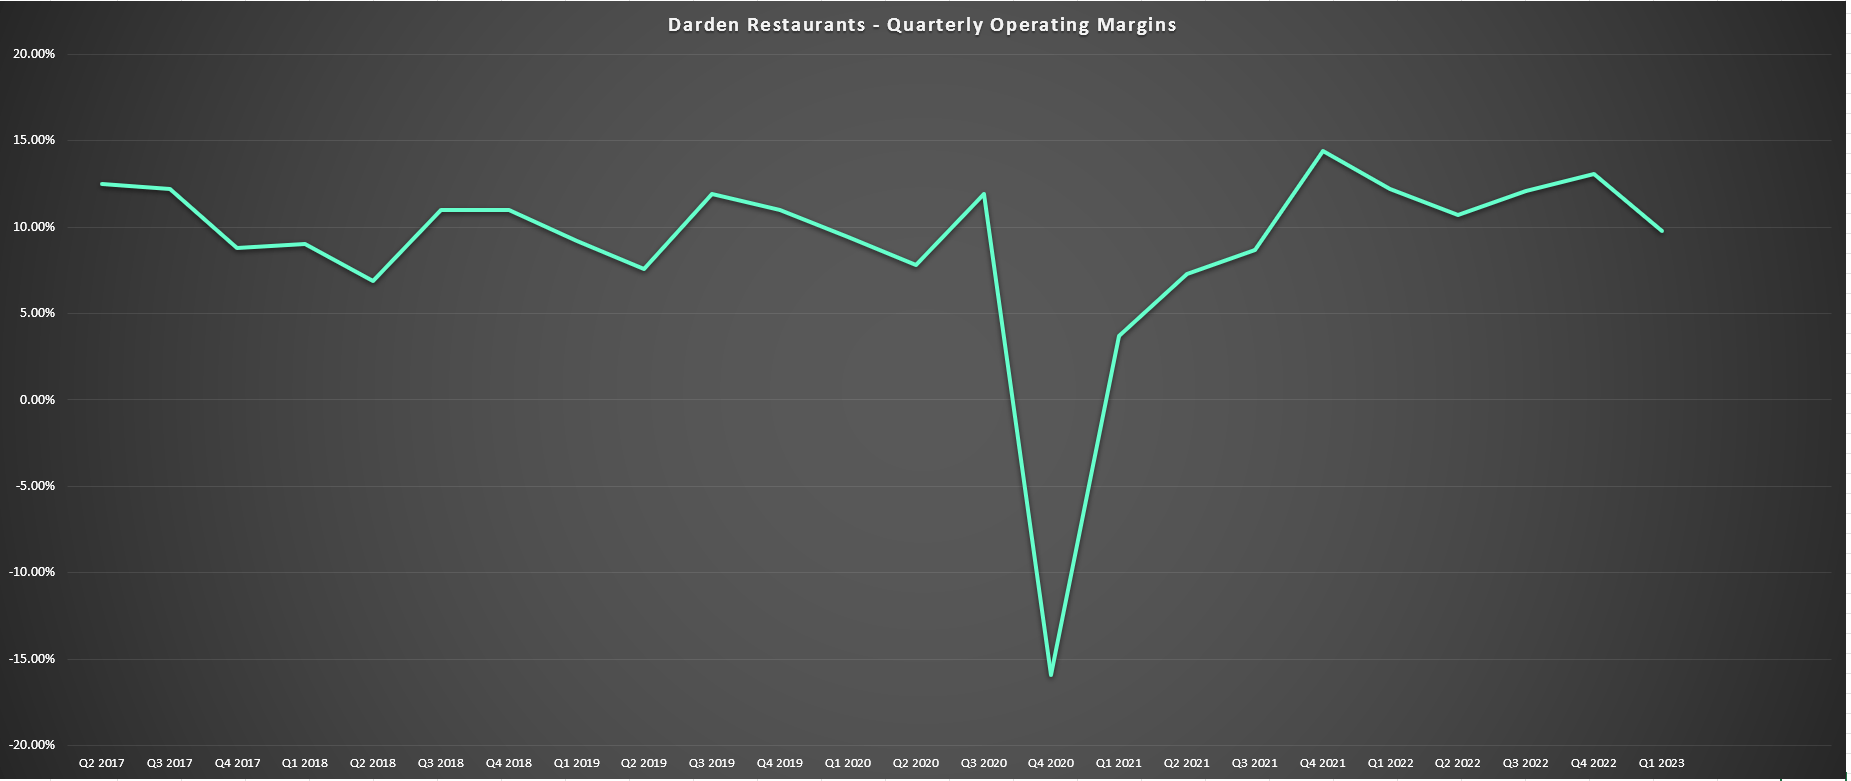
Darden – Operating Margins (Company Filings, Author’s Chart)
Unfortunately, while the sales performance was satisfactory across its other segments, inflationary pressures did bite margins. This was evidenced by food and beverage costs increasing to 32.5% (Q1 2022: 29.7%), labor costs up 50 basis points to 32.5%, and restaurant costs/marketing up 30 basis points to 17.7% (Q1 2022: 17.4%). These pressures were felt especially at Olive Garden, with exposure to cheese, chicken, and wheat that were up sharply in August even as wholesale food prices saw a slight sequential decline. During August, cheese was up 15.1%, and processed poultry was up 22.9% in the wholesale food price index.
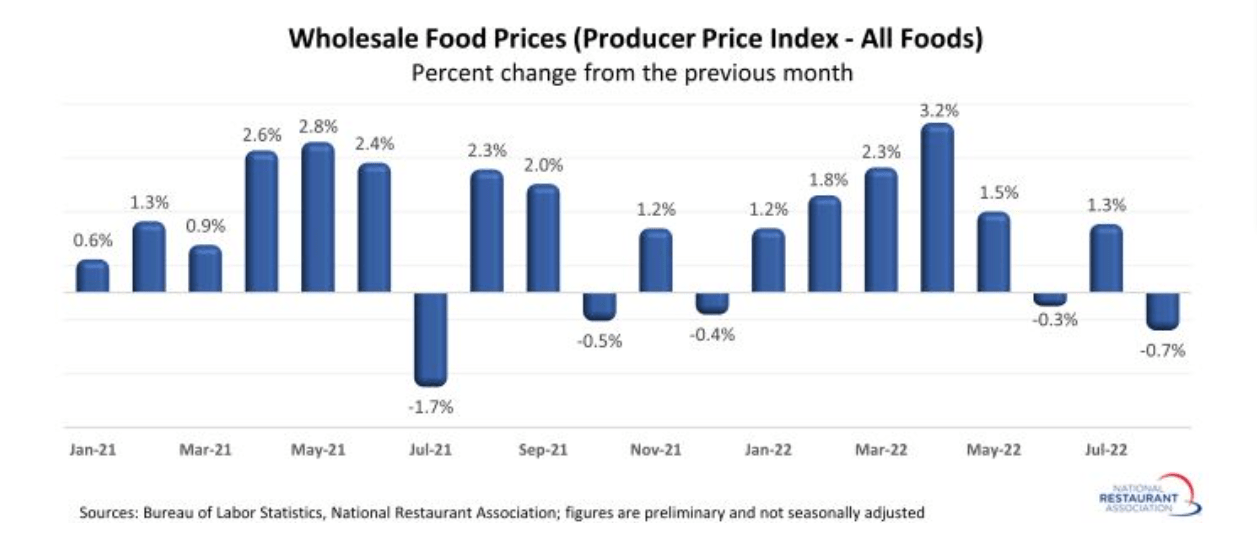
Wholesale Food Prices (National Restaurant Association, BLS)
While this decline in operating margins is disappointing, the good news is that Darden is feeling much of this pressure due to pricing very conservatively, and this could keep helping guest scores high. In fact, Olive Garden has increased costs by just 10% on a three-year basis, which is well below inflation, while some brands like Chipotle (CMG) are layering in price increase after price increase with seemingly little regard for what many consumers are facing currently. This greedy approach to not just hold the line on margins but expand margins at the expense of their loyal guest could potentially backfire.
So, while margins might be feeling some of this pressure due to below industry-average pricing relative to inflation (6.5% in Q1 vs. 9.5% inflation), the investment thesis for Darden is rock-solid, and it’s taking care of its guests. This is not the case for some brands that might be annoying their guests with above-average menu price increases, which could be a mistake long-term. Elsewhere in casual dining, some brands continue to have sub-par guest experiences due to lower-than-ideal staffing levels or untrained staff. Hence, investors should be happy with the guest score performance and the fact that Darden is doing well to manage profitability while keeping its guests happy as ever with food/service.
Industry-Wide Trends & Earnings Trend
While August was a much better month for the restaurant industry from a traffic standpoint, according to Black Box Intelligence (comp traffic down 1.9% vs. down 5.1% in July), this didn’t stop Darden from moving back to promotions at Olive Garden, bringing back the NeverEnding Pasta Bowl. This promotional move suggests that while traffic might have been strong in August, we may have seen a dip in September, which wouldn’t be surprising given that consumers are cash-strapped heading into the expensive holiday season.
In fact, personal savings rates have plunged to multi-year lows, so while lower gas prices might have prompted an extra visit in August to restaurants to ‘celebrate’ the win in this one area of high inflation, the reality is that many consumers may still be hesitant to dine out given their current financial situations. This should not be any surprise, given that consumers are being hit from all angles, including rising utility prices, rising grocery costs, rising mortgage costs, and elevated gas prices, even if they are off from their highs above $5.00/gallon.
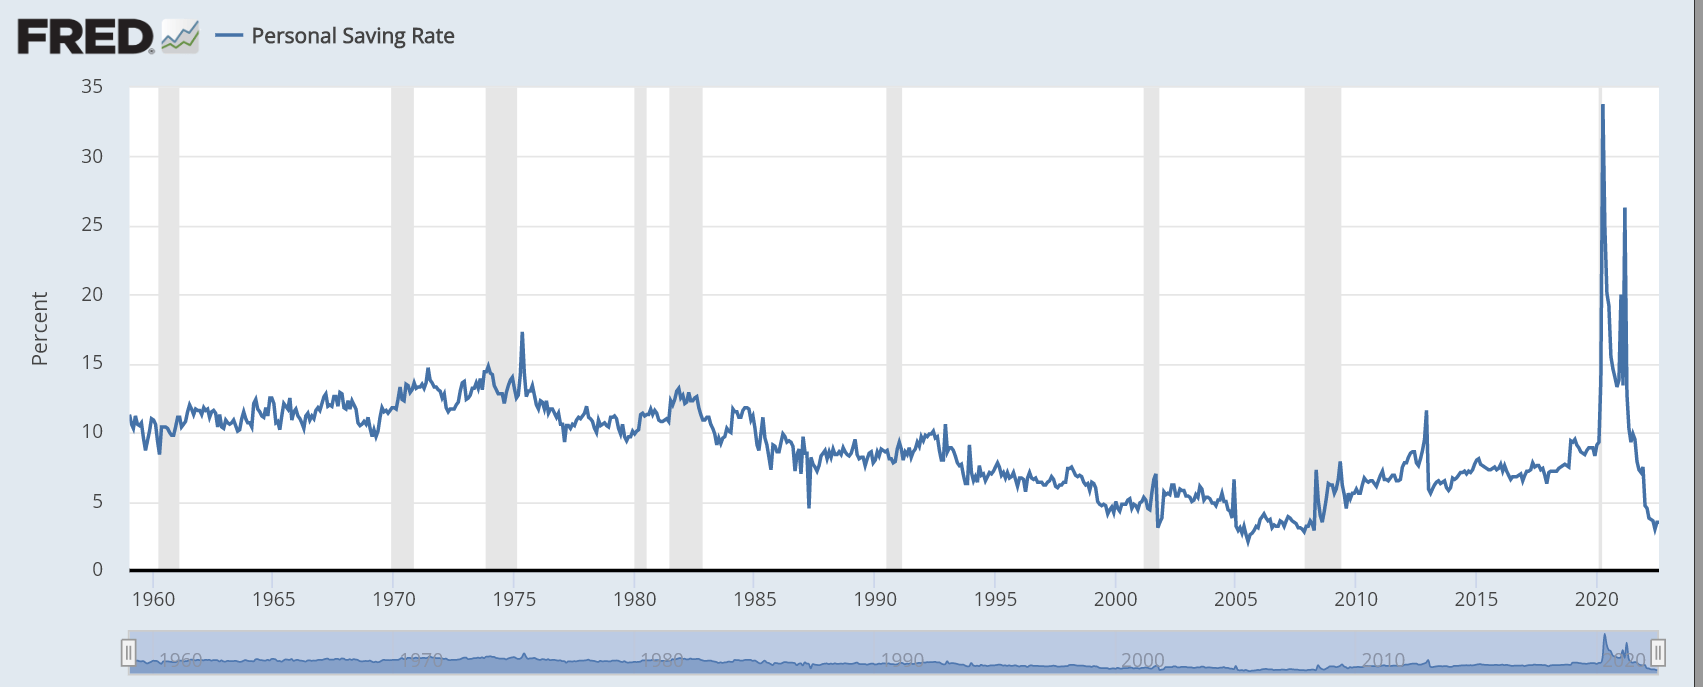
Personal Savings Rate (FRED, St. Louis Fed)
Finally, the one piece that doesn’t seem to be discussed is the complete reversal of the wealth effect. While dining out was guilt-free when investment accounts were enjoying double-digit annualized returns, housing prices remained robust, and crypto was enjoying triple-digit returns among Gen-Z consumers, this is not the case currently. Crypto has fallen off a cliff with some riskier coins demolished, investment account statements are coming back with red ink, and housing prices are now teetering. So, while this may not impact discretionary budgets, the average consumer is feeling a lot less rich, which could impact their hunger to spend and dine out regularly.
Overall, this paints a negative picture for the industry as a whole. That said, Darden is doing all the right things by pricing below inflation to maintain its value proposition and continues to focus on productivity to claw back margins, not doing so with aggressive price increases. So, while it has been a long winter for the industry, Darden could emerge as strong as ever from a customer appeal standpoint, which appears to be the case given its strong guest scores. Let’s look at Darden’s earnings trend below:
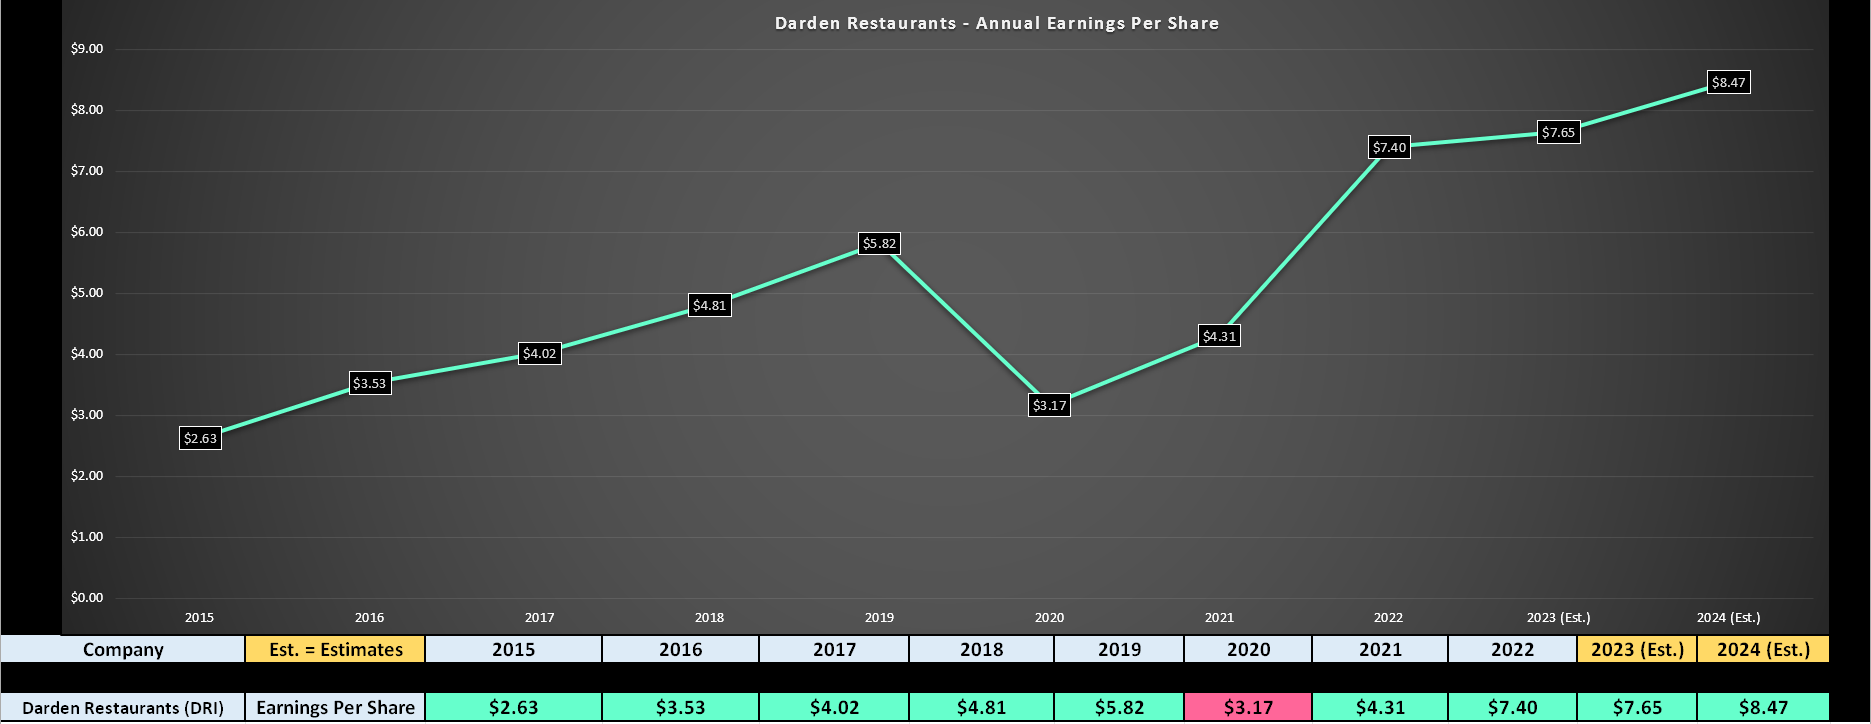
Darden – Earnings Trend (YCharts.com, Author’s Chart, FactSet)
Within the restaurant industry, Darden has sported one of the better compound annual earnings per share [EPS] growth rates since FY2014, with a CAGR of 14.7% (FY2014 to FY2022), despite wading through a global pandemic and inflationary headwinds. However, we are seeing a material deceleration in earnings in FY2023, with annual EPS expected to increase just over 3% year-over-year ($7.65 vs. $7.40). This can be attributed to the weaker industry-wide traffic trends, commodity/wage inflation, and Darden pricing well below inflation to ensure it maintains its value proposition in the market.
This deceleration in annual EPS growth is not a huge deal, and with inflation potentially moderating, the company should see a better year in FY2024, with annual EPS expected to hit a new all-time high. So, while it’s easy to be negative about the deceleration we’re seeing, this looks like a mere aberration for Darden in a long-term uptrend for earnings, and the company is managing well through the challenges. Unfortunately, this is not the case for some of its peers, with Shake Shack (SHAK) seeing a steep decline in margins and peers like Red Robin (RRGB) resorting to heavier discounting and continuing to post net losses per share.
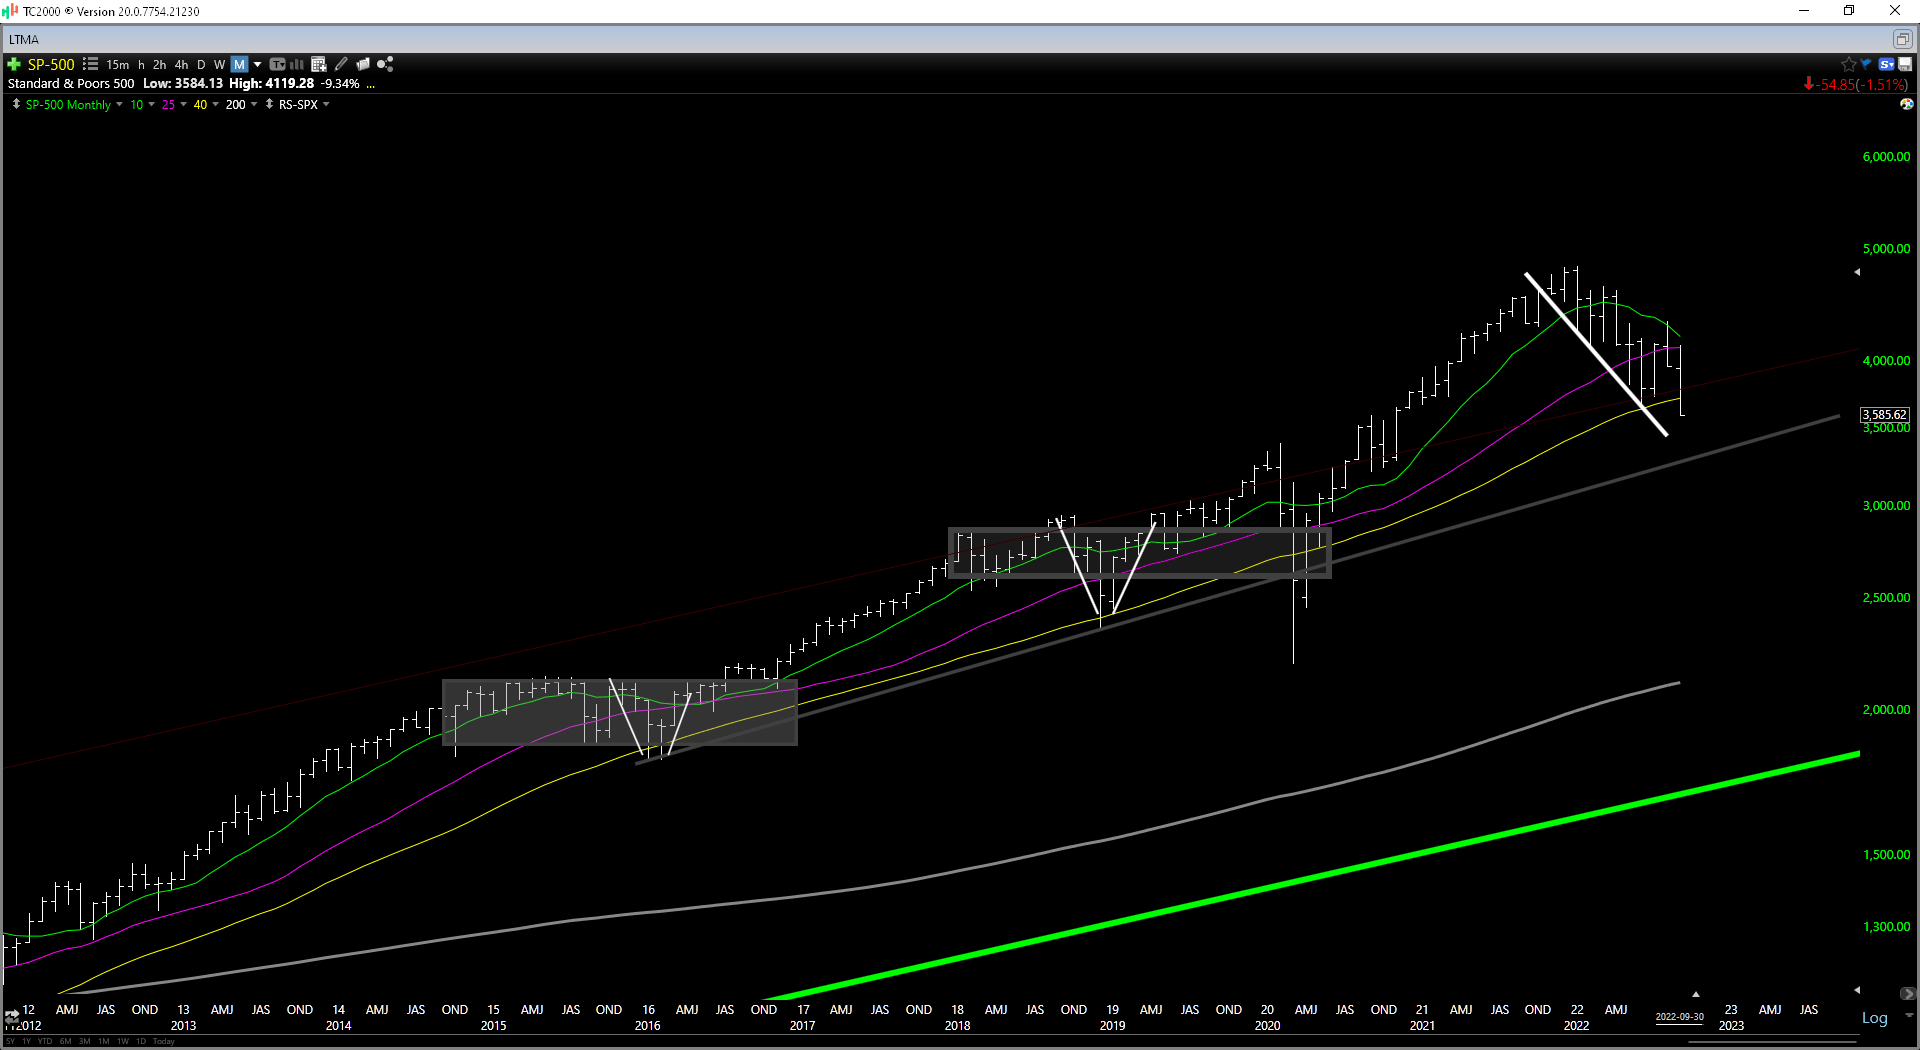
S&P-500 Weekly Chart (TC2000.com)
Hence, for investors looking for exposure to the restaurant space, Darden is one of the better houses in a bad neighborhood (industry group facing continued challenges), and its generous capital returns (buybacks + dividends) make it a solid buy-the-dip candidate. That said, the key is to buy at a deep discount to fair value in a cyclical bear market for the major indices (shown in the chart above with the market below all its key moving averages), and I still don’t see that at the current juncture. Let’s take a closer look at the valuation below:
Valuation
Darden has historically traded at an average earnings multiple of ~18.3 and ~21x earnings over the past decade. However, with the macro backdrop and operating environment being challenging (weaker consumers, inflationary pressures), I would argue that a more conservative multiple for the stock is 18.3, in line with the historical average and not the 10-year average, a much more favorable period for restaurants (low inflation rates, strong consumers). Based on an earnings multiple of 18.3 and FY2023 earnings estimates of $7.65, I see a fair value for the stock of $140.00. This points to only a 12% upside from current levels and not nearly enough margin of safety.
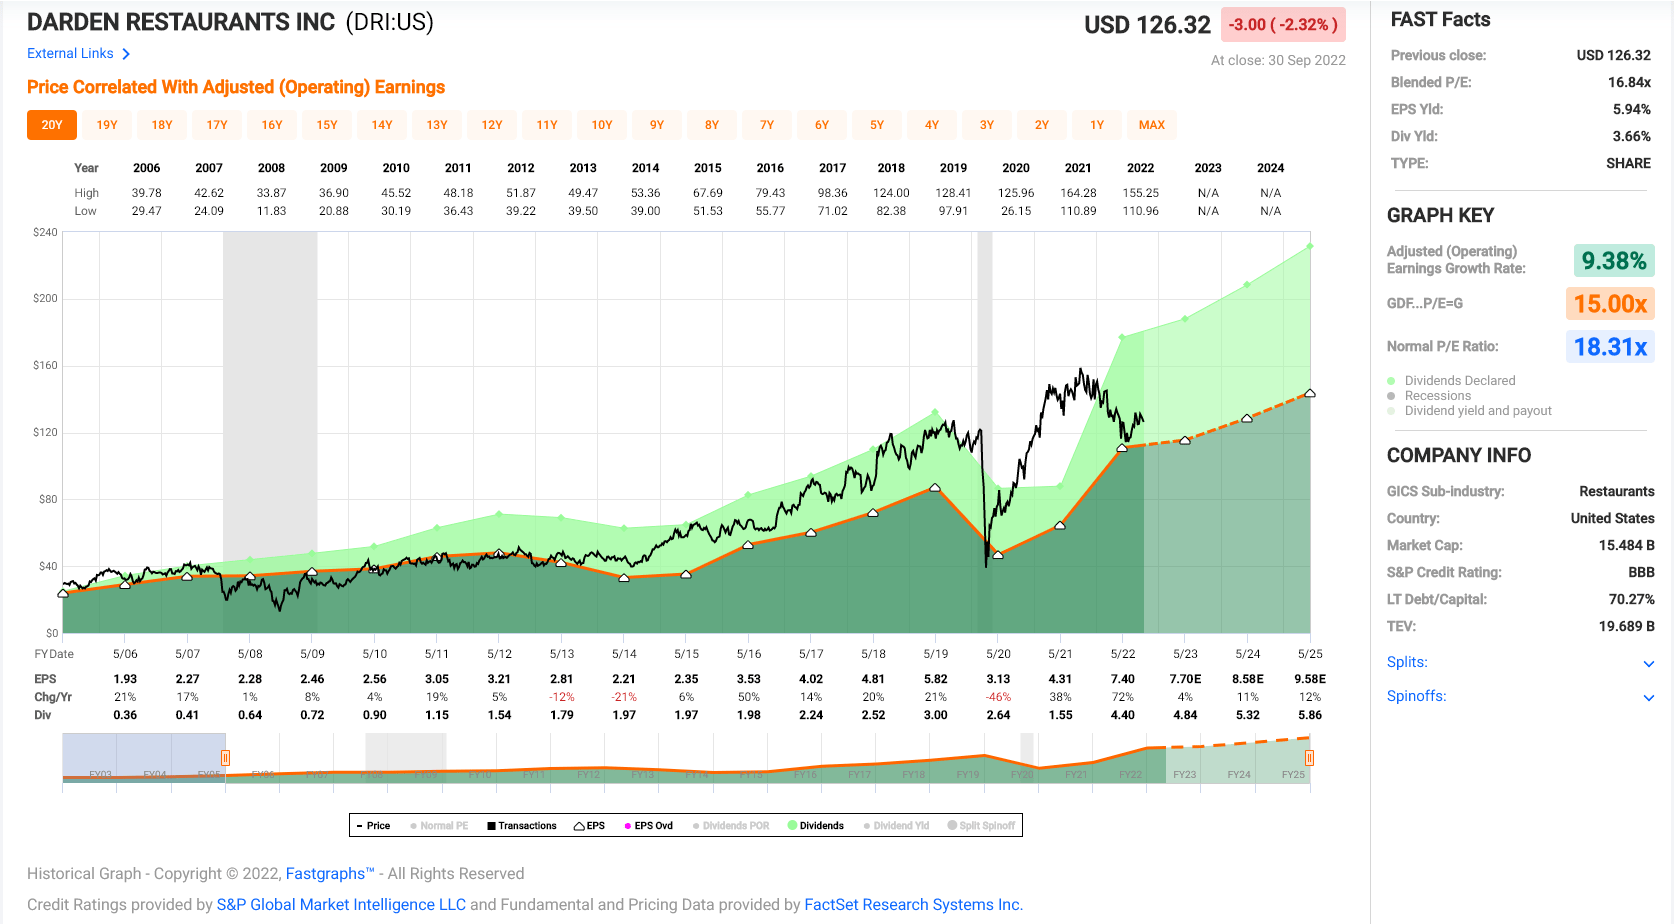
Darden – Historical Earnings Multiple (FASTGraphs.com)
In a cyclical bear market for the major indices, where stocks often overshoot to the downside, I prefer at least a 25% discount to fair value to bake in a margin of safety for large-cap stocks. Applying this to my conservative fair value for Darden of $140.00 points to a low-risk buy zone of $105.00 or lower. In Darden’s case, given its industry-leading dividend yield, the total return potential is slightly higher due to the attractive dividend yield, with a current annualized dividend of $4.84. However, even adding this figure to the low-risk buy zone, Darden would still need to drop below $109.80 to become attractive. Hence, it’s hard to make an argument for rushing into the stock here above $126.00.
Technical Picture
From a technical standpoint, the picture also suggests that patience is the best course of action. This is because if we look at the long-term chart, Darden has historically come down to test the mid-point of its 25-year channel (yellow line) in cyclical bear markets and come all the way down to the bottom rung of its channel in secular bear markets. While the major indices could evade a multi-year secular bear market depending on the Federal Reserve’s actions, we are clearly in a cyclical bear market, suggesting that DRI should test the $105.00 level at a bare minimum before finding its low for this current correction (where the mid-point currently lies).
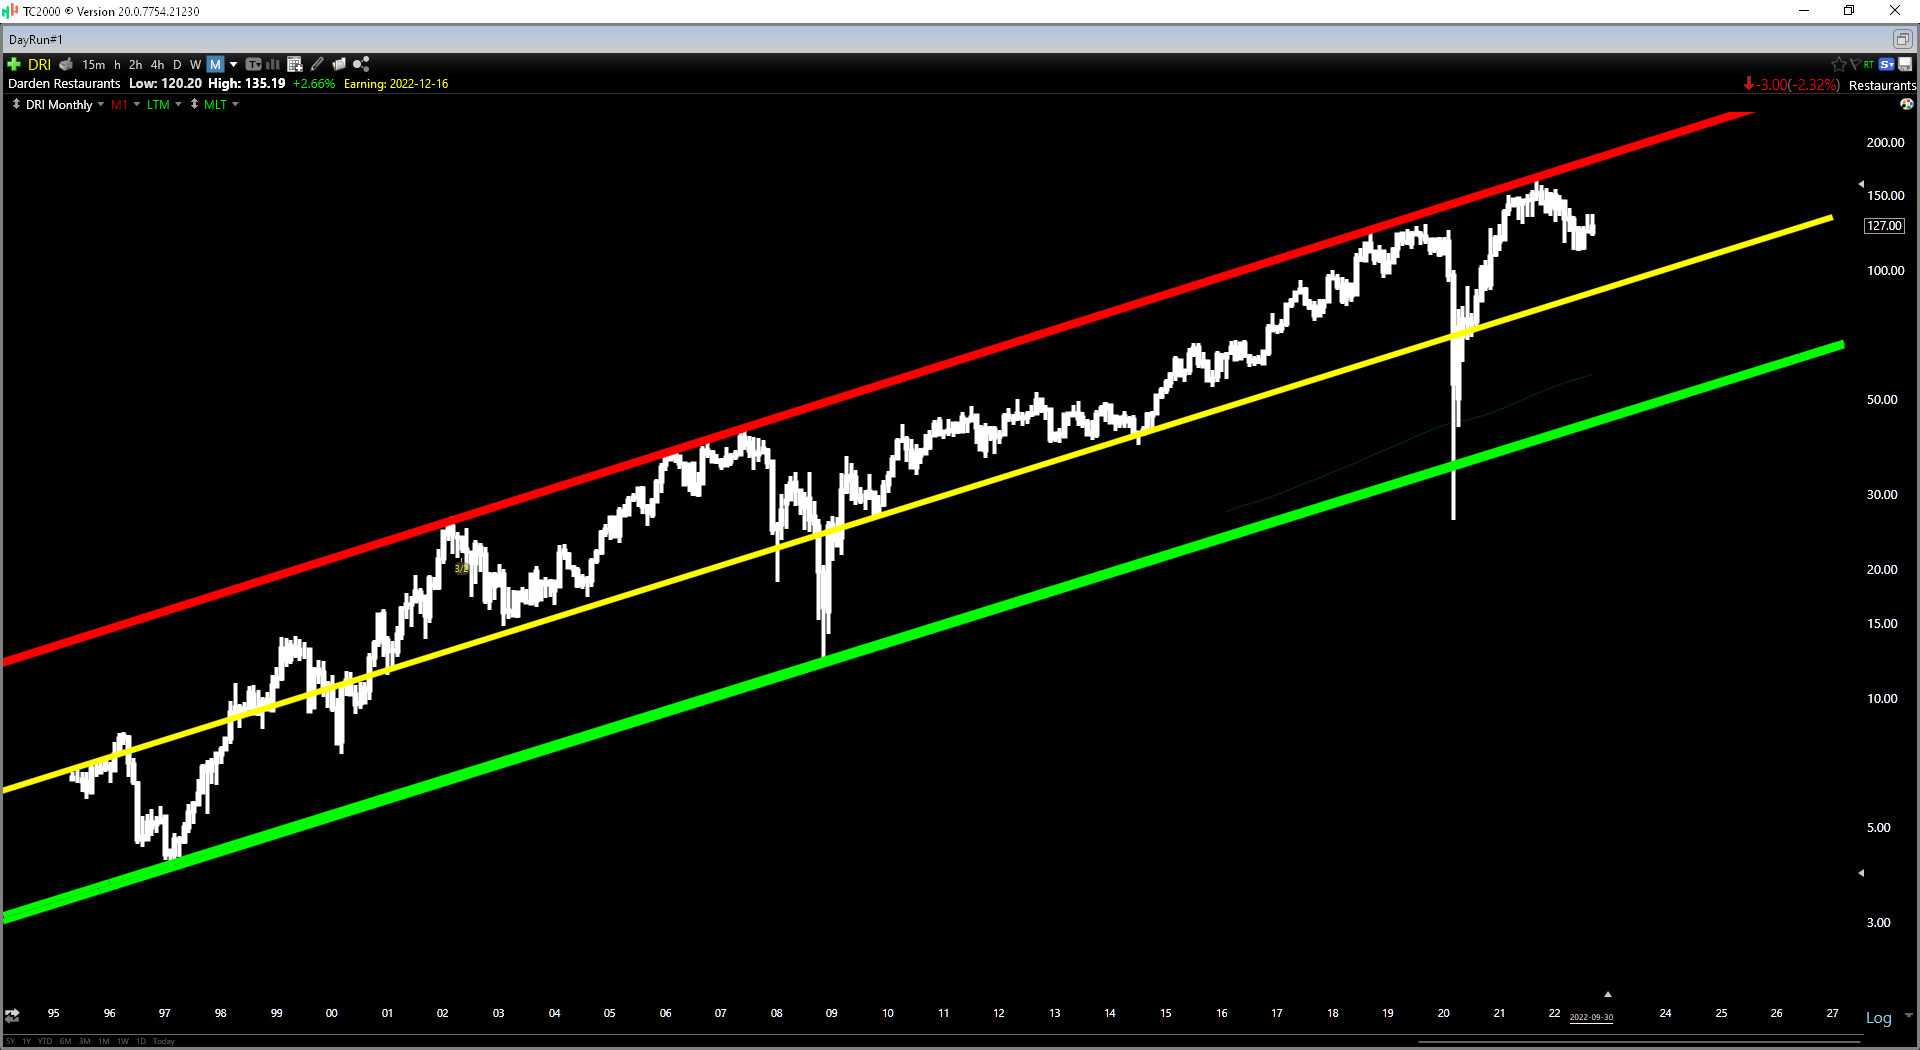
DRI – 25-Year Chart (TC2000.com)
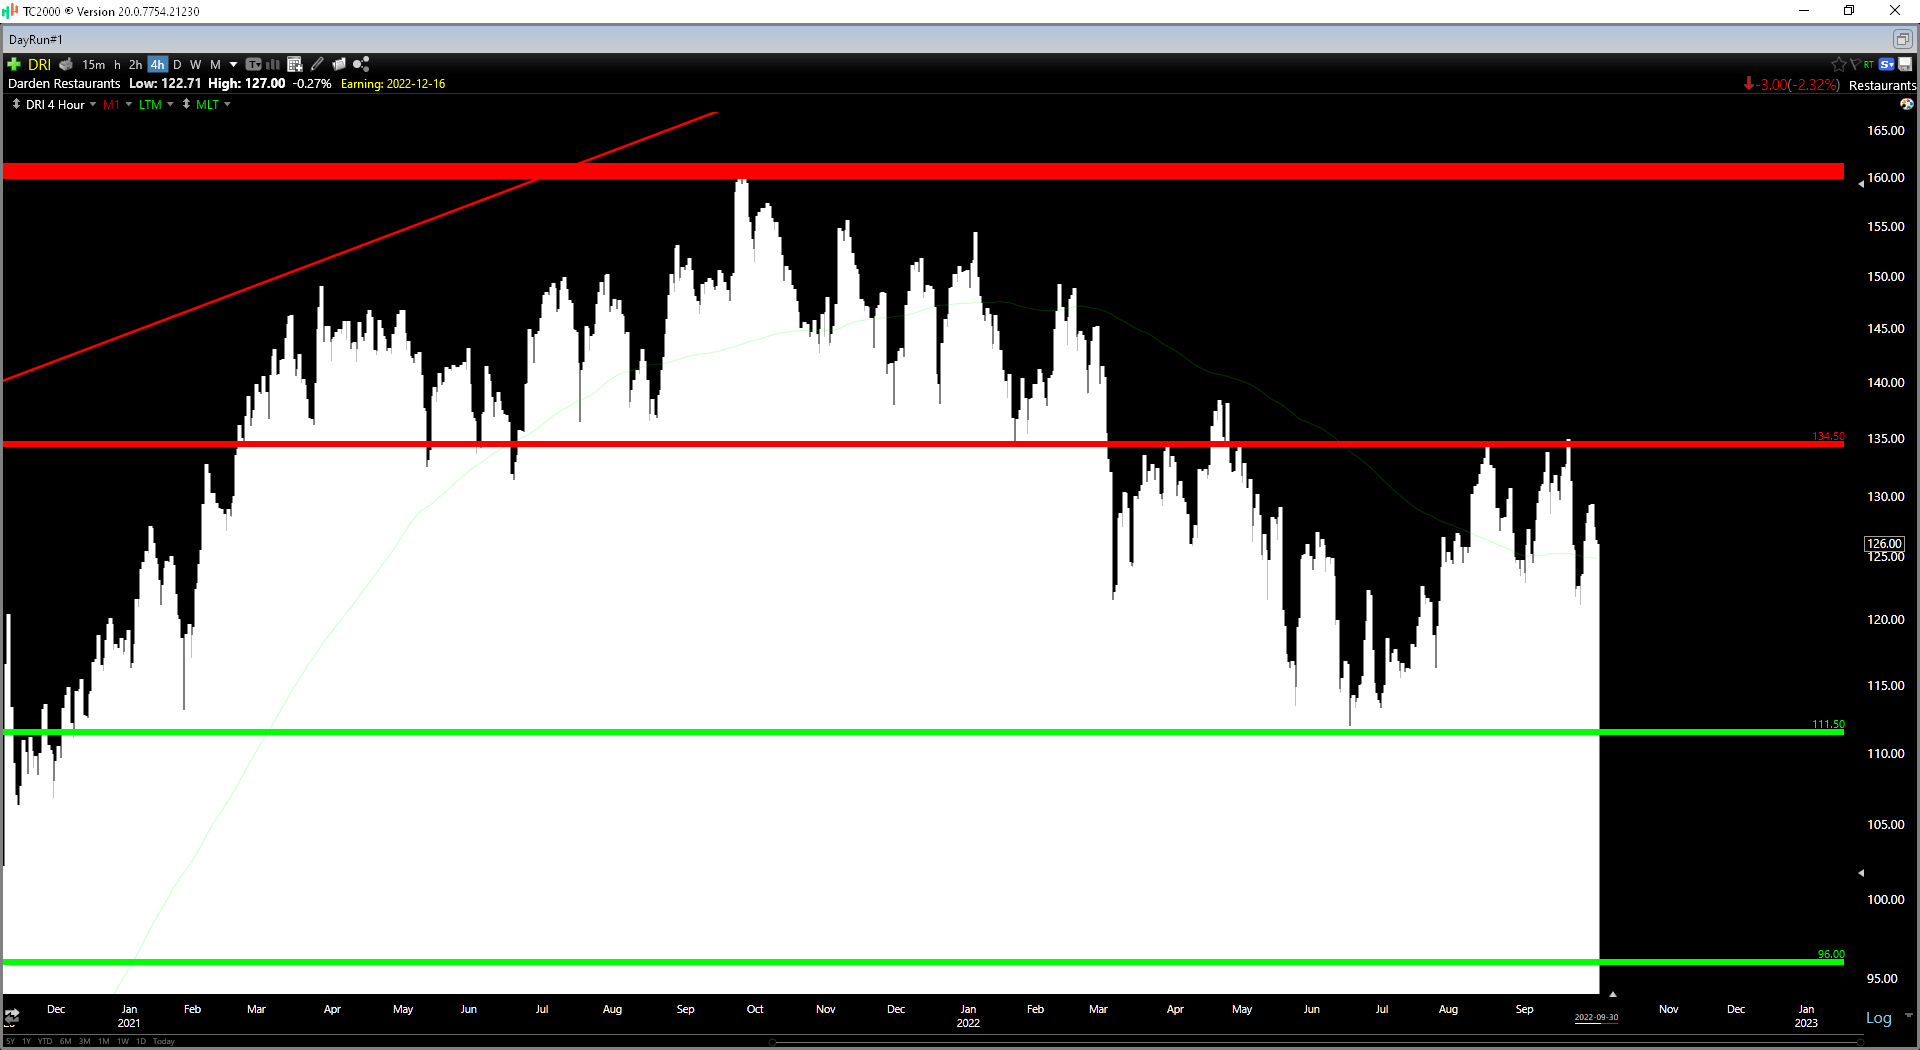
Darden – 2-Year Chart (TC2000.com)
Moving to the shorter-term outlook, DRI continues to have strong resistance at $134.50, and while it has a new upper support level at $111.50, we are currently sitting in the upper portion of this support/resistance range. In cyclical bear markets, I prefer to buy at support or on an undercut of support, assuming that a stock has an attractive valuation at this point. At $126.00, we are well above support and well above the buy-zone from a valuation standpoint of $109.80 (25% discount to conservative fair value).
Summary
Darden had a decent start to the year, given the challenging macro backdrop, but inflationary pressures have continued to weigh on margins, with limited annual EPS growth on deck this year. Judging by the recent return to NeverEnding Pasta, industry-wide traffic may have slowed a little in September, which doesn’t bode well for beating current FY2023 earnings estimates of $7.65. Given the risk of a miss and the fact that the market has been less forgiving with company misses, I believe patience is the best course of action. Hence, if I did want to own DRI, I would be waiting for a pullback below $110.00 at a bare minimum.
Be the first to comment