

Brett_Hondow
Normally, in a typical investment environment, an industry leader beating expectations for quarterly results when it comes to both revenue and profitability would result in that leader’s shares rising nicely. But if there’s anything that has been made abundantly clear, 2022 has not turned into a typical investment environment. Because of broader economic concerns, the performance of individual firms can even go overlooked and underappreciated. Such was the case on December 16th with restaurant giant Darden Restaurants (NYSE:DRI). Although the company’s operating history has been a bit lumpy, the overall trajectory for shareholders has been positive in recent years from a fundamental perspective. This year, rising costs have proven problematic for the enterprise. Ultimately, I suspect that a return to normalcy will come about. If shares were cheaper, I would find myself drawn in by the company. But considering that I am a value investor at heart, the stock isn’t quite cheap enough for me just yet.
Tasty results
Before the market opened on December 16th, the management team at Darden Restaurants announced financial results covering the second quarter of the company’s 2023 fiscal year. For those not acquainted, the company operates as one of the largest restaurant chains in the US. Its market capitalization is an impressive $17.48 billion. And the major chains under its belt include Olive Garden, LongHorn Steakhouse, Cheddar’s Scratch Kitchen, Yard House, The Capital Grille, Seasons 52, Bahama Breeze, Eddie V’s, and The Capital Burger. The overwhelming majority of these restaurants are owned and operated by the company. However, as of the end of its latest fiscal year, it had 60 locations that were franchised.
Author – SEC EDGAR Data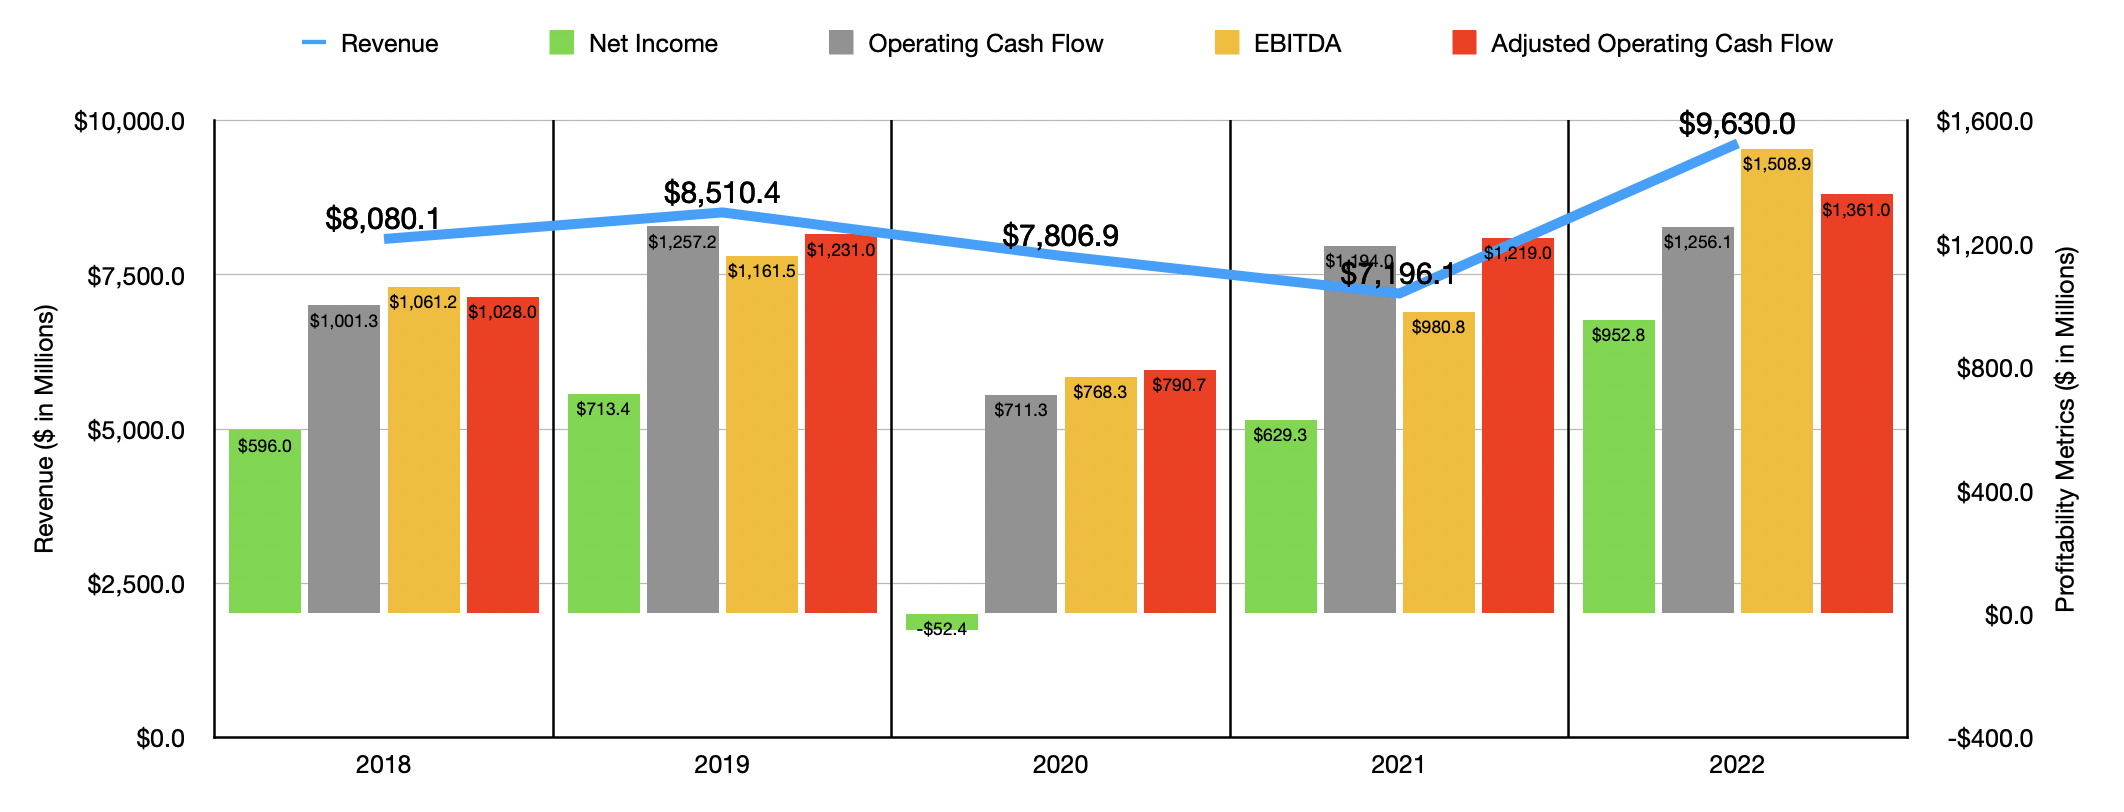
Over the past five years, the financial trajectory of the company has been a bit mixed but generally positive. As an example, revenue went from $8.08 billion in 2018 to $8.51 billion in 2019. In 2020, sales dropped to $7.81 billion in response to the COVID-19 pandemic. Sales continued to fall further in 2021, hitting just under $7.20 billion. Fortunately for investors, management has done well since then to post a recovery. During the 2022 fiscal year, revenue came in strong at $9.63 billion. This surge was driven by a couple of different factors. A more minor contributor seems to have been a rise in the number of locations in operation. For its company-owned restaurants, the number expanded from 1,834 to 1,867 year over year.
An even larger contributor, though, seems to have been a significant rise in same-restaurant sales. This number jumped by 24.1% at the Olive Garden locations and 28.1% for the LongHorn Steakhouse restaurants. The restaurants that fall under its fine dining operations reported a 62.7% surge in same-restaurant sales growth, while all of its other operations saw an improvement of 42.4%. The data varies from brand to brand. For instance, the Olive Garden brand reported a 4.4% increase in average check size. From LongHorn Steakhouse, the increase was 4.3%. Under the fine dining operations, this number is higher at 5.8%, while for all of the other locations the company has an operation this number was 9.3%. A larger contributor to the increase was undoubtedly the higher guest count it logged. At Olive Garden, this number surged by 18.9% compared to 22.8% for LongHorn Steakhouse. Under fine dining, the rise was 53.9%, while for the other operations it totaled 30.4%.
As you can imagine, profitability for the company has followed a similar trajectory. This much can be seen in the first chart in this article. Net income was the worst in 2022, coming in negative to the tune of $52.4 million. But beyond that, the picture has steadily improved over time. The same thing can be said of operating cash flow and EBITDA. In fact, the 2022 fiscal year resulted in all-time high financial performance for all of the company’s profitability metrics except for operating cash flow. But if we adjust for changes in working capital, even it would have hit an all-time high in 2022.
Author – SEC EDGAR Data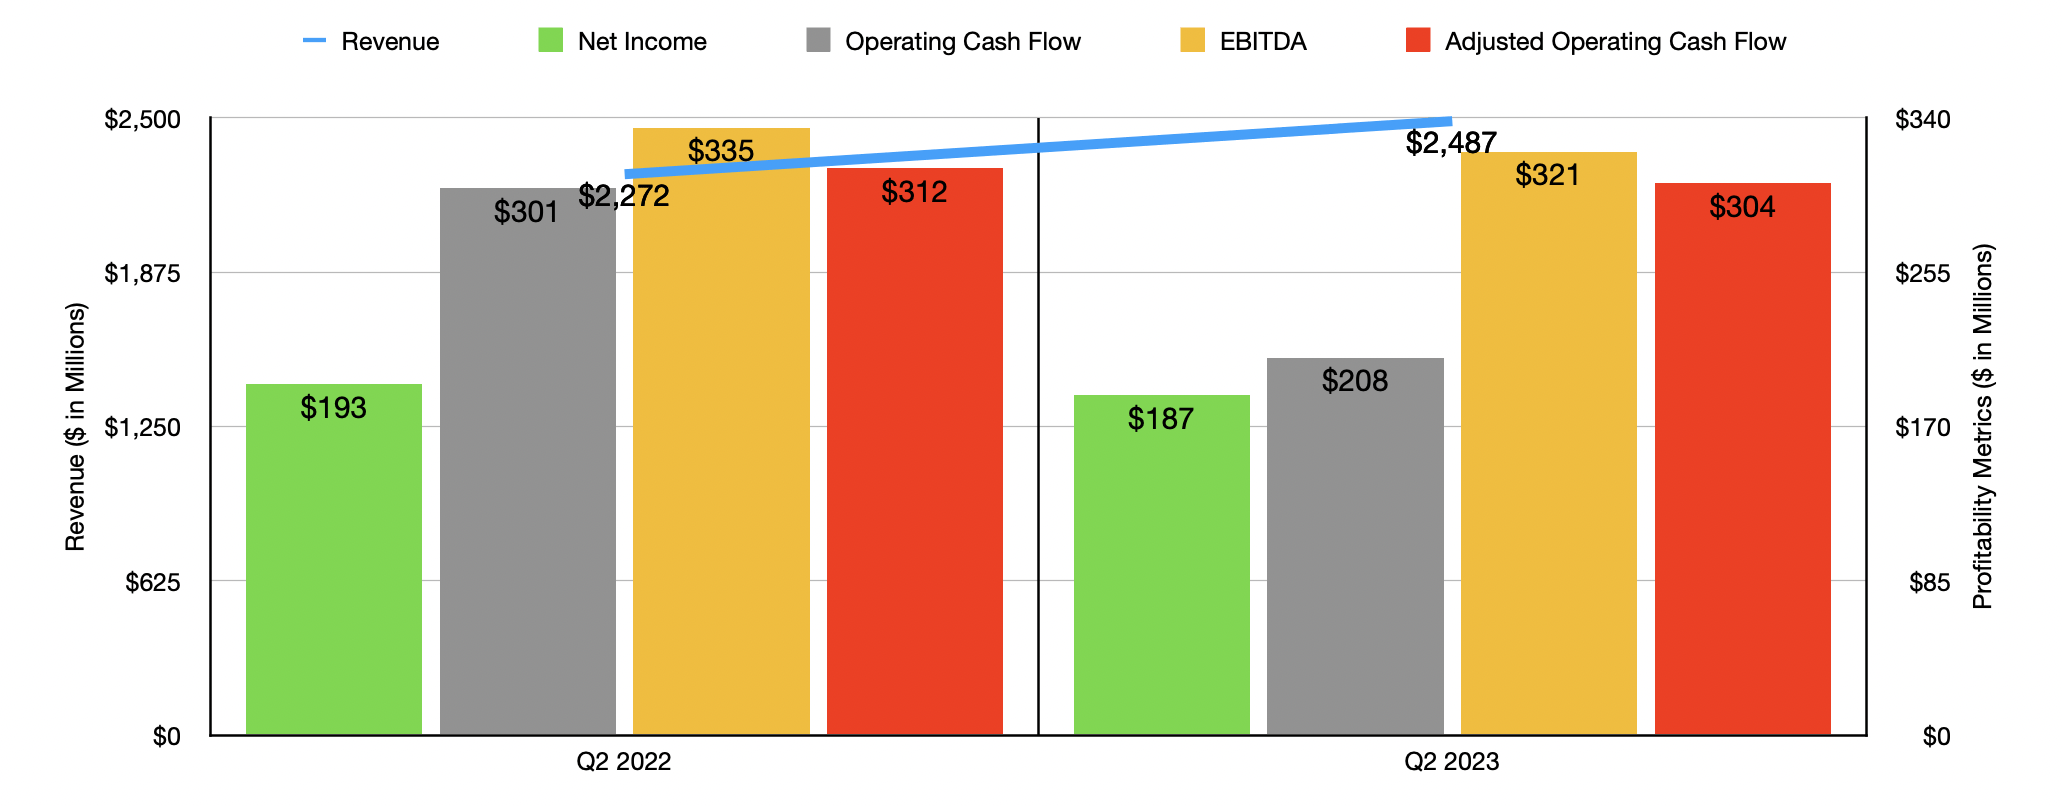
Naturally, this year has been a bit different. That much can be seen by looking at the company’s recent financial data. During the second quarter of its 2023 fiscal year, which the company just reported, sales came in quite strong, totaling $2.49 billion. In addition to beating out the $2.27 billion reported at the same time last year, it also came in higher than what analysts anticipated to the tune of $60 million. Overall same-restaurant sales for the company expanded by 7.3%, with the 7.6% experienced by the Olive Garden brand leading the way. The company also benefited from 35 net new restaurants in its portfolio.
On the bottom line though, the picture has worsened some. Overall net income for the latest quarter came in at $187.2 million. That’s actually down from the $193.2 million reported the same time last year. Despite sales rising nicely, the company was negatively impacted by higher expenses. The pain came across one key category. Food and beverage costs rose from 30.5% of sales to 32.9%. Other cost categories improved year-over-year. For instance, restaurant labor costs decreased from 32.8% To 32.5%, while other restaurant costs dropped from 16.9% of sales to 16.8%. Although net income did post signs of weakness, actual earnings per share for the company rose from $1.48 last year to $1.52 this year. This actually resulted in earnings beating expectations by $0.08 per share. This was driven by a significant decline in share count from 130.5 million shares to 123.1 million. In the third quarter alone, management allocated $100 million toward share buybacks. As a result of these higher food and beverage costs, items that were severely impacted by inflation, other profitability metrics worsened year over year. Operating cash flow declined from $301.2 million to $207.8 million. If we adjust for changes in working capital, it still would have fallen, declining from $312.2 million to $303.9 million. And over that same window of time, even EBITDA took a hit, dropping from $334.7 million to $321.2 million. In the chart below, you can see that the results achieved in the second quarter alone look very similar to the results, year over year, for the first half of the year in its entirety. The one notable exception is operating cash flow.
Author – SEC EDGAR Data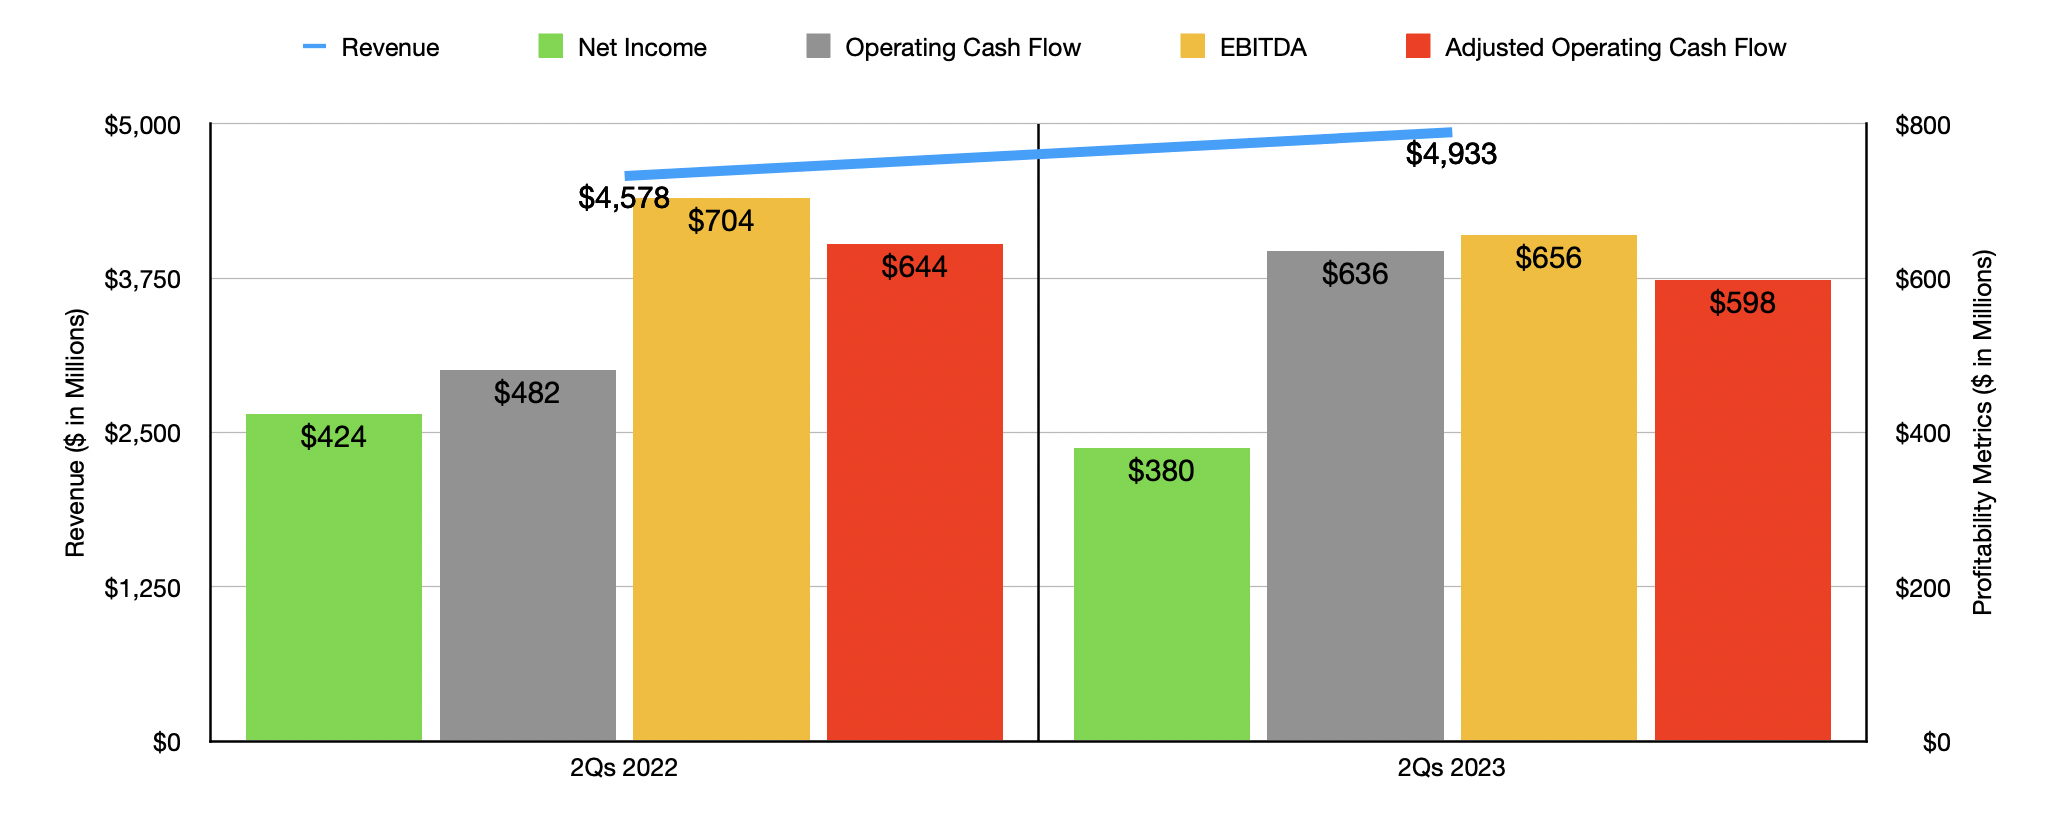
When it comes to 2023 as a whole, management did manage to increase guidance for the year. Revenue should now be between $10.30 billion and $10.45 billion. The prior expected range was for between $10.20 billion and $10.40 billion. The company is still forecasting 55 to 60 new restaurants for the year. The real driver of the increase, then, relative to prior guidance, comes from same-restaurant sales. For this year, they are now forecasted to grow by between 5% and 6.5%. Previously, the range was for between 4% and 6%. Despite the inflationary pressures the company has experienced, earnings per share should now be between $7.60 and $8. By comparison, the number previously was between $7.40 and $8. But from a pure dollar perspective, profits should only come in slightly higher than previously anticipated, with midpoint expectations for earnings of $959.4 million compared to the $954.8 million previously anticipated. Much of this improvement from a per share basis, then, was not because of higher profitability, but instead was driven by the expectation that total share count for the company should be lower than what management previously forecasted.
Author – SEC EDGAR Data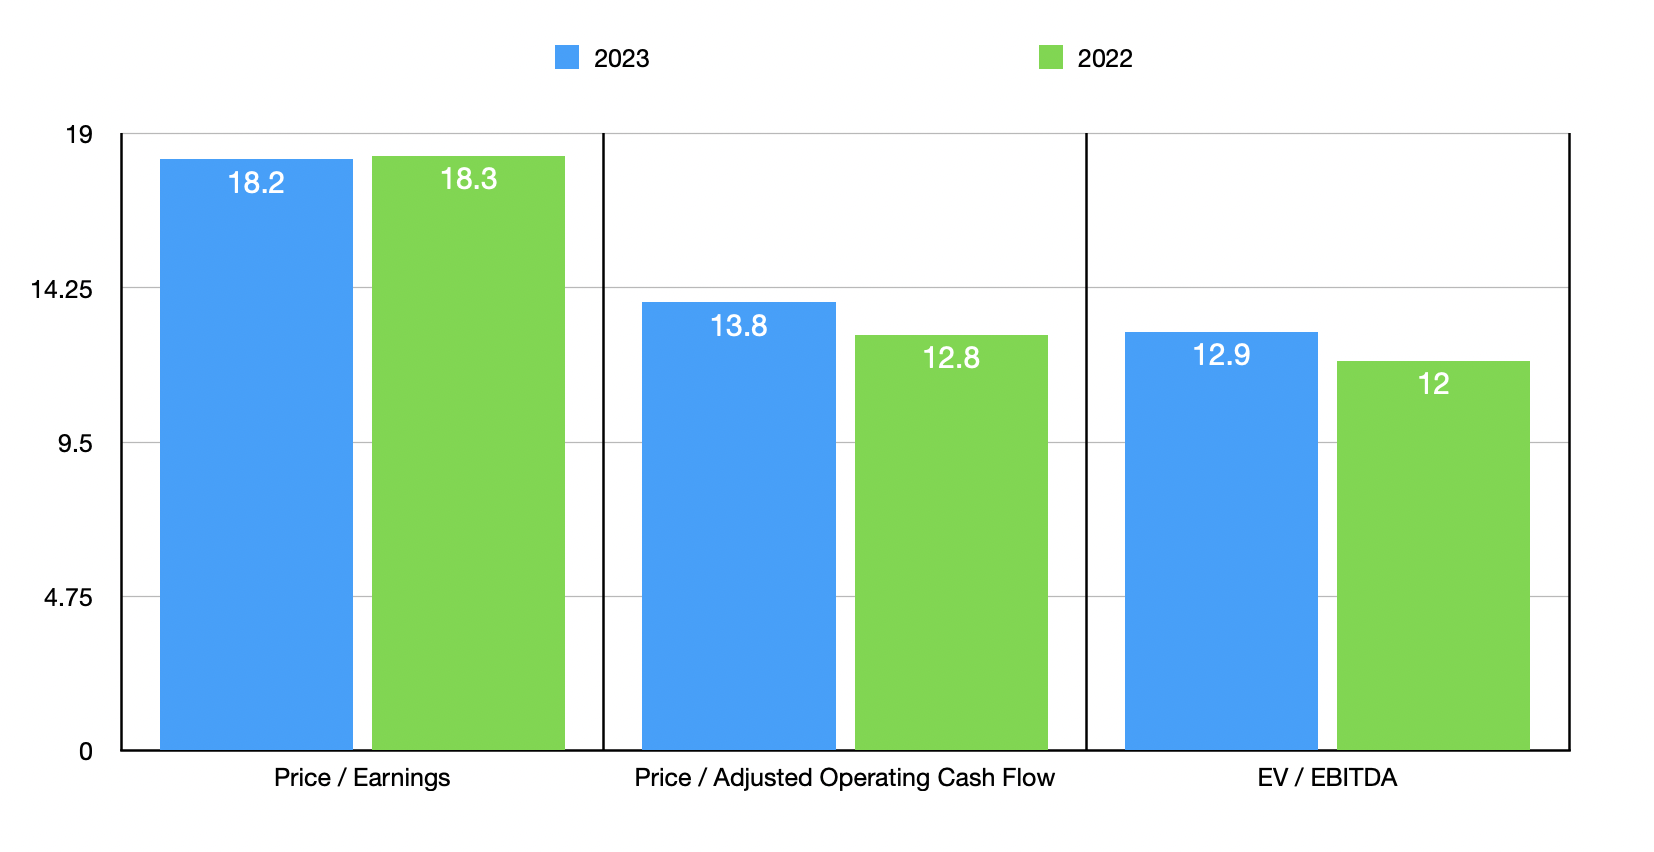
Management did not provide any guidance when it came to other profitability metrics. But if we annualized results experienced so far, we would get adjusted operating cash flow of $1.26 billion and EBITDA of $1.41 billion. As a result, the company is trading at a forward price to earnings multiple of 18.2, a forward price to adjusted operating cash flow multiple of 13.8, and a forward EV to EBITDA multiple of 12.9. In the chart above, you can see how this data stacks up against pricing if we were to use results from 2022. In the table below, meanwhile, you can see how the company is priced against five similar firms. On a price-to-earnings basis, only one of the five companies was cheaper than our prospect. Using the price to operating cash flow approach, Darden Restaurants was actually the most expensive of the group. And when it comes to an EV to EBITDA approach, three of the five were cheaper than our target. This meaningful disparity is a further testament to the volatility in this space from a profitability versus cash flow perspective.
| Company | Price / Earnings | Price / Operating Cash Flow | EV / EBITDA |
| Darden Restaurants | 18.2 | 13.8 | 12.9 |
| Texas Roadhouse (TXRH) | 24.8 | 12.7 | 14.5 |
| Bloomin’ Brands (BLMN) | 21.9 | 5.1 | 7.2 |
| The Cheesecake Factory (CAKE) | 34.3 | 8.5 | 14.3 |
| Dine Brands Global (DIN) | 12.4 | 9.3 | 9.2 |
| Brinker International (EAT) | 21.0 | 6.4 | 9.1 |
Takeaway
Based on the data we have at our disposal, I do believe that the long-term trajectory for Darden Restaurants will be positive. Clearly, the current fiscal year is proving to be a bit difficult from a profitability perspective. But even in that case, the situation looks far from horrible. Management continues to buy back stock, sales continue to climb in response to both price increases and a rise in the number of customers visiting its restaurants. Management also continues to add additional stores to its portfolio. None of this implies paying for shareholders in the long run. If the stock were cheaper or if financial data were a little more robust, I would find it rather appealing. But all things considered, I think that it makes for a solid ‘hold’ at this time, reflecting my belief that share price performance should more or less match the broader market’s performance for the foreseeable future.
Be the first to comment