

yorkfoto/E+ via Getty Images
Earnings of CVB Financial Corp. (NASDAQ:CVBF) will significantly benefit from rising interest rates as the deposit cost is highly sticky. Further, California’s economic activity will likely sustain loan growth, which will provide some support to the bottom line. Overall, I’m expecting CVB Financial to report earnings of $1.58 per share for 2022, up 1% year-over-year. For 2023, I’m expecting earnings to surge by 23% to $1.93 per share. The year-end target price suggests a sizable downside from the current market price. Based on the total expected return, I’m adopting a hold rating on CVB Financial.
Deposit Costs to Remain Unaffected by Rising Interest Rates
CVB Financial Corp’s deposit cost is very sticky because the deposit book is heavy on non-interest-bearing deposits. These deposits made up a massive 63% of total deposits at the end of June 2022. It is therefore no surprise that the deposit costs increased by only one basis point during the second quarter of the year as the federal funds rate increased by 125 basis points. During the last rate up-cycle as well the deposit costs remained quite sticky. The management mentioned in the latest conference call that the cost of funds increased by only eight basis points during the last rate cycle when short-term rates grew by 225 basis points.
Meanwhile, loans will take some time to reprice due to the presence of some fixed-rate loans. The results of the management’s interest-rate sensitivity analysis given in the 10-Q filing show that a 200-basis points hike in interest rates can boost the net interest income by 5.46% during the first year, and 9.93% during the first two years of the rate hike.
2Q 2022 10-Q Filing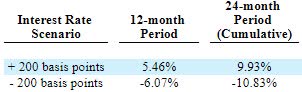
Considering these factors, I’m expecting the margin to grow by 25 basis points in the second half of 2022 and 30 basis points in 2023.
California’s Economy to Play a Key Role in Loan Growth
CVB Financial Corp’s loan portfolio grew by 1.1% during the second quarter of 2022, taking the first half’s loan growth to 10.1%. The growth in the first half of the year was mostly attributable to the acquisition of Suncrest Bank. The company has historically relied on acquisitions for growth. These acquisitions include not just whole banks but also banking teams. Apart from acquired growth, CVB Financial Corp’s loan growth has remained lackluster. I’m expecting organic growth to continue to remain low in future quarters.
High borrowing costs will further hurt the loan growth outlook. On the other hand, strong economic activity bodes well for credit demand in CVB Financial Corp’s markets. The company has locations all over California, with a majority clustered in Los Angeles. As shown below, the trend line for California’s coincident economic activity index is now steeper than before the pandemic.
Federal Reserve Bank of Philadelphia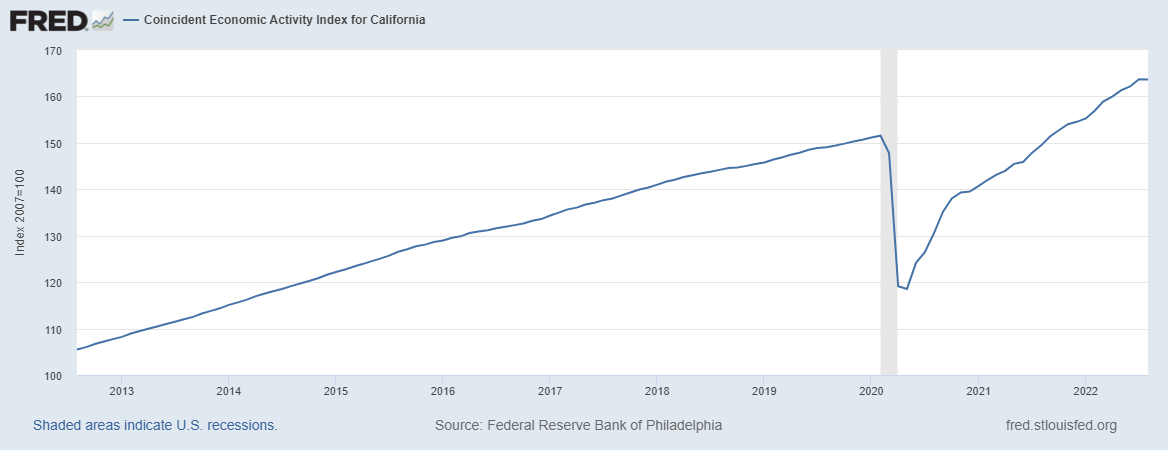
A rising tide can lift all boats. Therefore, I believe California’s rapidly improving economic activity can sustain CVB Financial Corp’s loan growth even though the management has historically not been too successful in achieving organic growth.
Overall, I’m expecting loan growth to dip from the second quarter’s level to 0.75% every quarter till the end of 2023.
Expecting Earnings to be Flattish this Year Before Surging Next Year
The anticipated margin expansion will be the chief driver of earnings in the next year and a half. Subdued loan growth will likely provide further support to the bottom line.
On the other hand, the provisioning will likely be a bit high as it was unusually elevated during the first half of the year. Non-performing loans were 0.21% while allowances were 0.92% of total loans at the end of June 2022. As a result, I’m satisfied with the existing reserves relative to the portfolio’s credit risk. Further, the management uses the GDP, unemployment rate, and commercial real estate price in the index to determine its provisioning for expected loan losses, as mentioned in the latest earnings presentation. As the market’s view on GDP and unemployment rate hasn’t changed much over this quarter, I’m not expecting these economic variables to significantly push up provisions. Instead, I’m expecting loan additions to be the primary driver of provisioning through the end of 2023. Overall, I’m expecting the provisioning to decline from the second quarter’s level but remain at an above-average level.
Considering these factors, I’m expecting CVB Financial Corp. to report earnings of $1.58 per share for 2022, up by just 1% year-over-year. For 2023, I’m expecting earnings to grow by 23% to $1.93 per share. The following table shows my income statement estimates.
| FY18 | FY19 | FY20 | FY21 | FY22E | FY23E | |||||
| Income Statement | ||||||||||
| Net interest income | 349 | 436 | 416 | 415 | 493 | 575 | ||||
| Provision for loan losses | 2 | 5 | 24 | (26) | 11 | 10 | ||||
| Non-interest income | 43 | 59 | 50 | 47 | 51 | 51 | ||||
| Non-interest expense | 180 | 199 | 193 | 190 | 222 | 232 | ||||
| Net income – Common Sh. | 152 | 207 | 177 | 212 | 223 | 271 | ||||
| EPS – Diluted ($) | 1.24 | 1.48 | 1.30 | 1.56 | 1.58 | 1.93 | ||||
|
Source: SEC Filings, Earnings Releases, Author’s Estimates (In USD million unless otherwise specified) |
||||||||||
Actual earnings may differ materially from estimates because of the risks and uncertainties related to inflation, and consequently the timing and magnitude of interest rate hikes. Further, a stronger or longer-than-anticipated recession can increase the provisioning for expected loan losses beyond my estimates.
Equity Book Value to Suffer from High Interest Rates
CVB Financial has a large balance of available-for-sale (“AFS”) securities, which made up 24% of total earning assets at the end of June 2022. As interest rates increase, the market value of AFS fixed-rate securities will fall leading to unrealized losses. These losses will skip the income statement and flow directly to the equity book value account. As a result of accumulated unrealized losses in the first half of the year, the tangible book value per share has already fallen from $10.3 at the end of December 2021 to $8.5 at the end of June 2022.
Further erosion is likely in the coming quarters as the Federal Reserve is projecting a further 125 to 150 basis points hike in the fed funds rate till the end of 2023. On the other hand, retained earnings will lift the equity book value. The following table shows my balance sheet estimates.
| FY18 | FY19 | FY20 | FY21 | FY22E | FY23E | |
| Financial Position | ||||||
| Net Loans | 7,701 | 7,496 | 8,255 | 7,823 | 8,742 | 9,007 |
| Growth of Net Loans | 61.4% | (2.7)% | 10.1% | (5.2)% | 11.7% | 3.0% |
| Other Earning Assets | 2,506 | 2,445 | 4,857 | 6,778 | 6,668 | 6,871 |
| Deposits | 8,827 | 8,705 | 11,737 | 12,976 | 14,284 | 14,717 |
| Borrowings and Sub-Debt | 768 | 477 | 530 | 695 | 592 | 610 |
| Common equity | 1,851 | 1,994 | 2,008 | 2,082 | 2,045 | 2,204 |
| Book Value Per Share ($) | 15.2 | 14.3 | 14.7 | 15.4 | 14.6 | 15.7 |
| Tangible BVPS ($) | 9.3 | 9.2 | 9.6 | 10.3 | 9.0 | 10.1 |
|
Source: SEC Filings, Author’s Estimates (In USD million unless otherwise specified) |
Adopting a Hold Rating
CVB Financial is offering a dividend yield of 3.1% at the current quarterly dividend rate of $0.20 per share. The earnings and dividend estimates suggest a payout ratio of 41% for 2022, which is below the five-year average of 51%. Therefore, there is room for a dividend hike. To remain on the safe side, I’m assuming no change in the dividend level for my investment thesis.
I’m using the historical price-to-tangible book (“P/TB”) and price-to-earnings (“P/E”) multiples to value CVB Financial. The stock has traded at an average P/TB ratio of 2.20x in the past, as shown below.
| FY18 | FY19 | FY20 | FY21 | Average | ||
| T. Book Value per Share ($) | 9.3 | 9.2 | 9.6 | 10.3 | ||
| Average Market Price ($) | 23.0 | 21.3 | 19.0 | 20.9 | ||
| Historical P/TB | 2.48x | 2.32x | 1.97x | 2.03x | 2.20x | |
| Source: Company Financials, Yahoo Finance, Author’s Estimates | ||||||
Multiplying the average P/TB multiple with the forecast tangible book value per share of $9.0 gives a target price of $19.7 for the end of 2022. This price target implies a 24.4% downside from the October 7 closing price. The following table shows the sensitivity of the target price to the P/TB ratio.
| P/TB Multiple | 2.00x | 2.10x | 2.20x | 2.30x | 2.40x |
| TBVPS – Dec 2022 ($) | 9.0 | 9.0 | 9.0 | 9.0 | 9.0 |
| Target Price ($) | 17.9 | 18.8 | 19.7 | 20.6 | 21.5 |
| Market Price ($) | 26.1 | 26.1 | 26.1 | 26.1 | 26.1 |
| Upside/(Downside) | (31.3)% | (27.9)% | (24.4)% | (21.0)% | (17.6)% |
| Source: Author’s Estimates |
The stock has traded at an average P/E ratio of around 15.2x in the past, as shown below.
| FY18 | FY19 | FY20 | FY21 | Average | ||
| Earnings per Share ($) | 1.24 | 1.48 | 1.30 | 1.56 | ||
| Average Market Price ($) | 23.0 | 21.3 | 19.0 | 20.9 | ||
| Historical P/E | 18.5x | 14.4x | 14.6x | 13.4x | 15.2x | |
| Source: Company Financials, Yahoo Finance, Author’s Estimates | ||||||
Multiplying the average P/E multiple with the forecast earnings per share of $1.58 gives a target price of $24.0 for the end of 2022. This price target implies a 7.8% downside from the October 7 closing price. The following table shows the sensitivity of the target price to the P/E ratio.
| P/E Multiple | 13.2x | 14.2x | 15.2x | 16.2x | 17.2x |
| EPS 2022 ($) | 1.58 | 1.58 | 1.58 | 1.58 | 1.58 |
| Target Price ($) | 20.9 | 22.4 | 24.0 | 25.6 | 27.2 |
| Market Price ($) | 26.1 | 26.1 | 26.1 | 26.1 | 26.1 |
| Upside/(Downside) | (19.9)% | (13.9)% | (7.8)% | (1.7)% | 4.3% |
| Source: Author’s Estimates |
Equally weighting the target prices from the two valuation methods gives a combined target price of $21.9, which implies a 16.1% downside from the current market price. Adding the forward dividend yield gives a total expected return of negative 13.0%. Considering the total expected return, I believe a hold rating is appropriate for CVB Financial Corp.
Be the first to comment