

JHVEPhoto
On February 6th, Cummins (NYSE:CMI) reported results for 2022 as a whole, with record annual revenue and earnings. The extremely strong 2022 results were largely the result of a major earnings surprise in Q2 and the share price had risen to reflect these results. The shares are currently trading at about $248, a level first reached back in mid-November. The trailing 12-month total return for CMI stock is 14.7%, and the annualized 3-year total return is 17% per year. For comparison, the 12-month total return on the S&P 500 (SPY) is -4.75% and the annualized 3-year return is 8.7% per year.
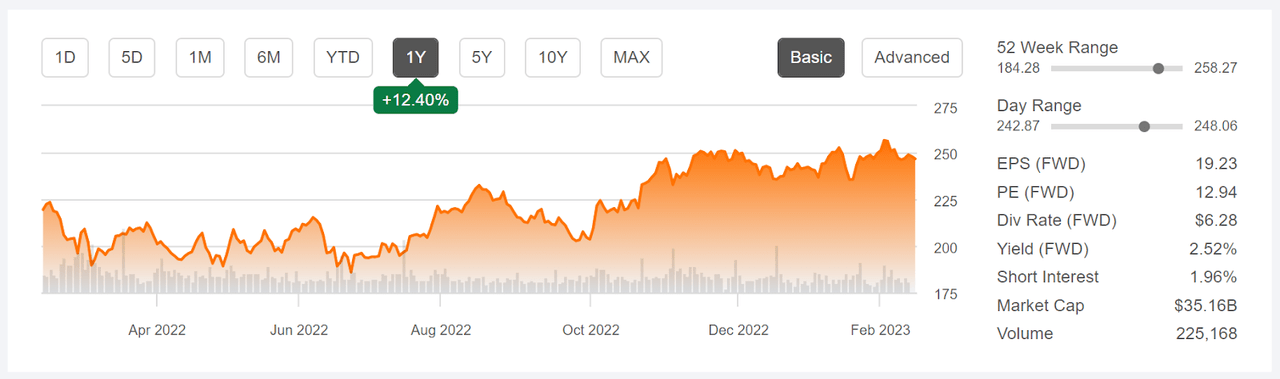
12-Month price history and basic statistics for CMI (Seeking Alpha)
Cummins is positioned to be a leader in the reduced-carbon transport solutions, as articulated in the firm’s Destination Zero vision. The current results of this effort are seen with fuel-agnostic engines, which can run on hydrogen, ongoing research on fuel cells and battery electric vehicles, all while examining end-to-end environmental cost analysis (“Well to Wheel”) of alternatives.
As part of the full year summary, management provided guidance indicating 12% to 17% revenue gains in 2023.
The consensus outlook for earnings has high quarterly EPS in Q2 ($4.94) and Q4 ($4.43) of 2022 becoming the norm over the next year or two. These were the highest-earning 2 quarters out of the last 4 years. Over the next 6 quarters, expected EPS is in the range of these results, with EPS projected to come in between $4.41 and $5.02. Over the next 3 to 5 years, the expected EPS growth rate is 10.4% per year.
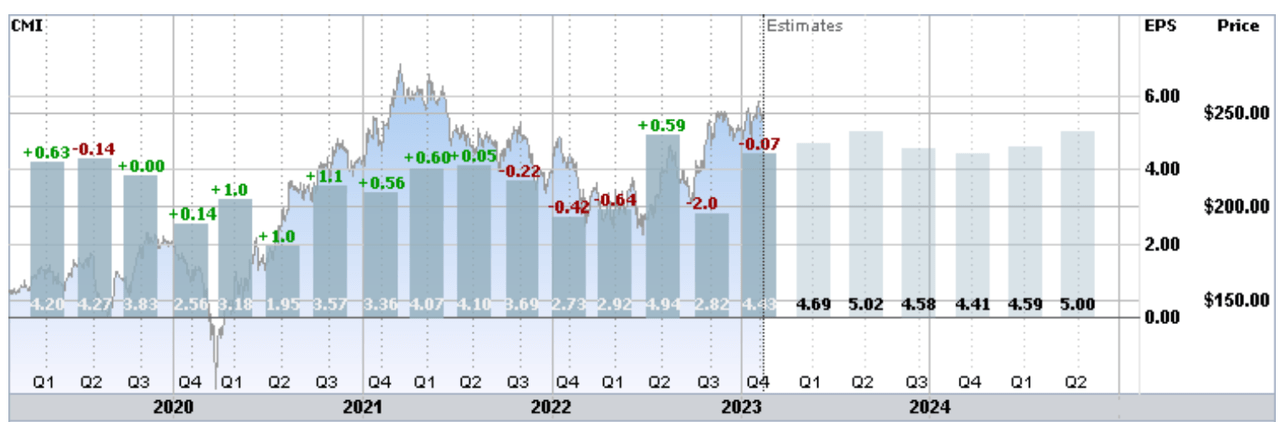
Trailing (4 years) and estimated future quarterly EPS for CMI. Green (red) values are amounts by which EPS beat (missed) expectations (ETrade)
With a TTM dividend yield of 2.4%, and 3- and 5-year dividend growth rates of 7.2% and 7.5% per year, respectively, the Gordon Growth Model indicates that expected total return of around 10% per year is reasonable. For context, CMI’s trailing 5- and 10-year annualized total returns are 10.7% and 9.4% per year, respectively.
I last wrote about CMI on September 13, 2022, 5 months ago, when I assigned a buy rating. The strong Q2 results were reported on August 2nd. While the shares rallied in response to the Q2 report, they had declined to below the August 2nd level by September 13th. The forward P/E was 12.1, in the mid-range of values over the past several years. The Wall Street consensus rating was a buy, with a consensus 12-month price target that corresponded to expected total return of 15.9% over the next year. The market-implied outlook, a probabilistic price forecast that represents the consensus view from the options market, was bullish to early- and mid-2023, with expected volatility of about 31% (annualized). As a rule of thumb for a buy rating, I want to see an expected 12-month return that is at least ½ the expected volatility. Taking the Wall Street consensus price target at face value, CMI met this criterion. In the period since this post, CMI has returned a total of 17%, about 3 times the return of the S&P 500 over the same period.
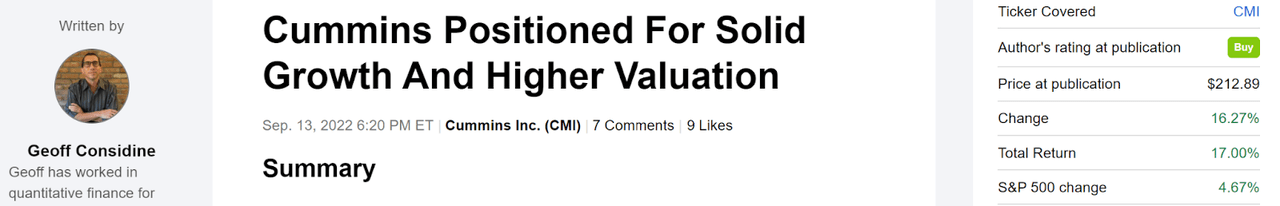
Previous post on CMI and subsequent performance vs. the S&P 500 (Seeking Alpha)
For readers who are unfamiliar with the market-implied outlook, a brief explanation is needed. The price of an option on a stock reflects the market’s consensus estimate of the probability that the stock price will rise above (call option) or fall below (put option) a specific level (the option strike price) between now and when the option expires. By analyzing the prices of call and put options at a range of strike prices, all with the same expiration date, it is possible to calculate the probable price forecast that reconciles the options prices. This is the market-implied outlook. For a deeper discussion than is provided here and in the previous link, I recommend this outstanding monograph published by the CFA Institute.
I have generated updated market-implied outlooks for CMI and I have compared these with the current Wall Street consensus outlook in revisiting my rating.
Wall Street Consensus Rating for CMI
Seeking Alpha calculates the Wall Street consensus outlook for CMI by combining the views of 25 analysts who have published price targets and ratings over the past 90 days. The consensus rating is a buy, as it has been since early 2021. The consensus 12-month price target is 5.2% above the current share price, for an expected total return of 7.7%.
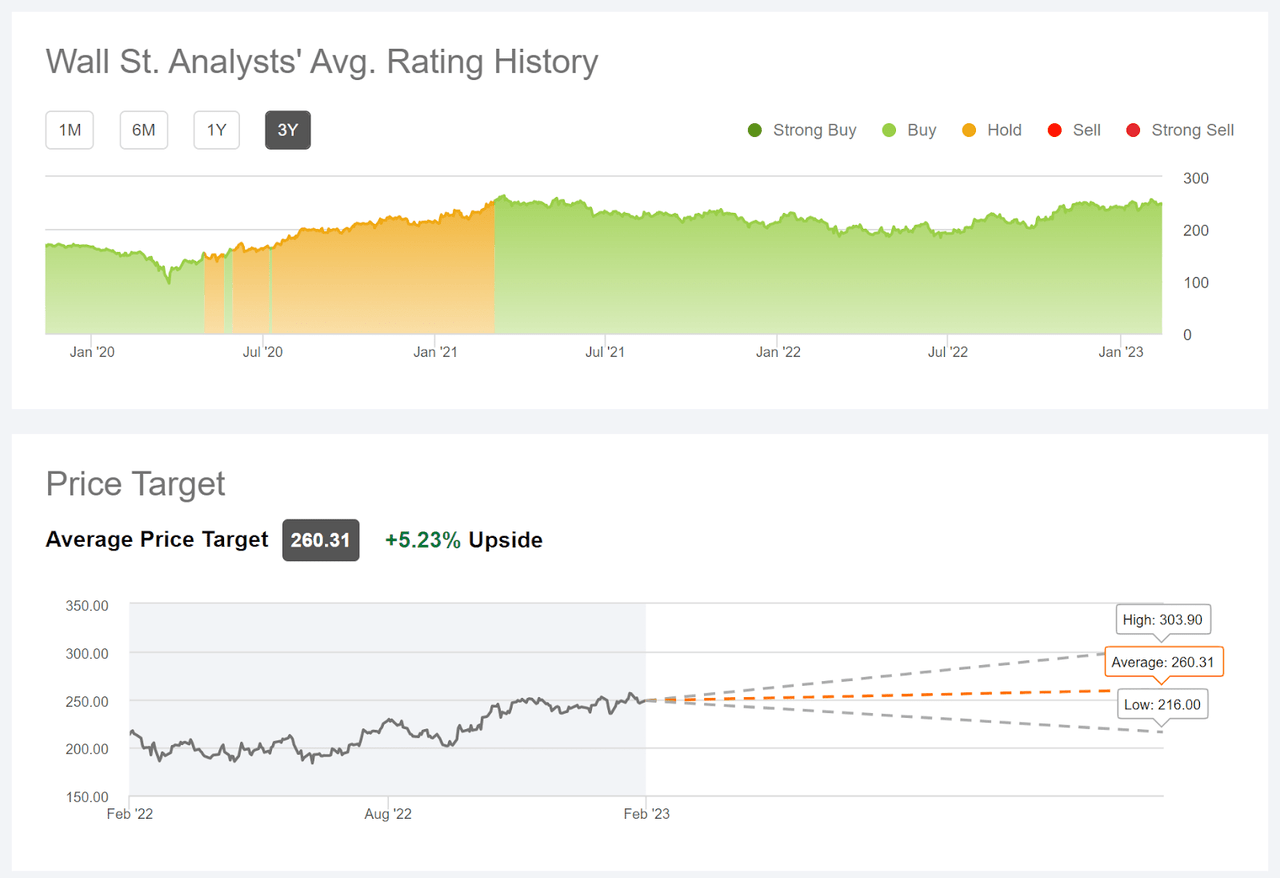
Wall Street analyst consensus rating and 12-month price target for CMI (Seeking Alpha)
Of the 25 analysts included in the consensus, 17 have assigned a hold rating, 2 have a buy rating, and 7 rate CMI as a strong buy. No analysts have had a sell rating on CMI since May of 2021.
Market-Implied Outlook for CMI
I have calculated the market-implied outlook for CMI for the 4-month period from now until June 16, 2023 and for the 11.1-month period from now until January 19, 2024, using the prices of call and put options that expire on these dates. I selected these specific expiration dates to provide a view to the middle of 2023 and through the entire year.
The standard presentation of the market-implied outlook is a probability distribution of price return, with probability on the vertical axis and return on the horizontal.
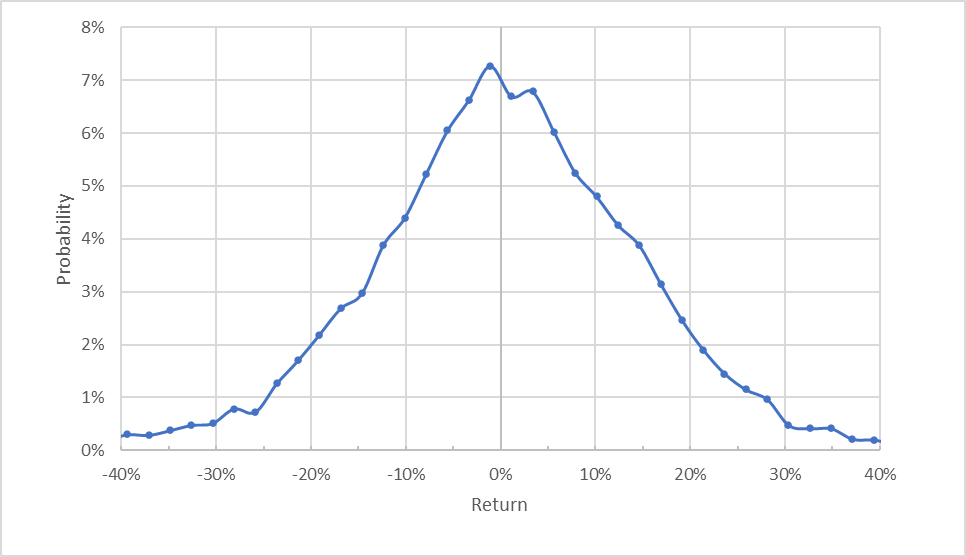
Market-implied price return probabilities for CMI for the 4-month period from now until June 16, 2023 (Author’s calculations using options quotes from ETrade)
The market-implied outlook is generally symmetric, with comparable probabilities for positive and negative returns of the same magnitude. The expected volatility calculated from this distribution is 26.5% (annualized). For comparison, ETrade calculates a 26% implied volatility for the options expiring on June 16th.
To make it easier to compare the relative probabilities of positive and negative returns, I rotate the negative return side of the distribution about the vertical axis (see chart below).
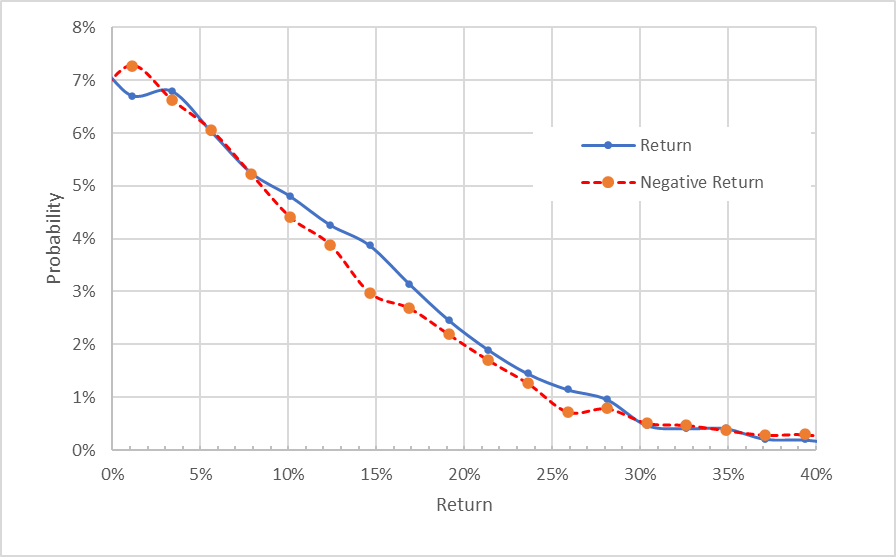
Market-implied price return probabilities for CMI for the 4-month period from now until June 16, 2023. The negative return side of the distribution has been rotated about the vertical axis (Author’s calculations using options quotes from ETrade)
This view shows that the probabilities of positive returns tend to be slightly higher than those of negative returns of the same size (the solid blue line is on or above the dashed red line over almost the entirety of the chart above). This tilt in probabilities suggests a slightly bullish outlook. This outlook is less bullish (less spread between solid blue and dashed red curves) than the 4.2-month outlook from my September post.
Theory indicates that the market-implied outlook is expected to have a negative bias because investors, in aggregate, are risk averse and thus tend to pay more than fair value for downside protection. There is no way to measure the magnitude of this bias, or whether it is even present, however. The expectation of a negative bias reinforces the bullish interpretation of this outlook.
The market-implied outlook for the 11.1-month period to January 19, 2024 exhibits a slightly stronger tilt in probabilities to favor positive returns than the 4-month outlook. The expected volatility calculated from this distribution is 27.2%. I interpret this outlook as moderately bullish.
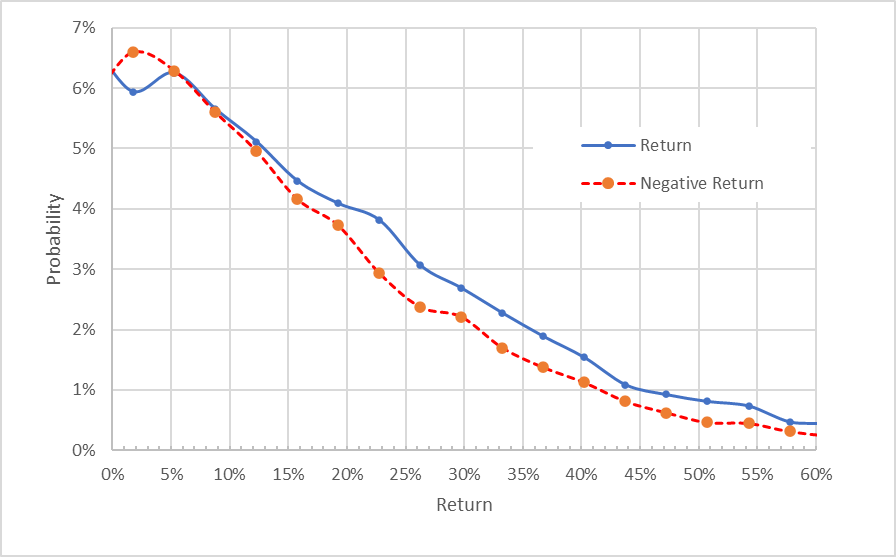
Market-implied price return probabilities for CMI for the 11.1-month period from now until January 19, 2024. The negative return side of the distribution has been rotated about the vertical axis (Author’s calculations using options quotes from ETrade)
At the time that I pulled the options quotes for this analysis, CMI was trading at $248.19 and the bid price for a call option with a $250 strike, expiring on January 19, 2024, was $25.10. Buying CMI and selling this call option provides 10.1% in option premium yield ($25.10 / $248.19) in addition to 3 expected dividend payments of $1.57 between now and January 19, 2024, for a total income yield of 12%. In selling these covered calls, you have given up all potential price appreciation, of course. Given that the Wall Street consensus 12-month price target is only 5.2% above the current share price, locking in 12% in income is worth considering. For additional context, the trailing 15-year annualized total return for CMI is 12.2%, and the 5- and 10-year annualized returns are 10.7% and 9.4% per year, respectively.
Summary
Cummins delivered record revenues and earnings in 2022 and management guidance for 2023 is encouraging. The shares have delivered attractive returns over the past several years, far above those from the S&P 500. Even with these large gains, the valuation is reasonable. The Wall Street consensus rating is bullish, as it has been for most of the past 3 years. The consensus 12-month price target corresponds to an expected total return of 7.7% over the next year, well below the annualized rate of return over the past 3-, 5-, 10-, and 15-year periods. The market has priced in quite a lot of the potential upside. This 7.7% expected total return is not very high when compared to an expected volatility of about 27%. The market-implied outlook to the middle of 2023 is slightly bullish and the outlook to mid-January of 2024 is moderately bullish. CMI appears to have less upside potential than in September, but the overall outlook remains generally positive. The company’s strategy continues to be compelling, and the company’s commitment to multi-fuel engines just makes sense. In addition, CMI’s revenue and earnings track record in recent years is reason to have faith in management. I am maintaining a buy rating on CMI even though the potential price appreciation appears limited over the next year.
Be the first to comment