

kynny/iStock via Getty Images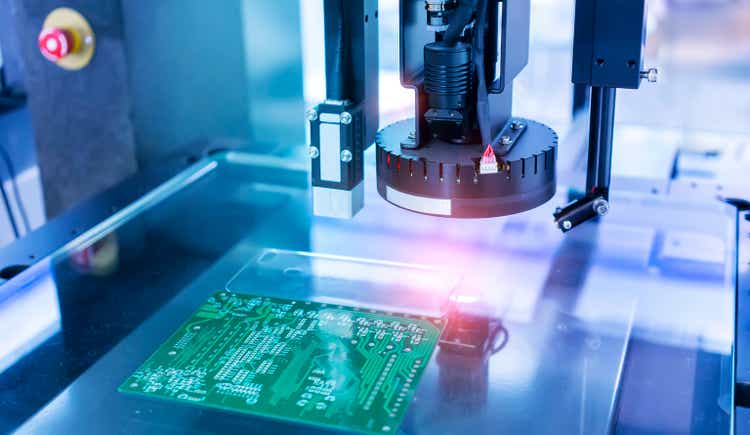
In this period where securities (including crypto) are crashing, people are searching for the next safe haven to store their money. Rather than putting it into money-market instruments or commodities like gold and silver, we are here to convince you that this company will yield higher returns than the aforementioned over the next few years.
CTS Corporation (NYSE:CTS) is a fundamentally strong and simple business that generates high levels of cash. This allows the management to acquire reputable companies to diversify its product network into a limited number of industries that it focuses on. The reason it is able to do so is due to strong organic growth. We believe that CTS is primed to capture more upsides as we are nearing the bottom of cyclical trends.
Company Analysis
CTS primarily designs and manufactures a broad spectrum of sensors, connectivity components, and actuators for original equipment manufacturers (“OEMs”) and tier-one suppliers for the aerospace and defense, industrial, medical, and transportation markets. The business is highly profitable because of the increasing need for vital inputs to be transmitted into the electronic systems to execute fast, efficient, and precise tasks. The company’s products are categorized into their ability to sense, move or connect, which has a specific function for a given product family after integrating into the devices.
Product Offerings and Service Sectors (Company’s Annual Report)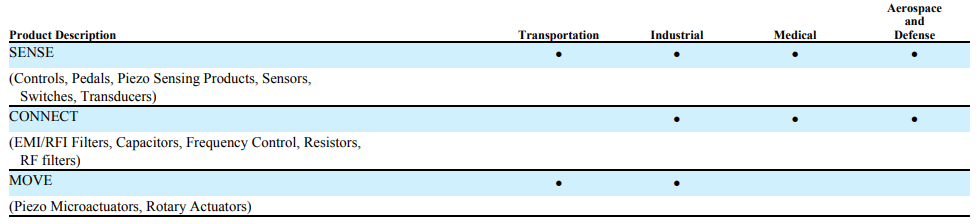
The company is focused only on four industries, with at least two of its products serving the needs of the industry, establishing a strong market positioning for CTS in terms of providing long-term value to its customers. As such, we believe that this company deserves a deeper breakdown of its competitive advantages in the industry.
Porter’s Five Forces Analysis (Author’s Spreadsheet)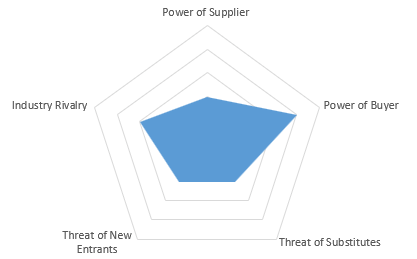
To evaluate the company’s competitive forces, the Porter’s Five Forces diagram clearly illustrates CTS’s relatively strong positioning among its stakeholders.
It has a low power of suppliers, as it has existing business relationships with a few suppliers across products serving various industries, thus reducing the reliance on any one supplier. This means that the cost of inputs is unlikely to be driven up without notice, based on its relationships with its counterparts. The threat of new entrants remains low due to high CapEx and R&D cost that takes time to materialize, while the threat of substitutes is low as well. Compared to other publicly listed companies that may procure piezoelectric ceramics for only one specific industry, CTS provides an increased utility of this material across the medical, industrial, and aerospace & defense markets, making it one of the few companies globally to do so.
We think that industry rivalry among competitors would be slightly high since existing peers of CTS are able to enhance their pricing strategy to entice customers. This is noticeable when Honda, one of CTS’s customers, fell off its list of major customers that accounted for >10% of total net sales after a consistent decline over the years. This leads to a slightly higher power of buyers as the company depends on a small number of customers for a substantial portion of its business.
Investment Theses
Strong Organic Growth Despite Acquisitions
This year alone, CTS completed two acquisitions that will vertically integrate TEWA and Ferroperm Piezoceramics into the company as part of its diversification strategy. What amazes us is its ability to complete both acquisitions fully with cash and end the latest fiscal quarter with more cash on hand than the end of 2021. For the fiscal year ending in Dec 2021, the company has $141.465 billion in cash on its balance sheet, and for the latest Q3, it reported $147.908 billion in cash on its balance sheet. We see CTS’s ability to conduct aggressive CapEx in times of market uncertainty and still hold high levels of cash as a unique strength in the industry.
Even if we exclude the fact that these acquisitions are going to be accretive in years to come, the company still possesses the strength to drive immense organic growth in sales. For 2021, it has been an immensely profitable year across all businesses with a large excess of liquidity flowing into the markets. However, CTS managed to clock a 9% and 17% organic growth in sales for Q2 and Q3 in 2022, once again displaying its prowess to garner more business and greater deals while balancing the stress of its acquisitions on the balance sheet.
Average Wall St Analysts’ Price Target vs Actual Price of CTS (Seeking Alpha)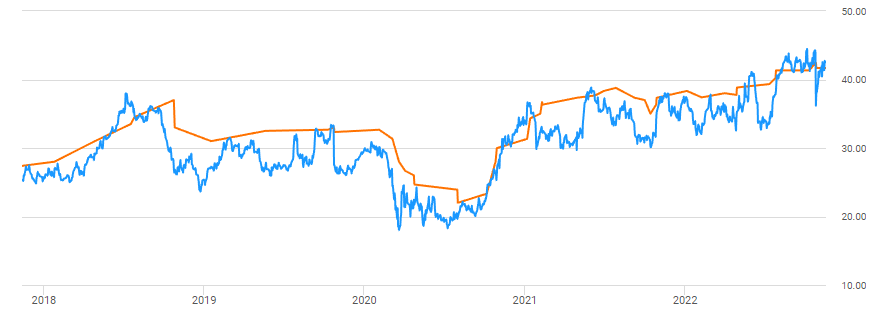
We definitely think that the impact of acquisitions is going to show in the next few fiscal quarters and coupled with steady organic growth, CTS is primed to generate exponentially higher revenues that could well surprise analysts’ expectations. This is because CTS historically trades significantly below its average price target and right now, it is sitting around the street’s general consensus of how much this company should be valued. Evidently, analysts have not factored in the immense growth potential for this company yet and would be likely to do so in the next few fiscal quarters.
Nearing the Bottom of Cyclical Trends
How CTS makes its money is by securing contracts from various customers across specific industries to fulfill the production and/or installation of a component with a specific purpose. For example, sensors to detect chassis height in EVs, detect temperature changes for organ transplant equipment, or even sonar and guided torpedo applications.
In the light vehicle market, the general decline in the number of vehicle assemblies has been driven primarily by COVID-19, the semiconductor shortage, and ongoing supply chain constraints making raw materials less accessible at a reasonable price. We think that moving forward, auto demands are probably going to decline slightly in light of consumer spending and higher interest rates. However, production volume should expect incremental gains in the years to come. The reversal of headwinds would enable a strong brand like CTS to secure more orders across a greater diversification of industries and applications, directly driving sales upwards.
The rest of the industries that CTS is exposed to are generally non-cyclical, with the exception of the aerospace and defense industry. The company guided that demand for its products in the defense segment is soft in Q2 and Q3 2022. However, it continues to remain a favorite in the industry, securing new contracts to produce a single crystal product for unmanned underwater vehicles and a defense customer for anti-tank missile applications. Besides, the acquisition of Ferroperm is going to increase traction in the European defense market for CTS, further cementing the capabilities of the company in this industry. With increasing defense budgets globally from trends of the current geopolitical environment, we believe that there would be an increased demand from this end-market over the years, and CTS is well-positioned to fulfill the anticipated demand.
Valuation
Revenue Projections (Author’s Spreadsheet)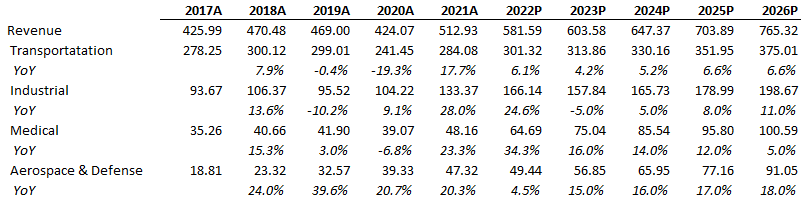
For Q4 2022, we guided our projection for the Transportation segment according to the Q3 earnings call, where the CEO forecasts an impact in the mid-single-digit value due to the challenges with semiconductor suppliers affecting commercial vehicle volumes. To be conservative, we project declines for this business segment according to Q3 year-on-year growth rates for the last quarter of FY22, before a single-digit increase year-on-year. This is in line with the management’s strategy of the increasing diversification of its business by focusing more on its proportion of non-transportation revenue to total sales. Currently, revenues from the transportation segment continue to take up the majority of the total sales of CTS, with Q3 sales at approximately 48% of its total revenue in non-transportation markets. We think that that figure could grow by 1% yearly after FY24.
For the industrial segment, we think that there could be a slight weakness in the demand for products, given the softness of consumer-facing products linked to computing and entertainment. This is further confirmed by the company reporting higher levels of inventory in certain parts of the industrial business segment, with the demand for its micro actuators for use in industrial printing applications down marginally from prior quarters. However, this business segment recorded another quarter of double-digit growth year-on-year, which is likely to continue for the last quarter of 2022. This brings us to a yearly decline in terms of revenue for this segment and we continue to project that trend throughout FY23 to be conservative, before slowly ramping up growth rates in the single-digit.
For the medical segment, we like the enhancement in CTS’s medical product portfolio offerings after the acquisition of Ferroperm, with over 60 years of experience in manufacturing the highest quality piezoelectric ceramics. Piezoceramics are ubiquitous in medical devices, coupled with the management’s view that organic growth remains strong for traditional ultrasound products, the company is poised to continue benefitting from strong demand. This positive momentum is likely to enable opportunities for long-term growth for CTS in this business segment.
For aerospace and defense, we projected FY23 revenues and beyond based on CTS’s ability to continue the momentum in securing new defense contracts. The company managed to receive a new customer contract from a Tier 1 defense contractor for a single crystal product for unmanned underwater vehicles. Its portfolio also shows strong brand loyalty and growth through recurring orders across several existing customers and a new order for low-orbit satellites. We referenced the growth in Q3 year-on-year for this business segment.
Cost Drivers (Author’s Spreadsheet)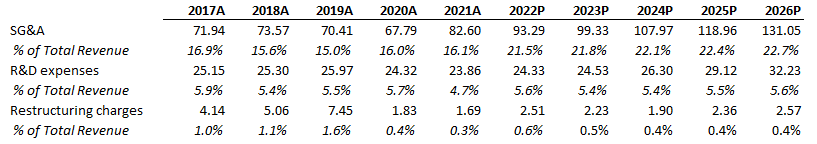
For cost drivers, we estimated a gradual increase in selling, general and administrative (SG&A) expenses as a result of the continuous implementation of cost-saving measures and incentive compensation. For research and development, we ramp down our projections until FY23 before slowly increasing, which is in line with the company’s vision to drive organic growth. For restructuring costs, the company is on track to incur half of the average restructuring cost of the September 2020 Plan, a restructuring plan that prioritizes the optimization of CTS’s manufacturing footprint and improving operational efficiency, by the end of this year. We continue to project high restructuring costs into the next two fiscal years, followed by a dip in restructuring before taking the average of restructuring costs with respect to the amount of total revenue generated.
For other expenses/income, we noted a larger-than-usual expense from an increased pension expense as a result of the settlement charges from the termination of CTS’s U.S. pension plan. Nevertheless, we treat it as a once-off expense and project expenses/income in this segment according to foreign currency translation fluctuations and changes in pension expenses with the expansion of CTS.
Free Cash Flow Projections (Author’s Spreadsheet)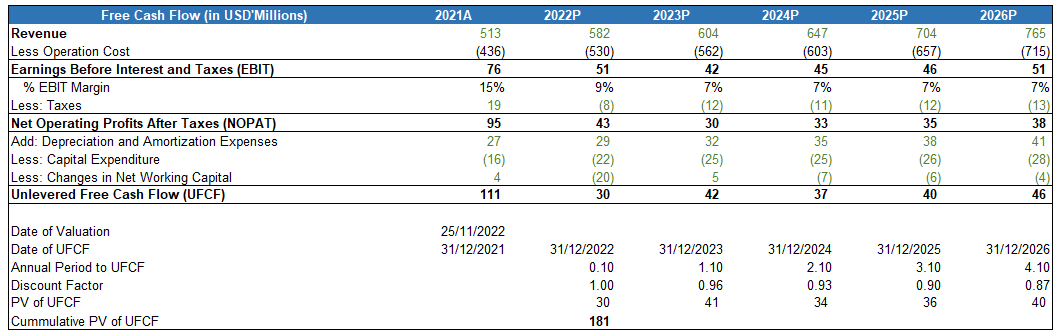
We modelled the free cash flow of CTS with increasing capital expenditure in mind and to our surprise, the company managed to generate a rather consistent stream of cash flow.
CTS Capital Structure (Author’s Spreadsheet)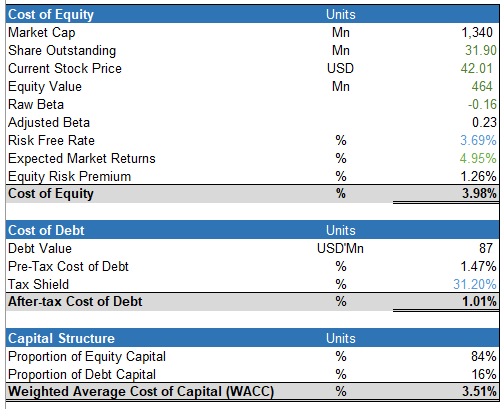
We benchmarked CTS to the NYSE Composite Index to derive the adjusted beta, before referring to the U.S. 10Y Treasury as a benchmark for CTS risk-free rate. This brings us to a WACC that is supported by mostly equity compared to its debt.
Valuation – Gordon Growth Method (Author’s Spreadsheet)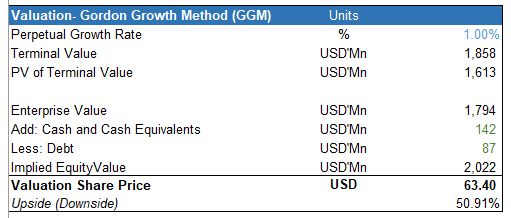
We decided to utilize a Gordon Growth method for our discounted cash flow model as the company has been established in the public markets for a long time. We chose to use a perpetual growth rate of 1% after considering its size and business records throughout the years, and this brings us to an upside of over 50% for the stock price at the time of writing this article.
Sensitivity Analysis for GGM (Author’s Spreadsheet)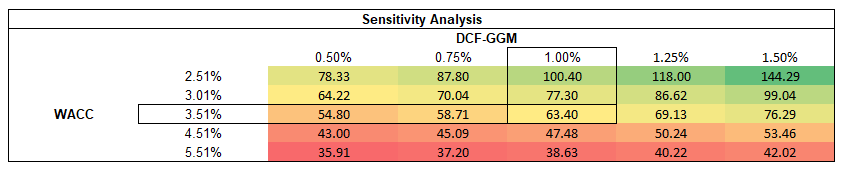
We conducted a sensitivity analysis for which most of the scenarios returned a positive upside for CTS.
Valuation – EV/EBITDA method (Author’s Spreadsheet)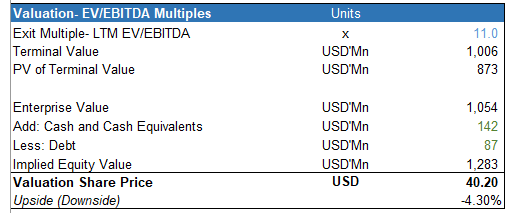
Just to sense-check our valuation method, we did another exit multiple method that involves the EV/EBITDA. For the multiple, we set it at 11.0x after looking at the company’s average range (8.27-14.27x) for this multiple for the past five years and derived a slight downside to the closing price as of writing this article.
Sensitivity Analysis for EV/EBITDA method (Author’s Spreadsheet)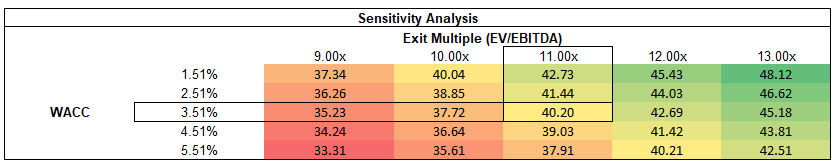
Based on our sensitivity analysis, there are only some downsides should the WACC increase, but a greater upside should the exit multiple be less conservative and the WACC go down after this bearish period of increased market volatility.
Valuation – EV/Revenue method (Author’s Spreadsheet)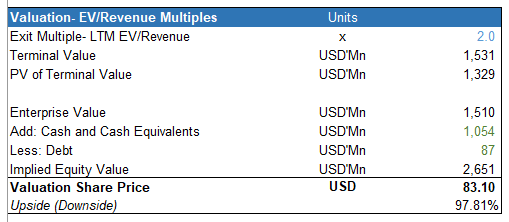
To entertain the fact that CTS is gradually growing its sales, we conducted a second exit multiple method that involves the EV/Revenue. For this multiple, we set it to 2.0x to be conservative after looking at the company’s average range (1.82-2.21x) for this multiple for the past five years. But even so, this almost returned a 100% upside at the current price of CTS stock. We think that this case is rather unlikely, but it reveals how lucrative an investment into this business is on several valuation methods.
Risks
CTS derives a huge portion of its revenue from non-U.S. operations, which makes it susceptible to exchange and geopolitical risk. However, we see this as a strength in the current market conditions, given that most currencies are weak compared to the U.S. dollar. The appreciation of other currencies against the U.S. dollar after this period of bearish market conditions could see a larger value of exports from the U.S., boosting sales instead.
CTS provides products for highly cyclical industries such as automobiles and defense, which is highly dependent on current market conditions for consumer spending and government budget constraints. However, we think that for automobiles, demand for such big-ticket items is currently in a downtrend now. Any future demand for automobiles would generally be higher than this level, which will benefit the demand for CTS products as well.
Conclusion
In all, CTS is an inconspicuous company with just over a billion dollars in market capitalization. Despite its size, it is able to acquire smaller target companies to boost its sales for the foreseeable future, which displays a strong relative positioning of the company against its larger peers. Compared to larger manufacturers in China or in Europe, CTS easily flies under their radar despite its significant performance over the past few fiscal quarters. We believe that CTS Corporation will not only continue to generate organic growth in the next few years to come from its acquisitions, but also capture the upsides after the market headwinds reverse.
Be the first to comment