

Crude Oil Price Talking Points
The price of oil trades at its highest level since 2008 as it hits a fresh yearly high ($116.57), and the bullish momentum underlying crude looks poised to persist as long as the Relative Strength Index (RSI) holds in overbought territory.
Crude Oil Price Rally to Persist as Long as RSI Holds in Overbought Zone
The recent breakout in the price of oil may lead to a test of the August 2008 high ($128.60) as it extends the series of higher highs and lows from earlier this week, and current market conditions may fuel higher crude prices as the Organization of Petroleum Exporting Countries (OPEC) plan to “adjust upward the monthly overall production by 0.4 mb/d for the month of April 2022.”
It seems as though OPEC and its allies are undeterred by the Russia-Ukraine crisis as the group sticks to the existing production schedule, and the gradual approach in restoring production to pre-pandemic levels is likely to keep the price of oil afloat ahead of the next Ministerial Meeting on March 31 as the most recent Monthly Oil Market Report (MOMR) insists that “in 2022, oil demand growth is expected at 4.2 mb/d unchanged from the previous month.”
As a result, developments coming out of the US may keep OPEC and its allies on a preset course as crude stockpiles narrow for the first time in three weeks, with inventories contracting 2.597M in the week ending February 25 versus forecasts for a 2.748M rise.
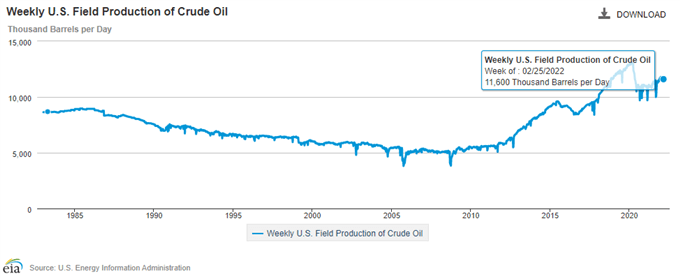
In turn, expectations for stronger demand along with indications of limited supply are likely to keep the price of oil afloat as the fresh figures from the US Energy Information Administration (EIA) show weekly field production printing at 11,600K for the fourth consecutive week.
With that said, current market conditions may keep the price of oil afloat as OPEC and its allies remain reluctant to ramp up their production schedule, and crude may continue to trade to fresh yearly highs over the coming days as the Relative Strength Index (RSI) holds in overbought territory.
Crude Oil Price Daily Chart
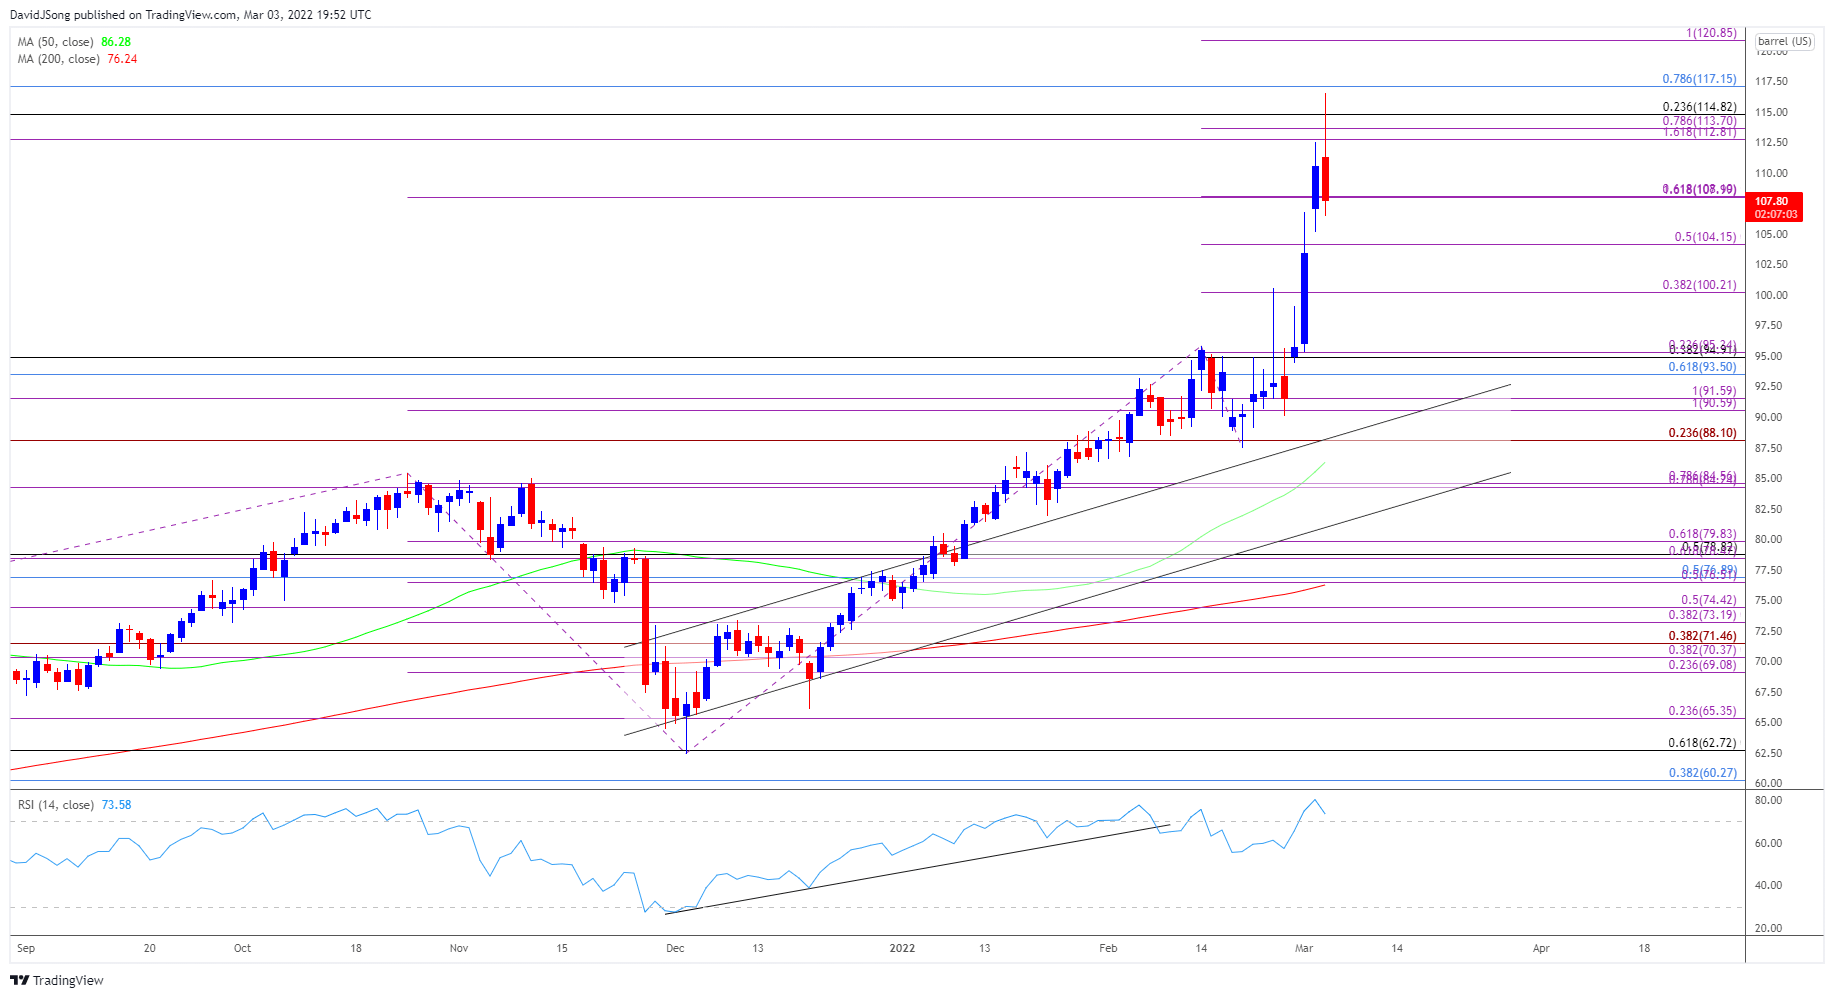
Source: Trading View
- Keep in mind, the price of oil cleared the 2021 high ($85.41) in January, which pushed the Relative Strength Index (RSI) into overbought territory, with a similar scenario taking shape in February as it took out the September 2014 high ($95.91).
- The recent breakout in the price of oil has pushed the RSI back above 70 in March as crude climbs to a fresh yearly high ($116.57), but need a close above the Fibonacci overlap around $112.80 (161.8% expansion) to $114.80 (23.6% retracement) to keep the 117.20 (78.6% retracement) area on the radar, with a break/close above the $121.00 (100% expansion) region opening up the August 2008 high ($128.60)
- However, lack of momentum to hold above the $108.00 (161.8% expansion) to $108.10 (61.8% expansion) zone may push the price of oil back towards the $104.20 (50% expansion) region, and looming developments in the RSI may indicate a larger pullback in the price of oil if the oscillator falls below 70.
— Written by David Song, Currency Strategist
Follow me on Twitter at @DavidJSong
Be the first to comment