

Oil Price Talking Points
The price of oil struggles to retain the rebound from the monthly low ($49.31) as the coronavirus poses a threat to the global supply chain, but efforts by the Organization of the Petroleum Exporting Countries (OPEC) may keep crude prices afloat if the group takes additional steps to rebalance the energy market.
Crude Oil Price Outlook Hinges on OPEC Meeting
The price of oil consolidates ahead of the OPEC meeting starting on March 5 as China, one of the largest consumers of crude, struggles to contain COVID-19, with the outbreak dampening the outlook for global growth.
In response, OPEC and its allies may show a greater commitment to the ‘Declaration of Cooperation’ by extending the agreement beyond the March 31 deadline as the Joint Technical Committee (JTC) insists that the group should curb production “until the end of 2020.”
However, it remains to be seen if OPEC and its allies will further reduce supply after slashing oil output by an additional 500K b/d in December, and a mere extension of the ‘Declaration of Cooperation’ may keep oil prices under pressure as the most recent Monthly Oil Market Report (MOMR) highlights that “oil demand growth in 2020 is revised down by 0.23 mb/d from the previous month’s assessment.”
With that said, the ongoing commitment to the ‘Declaration of Cooperation’ may continue to provide a floor for crude prices, but the OPEC meeting may do little to fuel a larger recovery in the price of oil if the group maintains the quotas from earlier this year.

Recommended by David Song
Download the 1Q 2020 Forecast for Oil
Sign up and join DailyFX Currency Strategist David Song LIVE for an opportunity to discuss key themes and potential trade setups.
Crude Oil Daily Chart
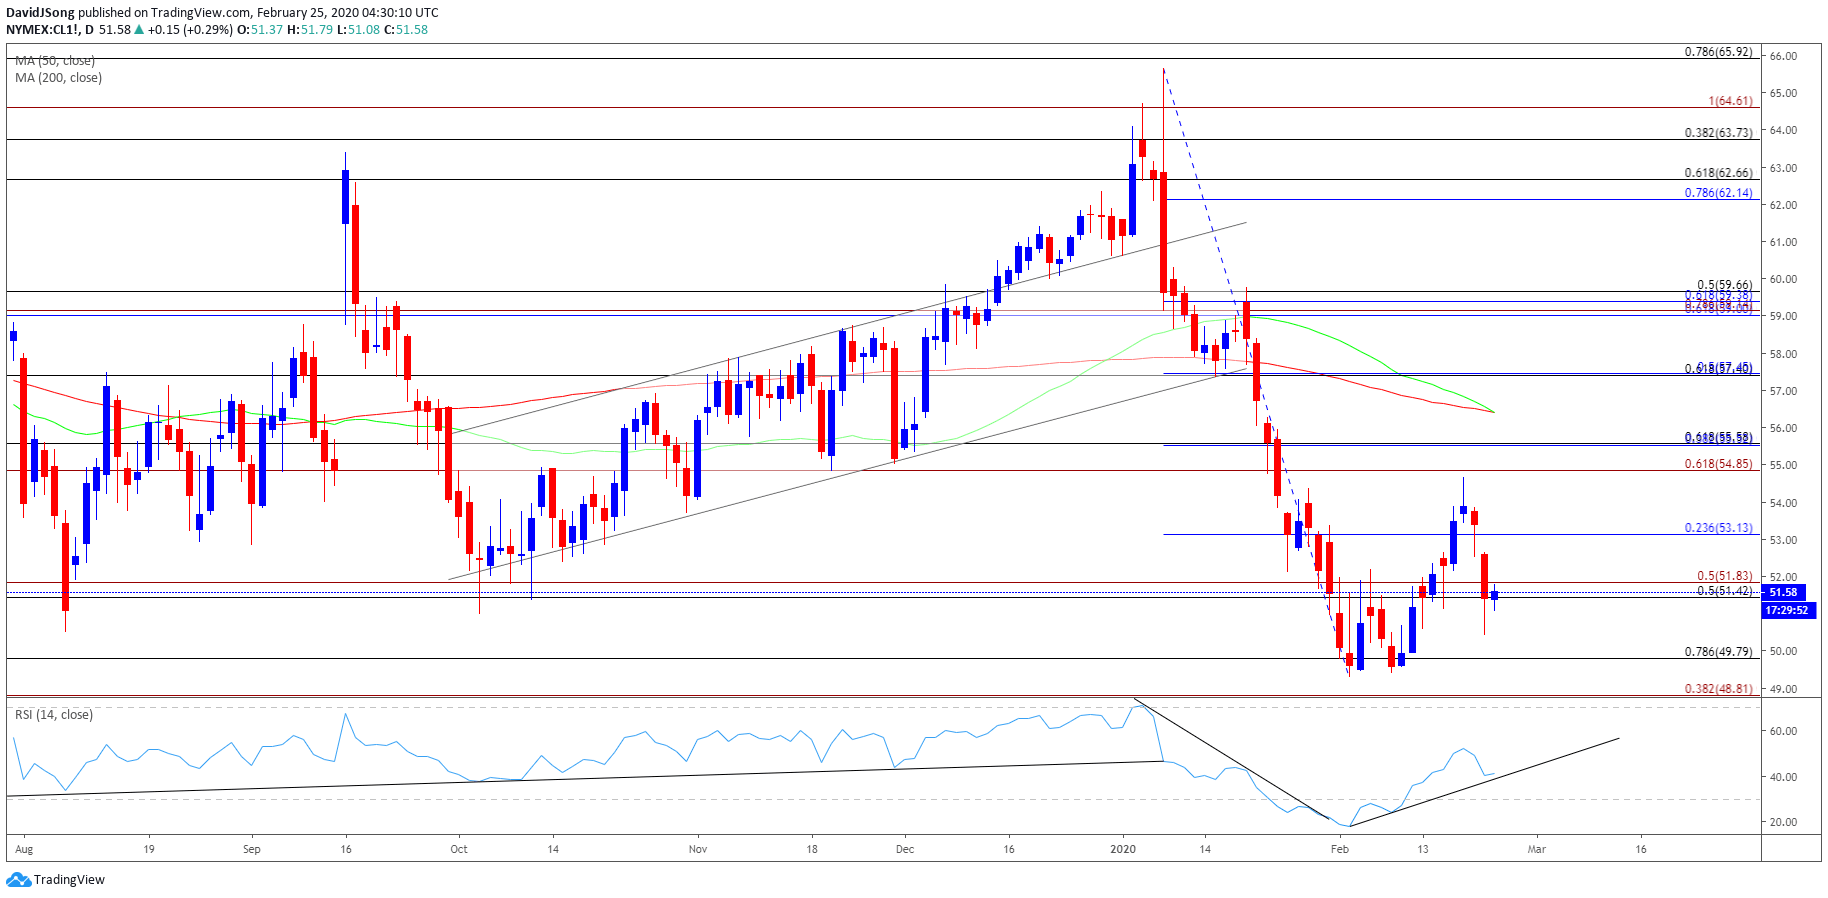
Source: Trading View
- Crude appears to be stuck in a narrow range ahead of the OPEC meeting, and the price of oil may continue to consolidate as the recent decline fails to produce a test of the February low ($49.31), which lines up wit the Fibonacci overlap around $48.80 (38.2% expansion) to $49.80 (78.6% retracement).
- However, the Relative Strength Index (RSI) raises the scope for a larger rebound in the price of oil as the oscillator bounces back from oversold territory and preserves the upward trend from earlier this month.
- Need a break/close above the Fibonacci overlap around $54.90 (61.8% expansion) to $55.50 (38.2% retracement) to open up the $57.40 (61.8% retracement) region, with the next area of interest coming in around $59.00 (61.8% retracement) to $59.70 (50% retracement).

Recommended by David Song
Traits of Successful Traders
— Written by David Song, Currency Strategist
Follow me on Twitter at @DavidJSong
Be the first to comment