

Sjo/iStock Unreleased via Getty Images
By Levi at Elliott Wave Trader; Produced with Avi Gilburt
Do you think that every single investor does a deep dive into the fundamental fabric of each company? They may attempt to do so. And, studying would seem to give each a sense of purpose and the semblance of control. But when it really comes down to it in a stock like CrowdStrike (NASDAQ:CRWD), sentiment is the true driver. Of course, fundamentals are in play. And, yes, they do matter.
However, unless the individual possesses an enhanced comprehension of what is going on behind the scenes at a company like CRWD, it is more likely that they are being guided by biology. Please allow me to explain why we would affirm such a position. As well, we will review where we have been since our initial article for CRWD some time back and where we see the probabilities for the future.
We discuss companies like this among our analyst team. Here is a comment from the fundamental side by Lyn Alden, “I don’t cover CRWD since I don’t have enough domain knowledge on cybersecurity to have an edge there. The companies tend to have expensive equity despite junk-rated debt in many cases, including CRWD, so one really has to have a deep understanding of them to have a fundamental opinion on the stock value.”
First, Let’s Take A Brief Look Back
It was a year ago that we first featured CRWD for the readership. Here is the original article, “The Leader Of The Pack”. Since that ‘Buy’ rating, the stock is up +145%. Now, depending on one’s time frame and individual investment plan, the next piece we shared would have put them on alert for a ‘rest period’.
That article came out after the turn of the year, some 6 months ago, “Even The Leader Of The Pack Needs To Rest Now And Again”. The main takeaway from the most recent missive was that the great gains garnered from June of the prior year would likely take some time to consolidate and digest, as it were.
And, indeed, price did see a 4-month rest period, with the stock declining to a low of just $281. That is some fantastic relative strength. It was at the beginning of May of this year that we began to point out the possibility to our members that CRWD might have already seen its pullback low at that level. While we could potentially anticipate a move to as low as $259, should the price hold and then begin to advance, it would suggest the next rally phase was underway. That is in fact what we have seen. So, what’s the most likely path forward from here? Well, I’m glad you asked that.
Sentiment Is Speaking Via The CRWD Chart
Here’s what we can ascertain from the structure of price on the chart. A bit of context to set the table, please. This is a chart from Zac Mannes from back in November of 2022. Note the lower target anticipated and then what was likely to happen thereafter.
chart by Zac Mannes from November 2022 – StockWaves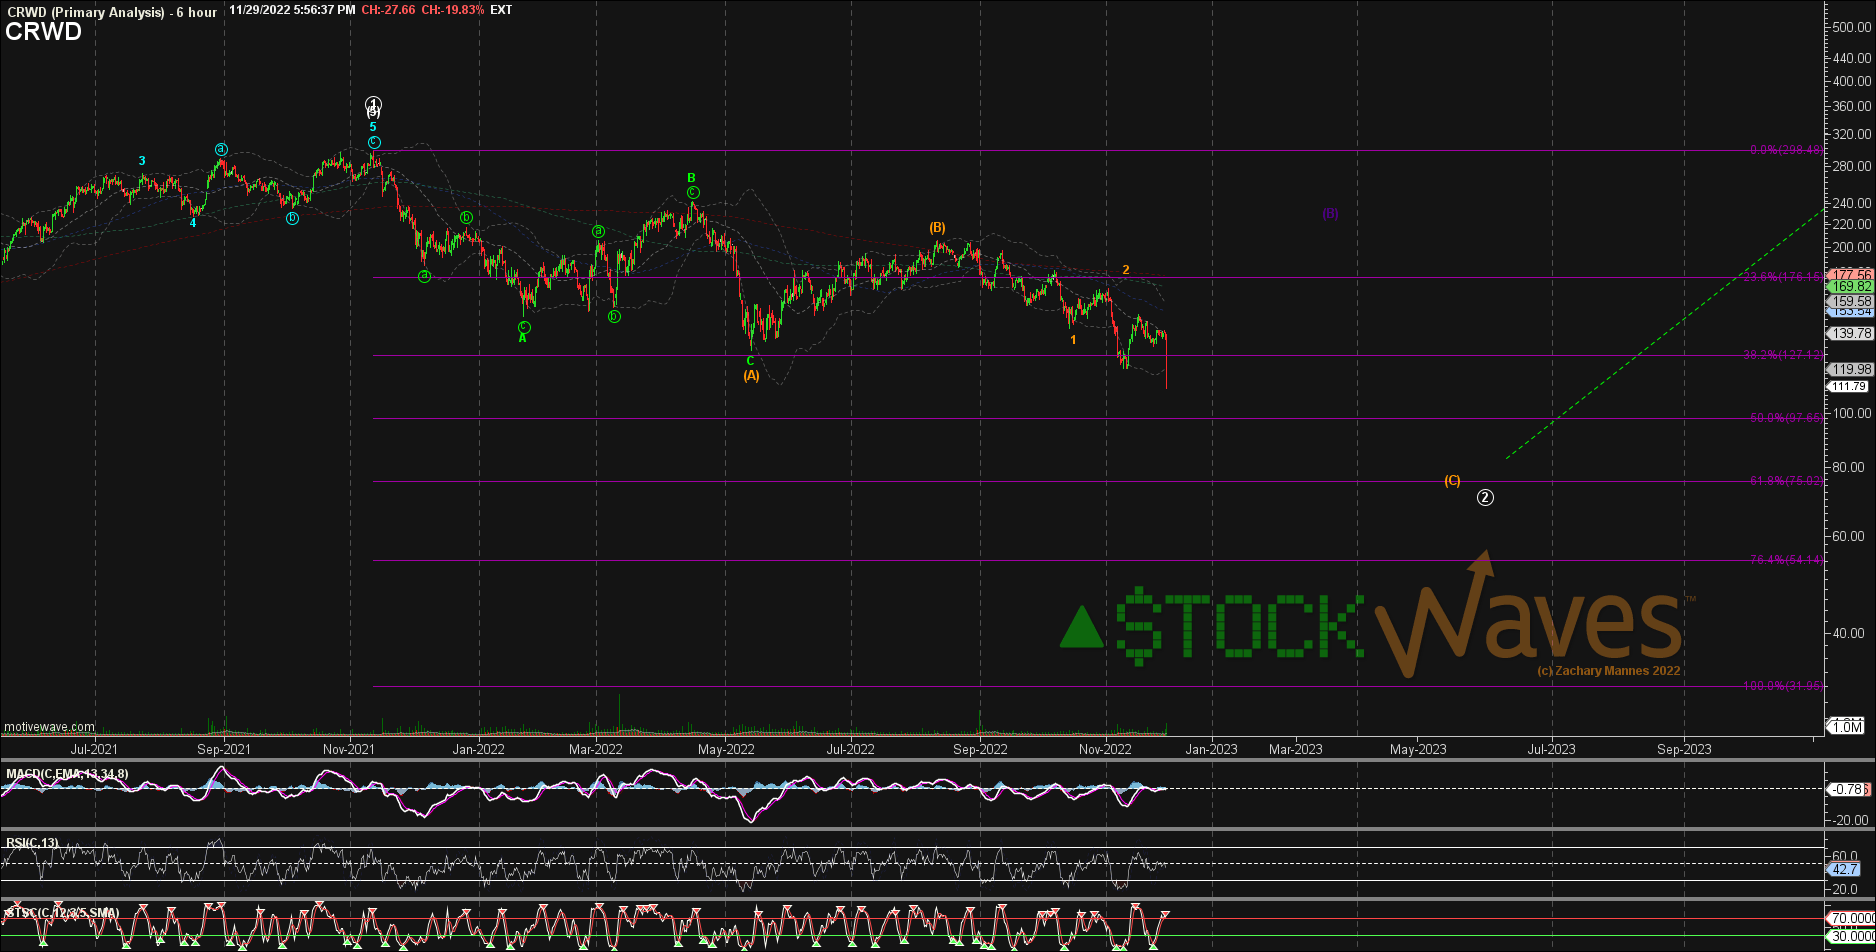
Price did indeed fulfill the pullback target area and begin the current strong advance. Here are Zac’s most recent comments regarding the bigger picture:
“The green arrow was showing measured move potential from back in early 2023 off the Jan 2023 lows. That is still the case at the larger degree and likely getting a lot more than just 700s. The subwave count we are tracking is still the potential for this whole move up to be JUST wave [1] of that larger degree green circle Primary 3.
The alt yellow path implies that we are further along and in the 5th of [3] already pointing toward 500s and then needing a [4] before a [5] would take it to 700+. We track EW by degree and a larger structure can still be bullish while the ideal path in the shorter term allows for consolidation.
Usually things at a larger degree a more clear and reliable as we get smaller and smaller there is increasing potential for variability.
The green arrow has been there a LONG time.”
OK, great! What about now? Here is how the current structure fits into that bigger picture.
chart by Zac Mannes – StockWaves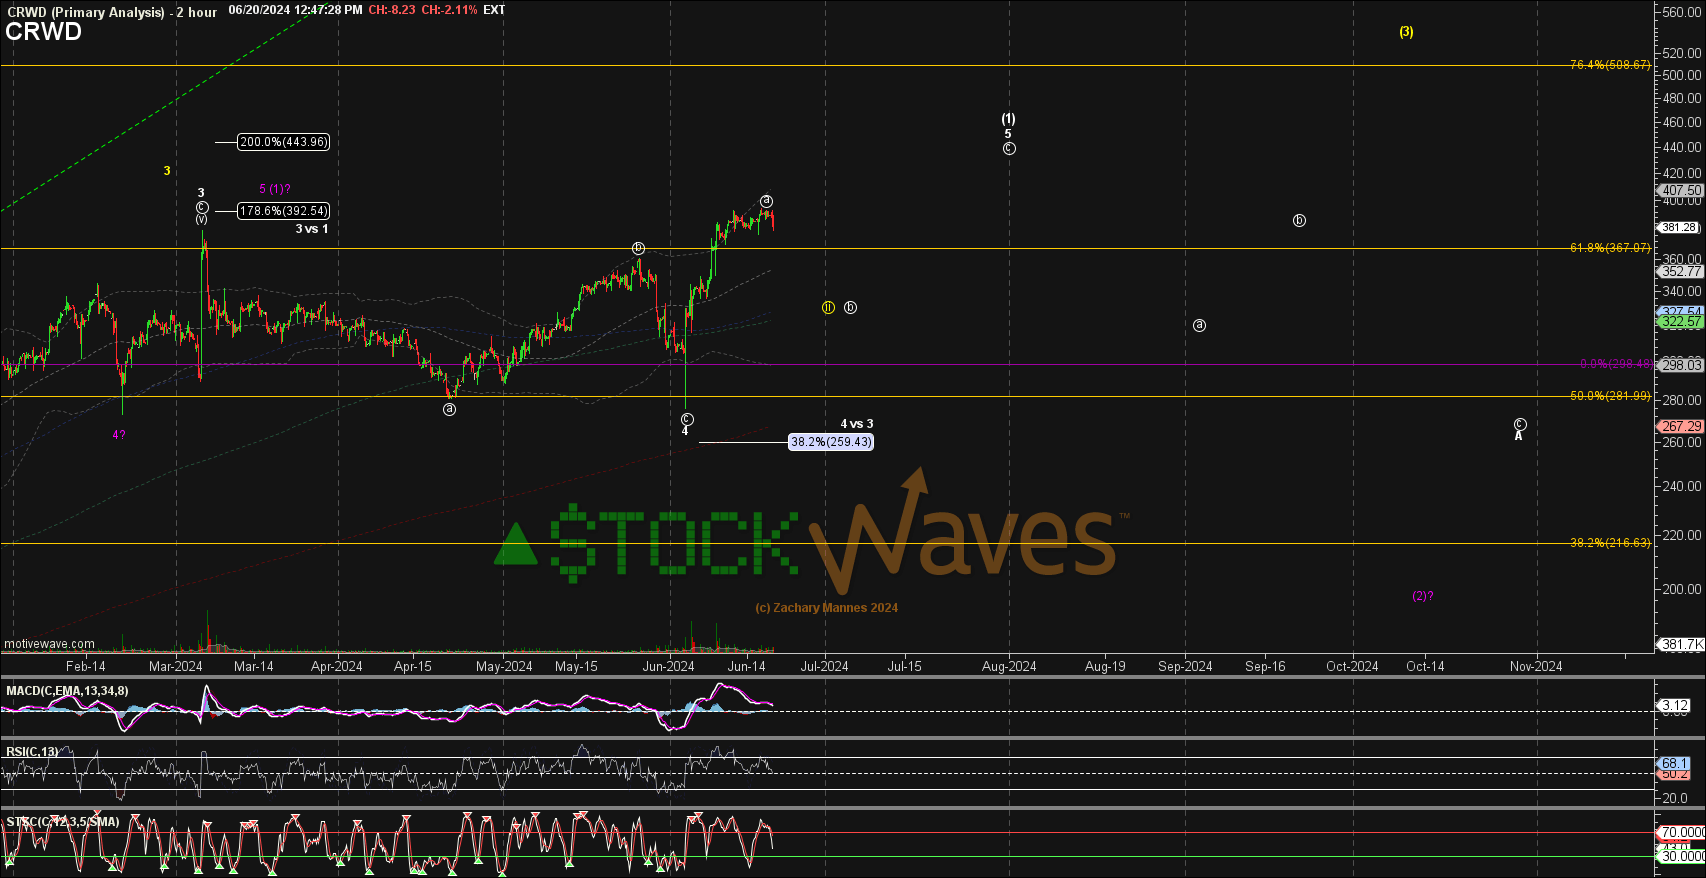
The basic premise is that ultimately, price should see either the high in the larger wave [1] in white or the upper target in the yellow ‘3’. Both scenarios paint much higher prices in the longer time frames.
Yes, the future as shown by sentiment does indeed look bright for CRWD.
What Is Sentiment?
There are several ways we can explain the same word. Mood, feeling, disposition. But it basically boils down to fear and greed. Fundamentally, it is a decision made via the limbic system in our brain. This is the biology basis to which we refer. Those two ‘feelings’ dominate how the price action unfolds before our very eyes on the charts that we study.
Avi Gilburt shares his own findings on the subject to the readership here on a regular basis. These are from over years of investigation, trial, refinement, observation and then continual proof manifested in chart after chart.
Here is a brief excerpt from the 6-part series that Avi published to explain our methodology more fully. You can see this article, part 4 of the series, here.
“A move in the direction of the trend is considered a ‘motive’ move (or, as I often refer to it as an ‘impulsive move’) and will constitute 5 waves in the primary trend direction. A counter-trend move is considered a ‘corrective’ move and constitutes 3 waves, which are counter to the primary trend direction.
Within the impulsive 5-wave move, waves 1, 3, and 5 move in the direction of the primary trend, and waves 2 and 4 will be counter-trends in the opposite direction.
Since the market is ‘fractal’ in nature, it means that these movements are variably self-similar at different degrees of trend. In other words, these impulsive and corrective movements of the market are occurring at all degrees and in all time frames.
While this may have begun to sound more complex, I do want to note that the main rules of Elliott Wave analysis are really quite simple. First, wave 2 can never retrace beyond the start of wave 1. Second, wave 3 cannot be the shortest wave. In its simplest form, these are the main rules which you cannot break for a valid Elliott Wave structure.”
Do You Have A System In Place?
Those who have experience forged by time in the markets will tell you that it’s imperative to have a system of sorts in place. You need to be able to define how much you are willing to risk vs. how much gain is likely. Those who survive across the decades in the greatest game on earth will also inform you that the preservation of capital is paramount.
While there are multiple manners of doing this, we have found Fibonacci Pinball to be a tool of immense utility for traders and investors alike.
Conclusion
There are many ways to analyze and track stocks and the market they form. Some are more consistent than others. For us, this method has proved the most reliable and keeps us on the right side of the trade much more often than not. Nothing is perfect in this world, but for those looking to open their eyes to a new universe of trading and investing, why not consider studying this further? It may just be one of the most illuminating projects you undertake.
(Housekeeping Matters)
If you would like notifications as to when our new articles are published, please hit the button at the bottom of the page to “Follow” us.
Be the first to comment