

8vFanI
Looking for high dividend stocks at a discount?
Maybe you should take a look at Crescent Capital BDC (NASDAQ:CCAP). It’s a Business Development Company, a “BDC”. BDCs invest in privately held companies, offering retail investors access to a part of the market that’s normally the domain of Venture Capital and private equity companies.
We began covering CCAP in January 2021. Since then we’ve had a pretty good ride, with a total return of 30.49%, with a 56%/44% split between distributions and price gains, vs. an 8.11% return from the S&P 500:
Hidden Dividend Stocks Plus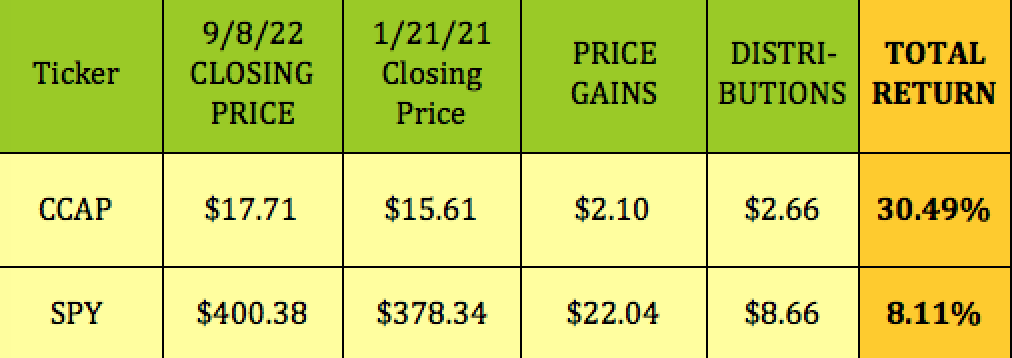
CCAP has also outperformed the BDC industry and the S&P over the past month, quarter, year, and so far in 2022:
Hidden Dividend Stocks Plus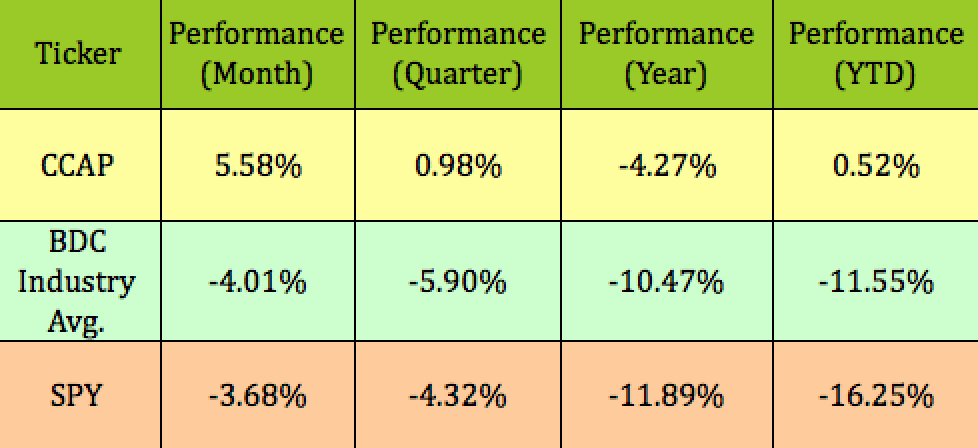
Profile:
CCAP is focused on originating and investing in the debt of private middle-market companies which are also supported by sponsors. A key factor for BDCs is that the companies that they invest in also have sponsorship from Venture Capital and/or private equity companies, who will add further support to them in tough times, such as during the pandemic.
Its holdings are 90% in the US, with 6% in Europe, 2% in Australia, and 2% in Canada. Its asset base is 88% 1st Lien and 99% Floating Rate, a positive in the current rising rate environment. It has a $1.285B portfolio, comprised of 137 companies, with a median portfolio company EBITDA of $29M:
CCAP site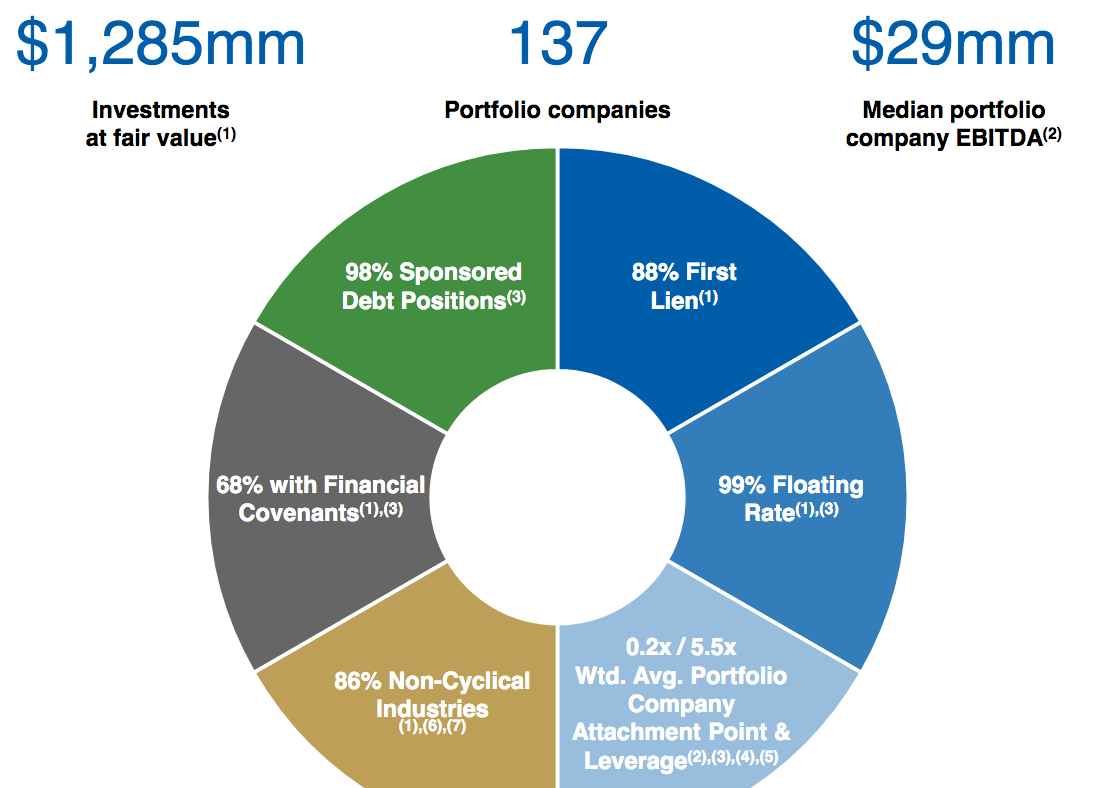
The top 3 industry exposures out of 18 continue to be in Healthcare, at 27%; Software & Services, at 22%; and Commercial & Professional Services, at 16%.
CCAP site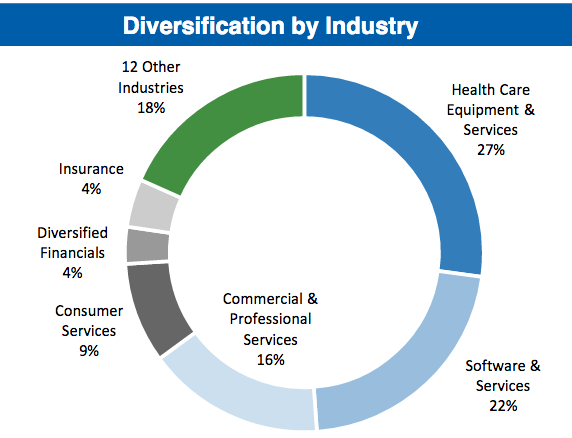
Portfolio Ratings:
Like most other BDCs, CCAP’s management rates its holdings on a quarterly basis. The scale is from 1 – the highest, to 4 & 5, the lowest. Tier 4 bottomed out in Q2 ’20, during the pandemic lockdowns, at 2.1% of the portfolio, with non-accruals improving to 1.1% as of 6/30/22. Upper tiers 1 & 2 have been steady, at 99%, since Q3 2021:
CCAP site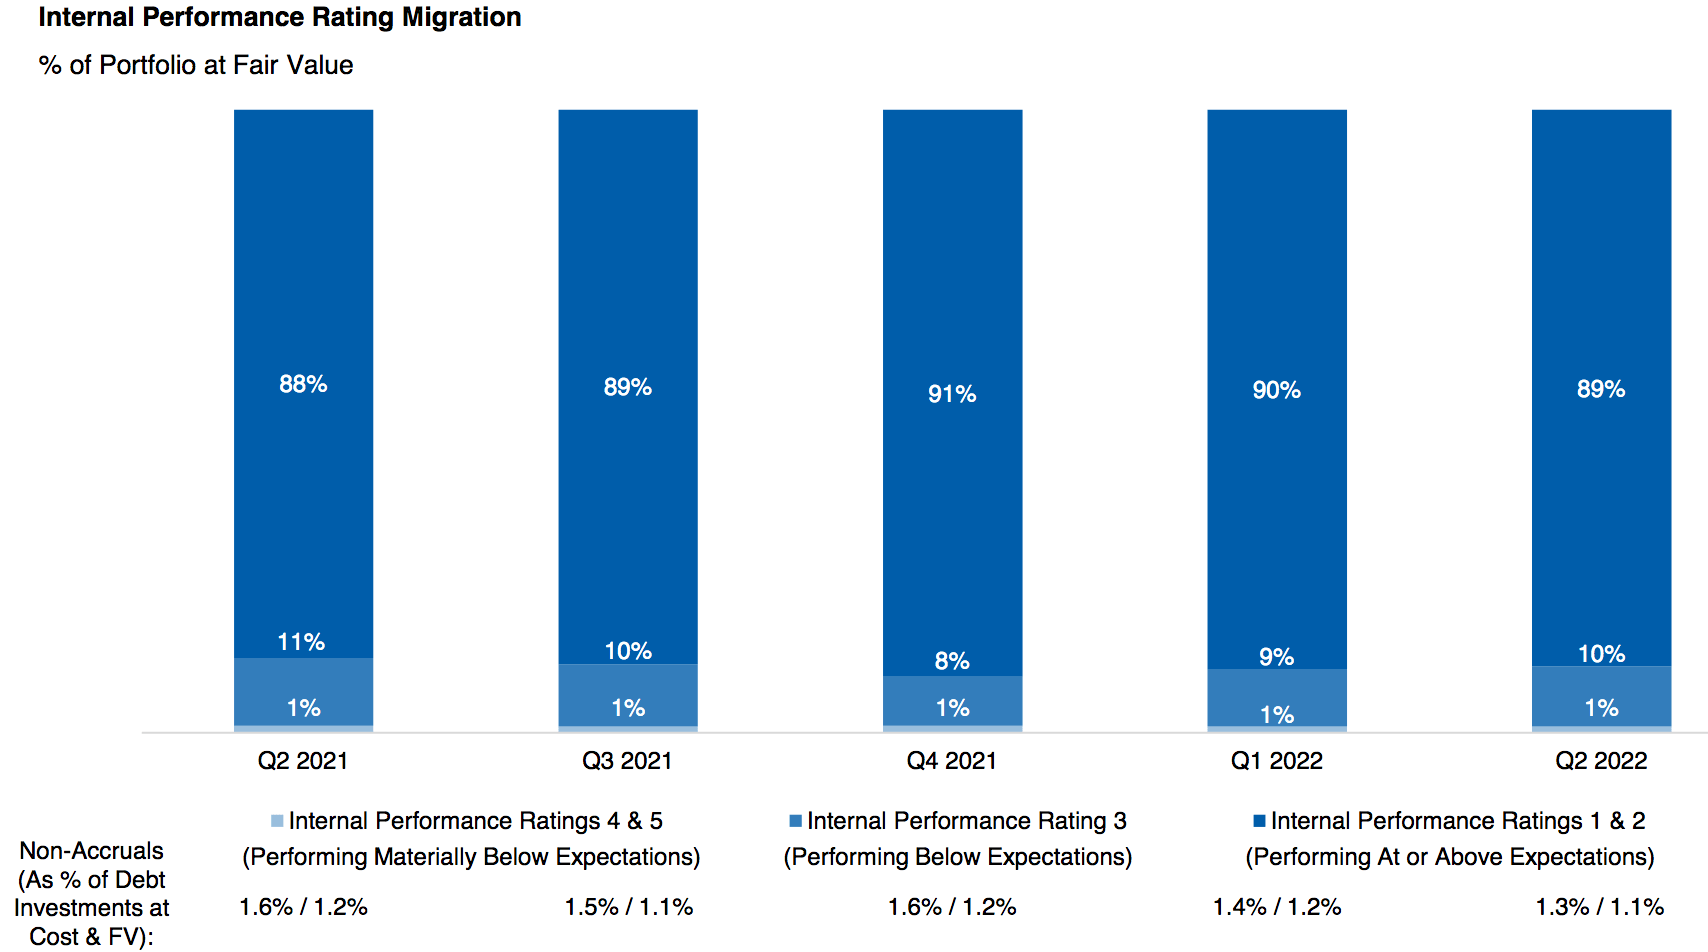
Earnings:
CCAP had good Q2 2022 earnings, with Total Investment Income rising 12%, to $26.7M, NII rising 41%, to $15.5M, and NII/Share up 28%, to $.50/share.
Management invested $112.4M across 11 new portfolio companies, 12 existing portfolio companies and several follow-on revolver and delayed draw fundings during Q2 ’22. CCAP had $97.1M in aggregate exits, sales and repayments in Q2 ’22.
Growth has been good in Q1-2 ’22, with total Investment Income up ~20%, NII up ~24%, and NII/Share up 11.25%. Realized Gains, which are lumpy on a quarterly basis, rose 57%, while Unrealized Gains fell from $27.66M to -$10.13M, relating to unrealized losses management took to reflect wider credit spreads in the market as volatility within the leveraged finance and equity markets continued during the second quarter. We’re seeing declines in Unrealized Gains from other BDCs in Q2 ’22, due to that market situation.
CCAP issued shares in Q4 ’21, which has brought the share count up by 9.7%.
Hidden Dividend Stocks Plus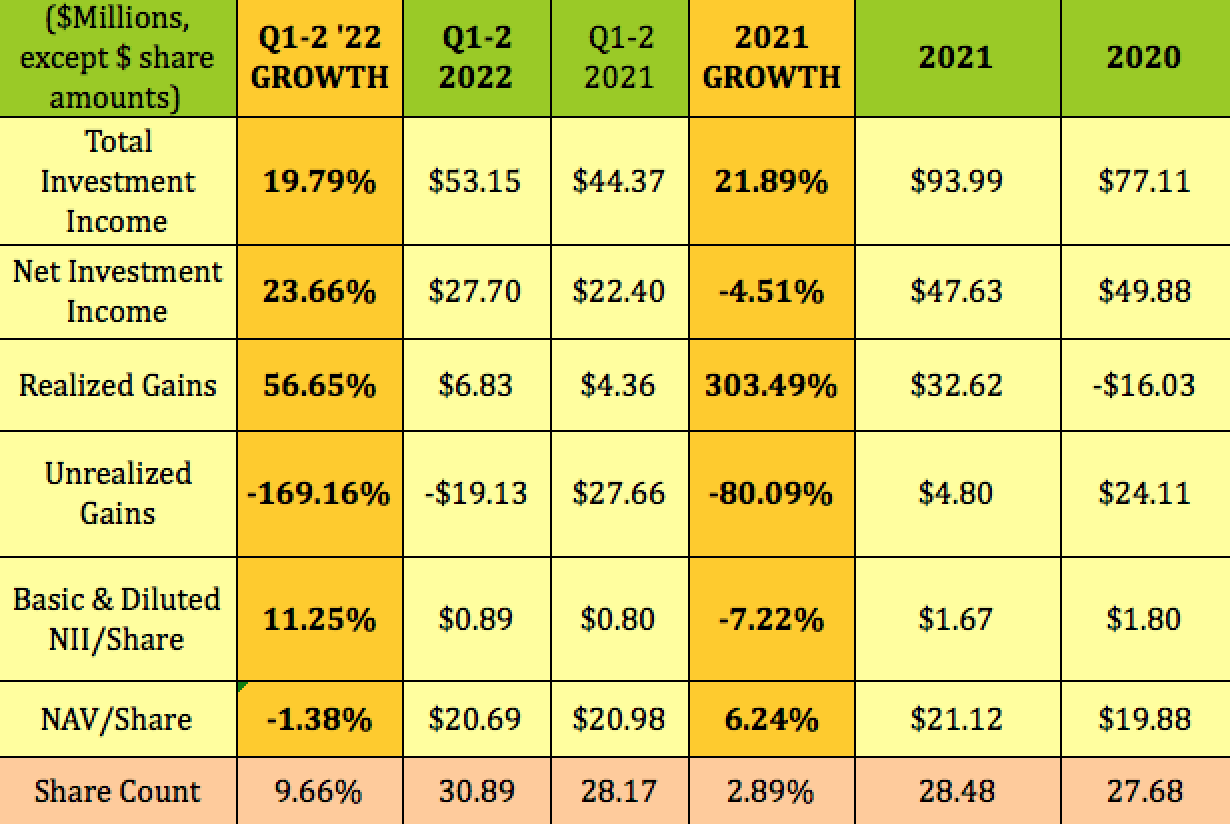
NAV/Share declined from $21.18 as of 3/31/22, to $20.69 in Q2 ’22, with those unrealized gains lowering it by $.47/share. The $.41 regular dividend and the $05 special dividend were covered by $.50/share in NII in Q2 ’22:
CCAP site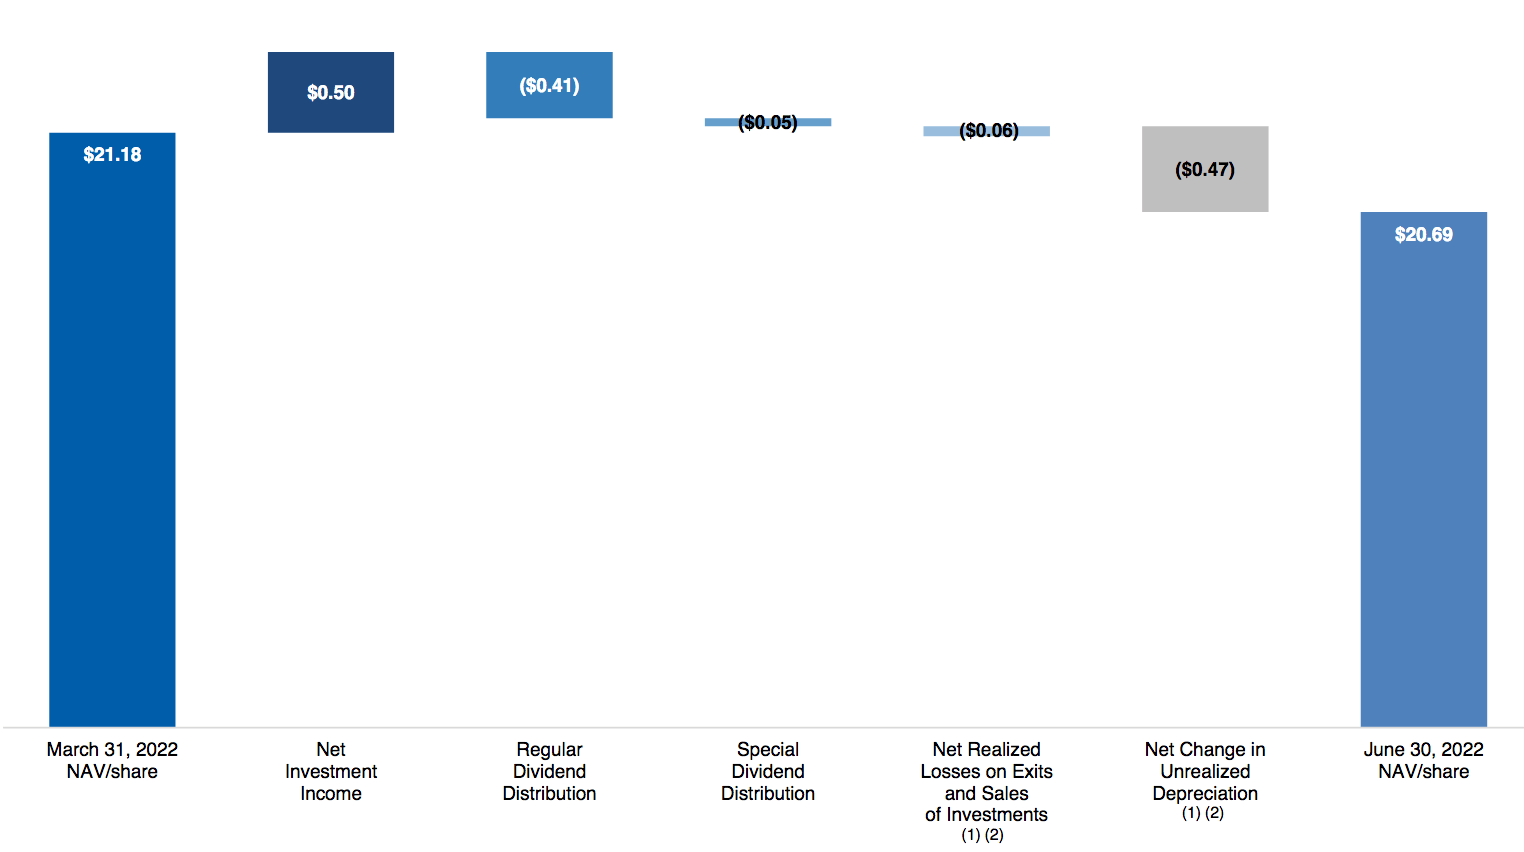
CCAP has paid out $9.91/share in dividends since its inception, while maintaining a pretty stable NAV/Share.
CCAP site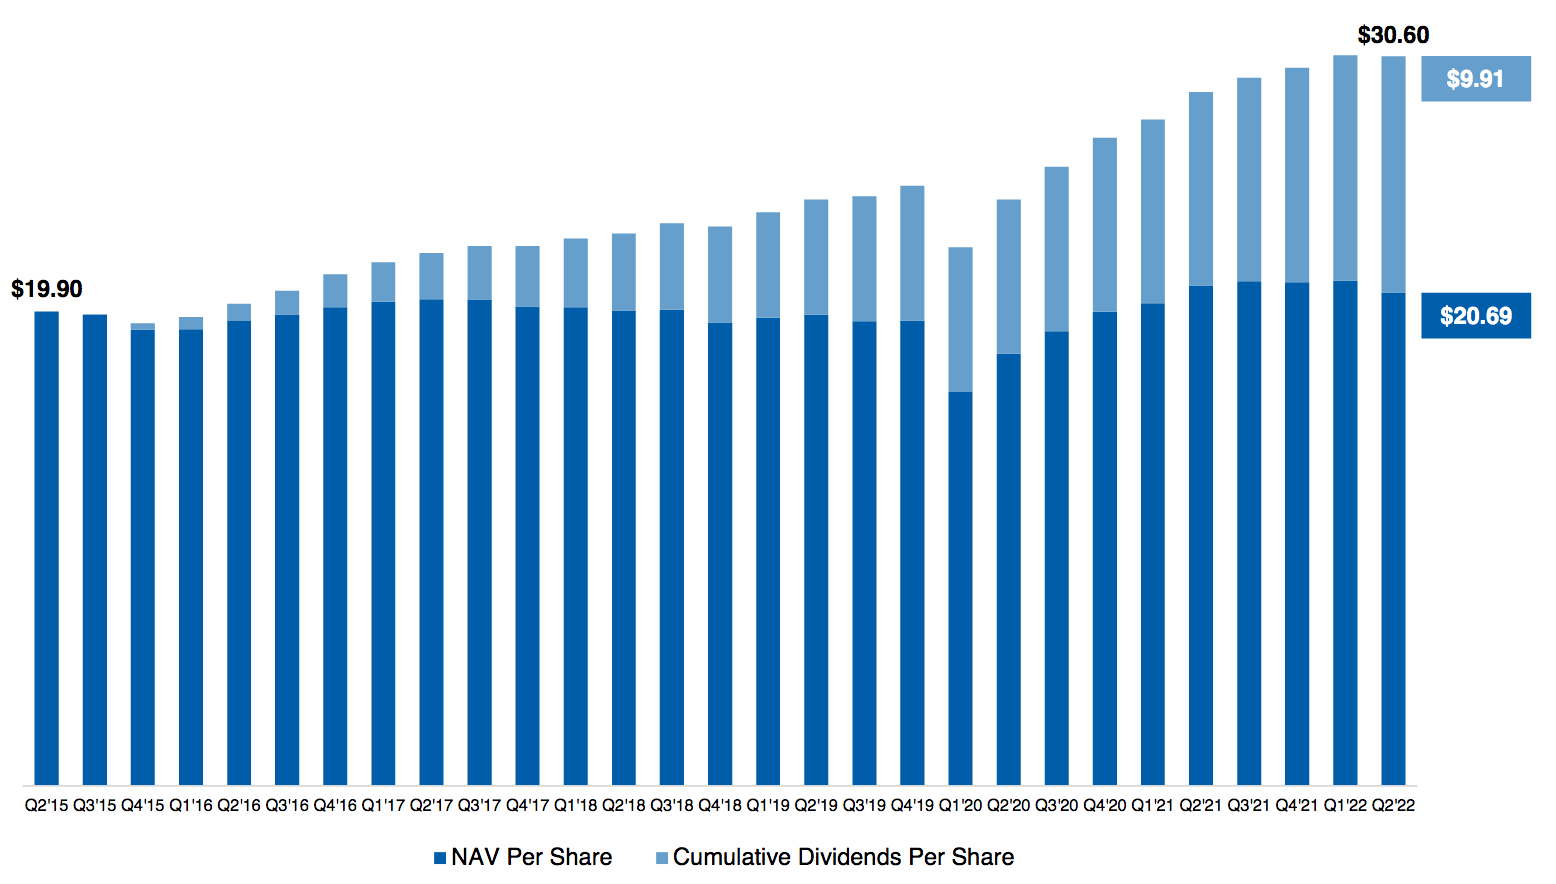
Dividends:
Management declared the regular $.41/share dividend, which will go ex-dividend on 9/29/22, with a 10/17/22 pay date. There was also a previously declared $.05/share dividend, which went ex-dividend on 9/1/22.
At its 9/8/22 closing price of $17.71, CCAP yields 9.26%:
Hidden Dividend Stocks Plus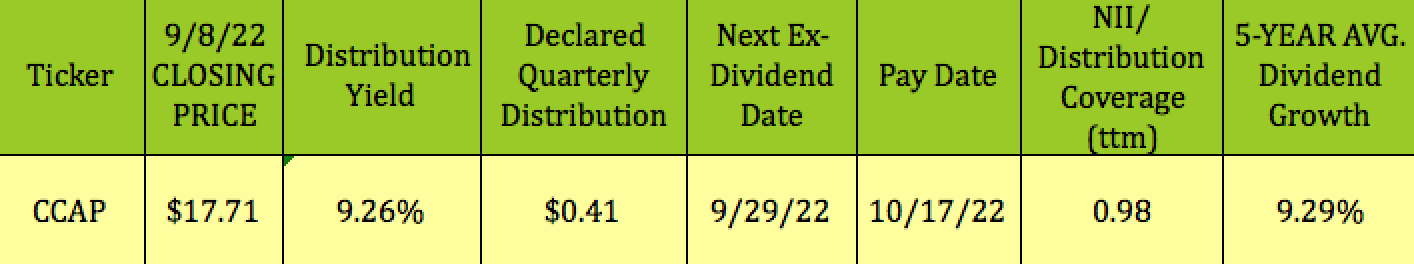
Like certain BDCs, CCAP has had incentive and management fee waivers in place over the past few years. However, these expired on 7/31/22. In Q2 ’22 there was a -$.09/share in capital gains based incentive fees, which decreased Adjusted Net Income, ANII, to $.41, vs. $.53 in Q2 ’21:
CCAP site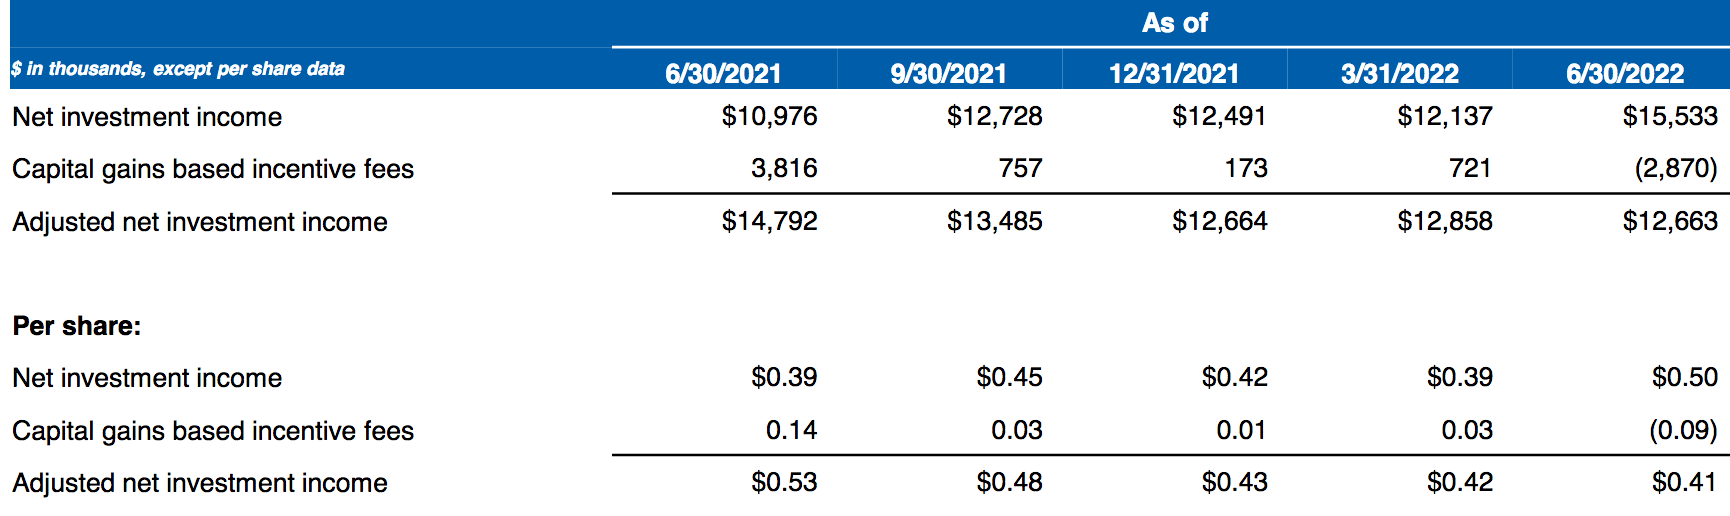
Profitability & Leverage:
ROA, ROE, and EBIT Margin improved in Q2 ’22, vs. Q4 ’21, with all remaining above BDC averages. Debt/NAV was a bit higher, at 1.02X, considerably lower than the BDC industry average of 1.26X. We may see management increase debt
Hidden Dividend Stocks Plus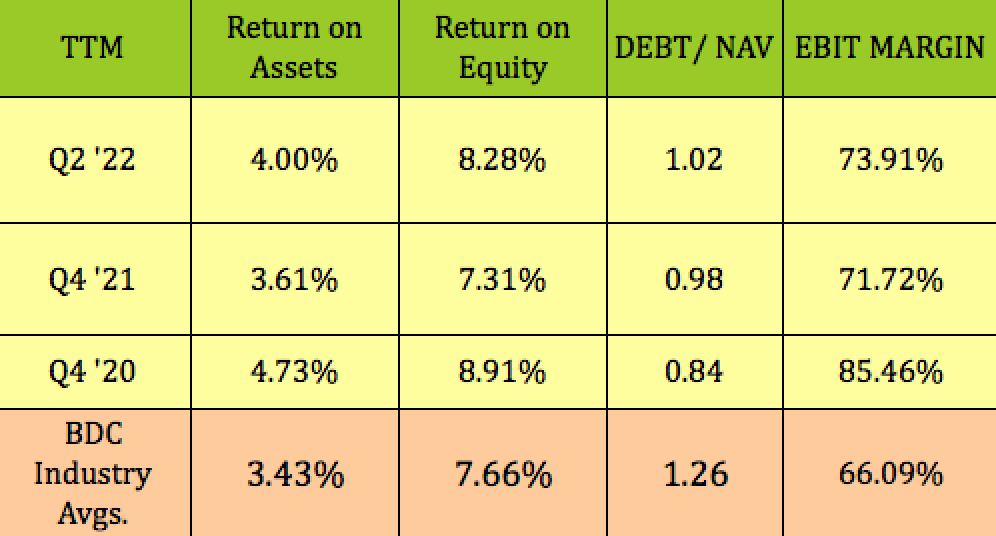
Debt:
CCAP’s debt ladder looks good, with only $50M in unsecured notes maturing in 2023. After that, the next maturity isn’t until 2026, when its Special Purpose Vehicle asset Credit Facility, its corporate Credit Facility, and its 2026 unsecured notes all come due.
As of 6/30/22, CCAP had $18.9M in cash and cash equivalents and restricted cash and $227.5M of undrawn capacity on its credit facilities.
CCAP site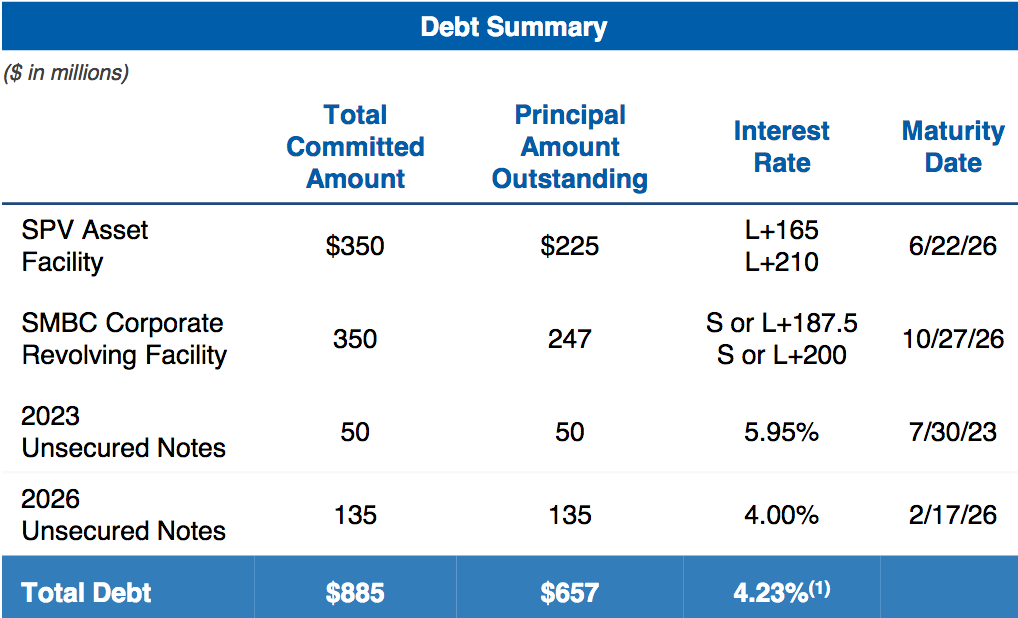
Valuations:
CCAP has a much lower Price/NAV valuation, of -14.40%, than the BDC industry average premium of 1%. But that’s not the whole valuation story on discounts.
Since NAV is affected by dividends, you should also look at the earnings multiple for BDCs, which is Price/NII per share. CCAP’s P/NII is 10.60, much lower than the BDC average of 13.52X.
Hidden Dividend Stocks Plus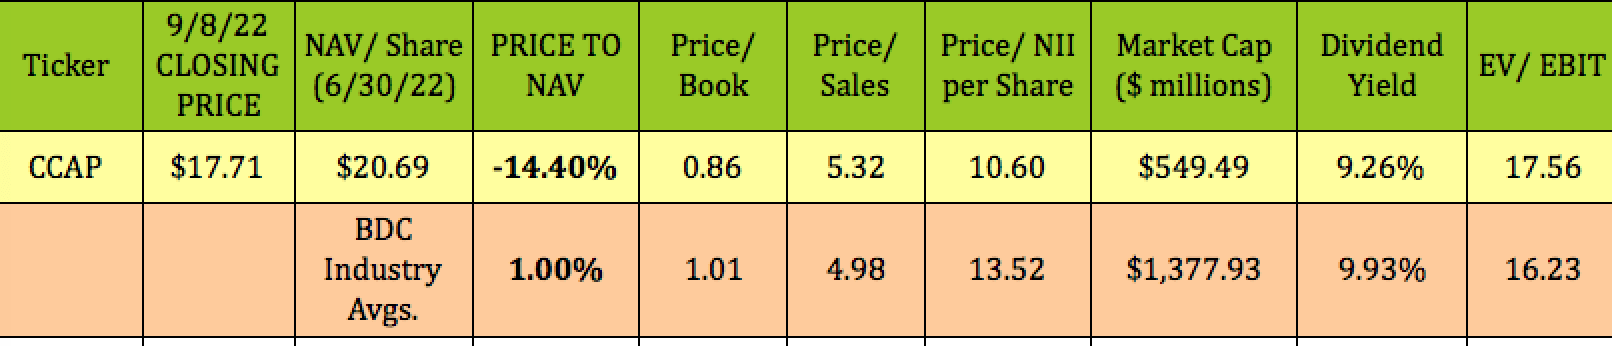
Parting Thoughts:
CCAP has one of the highest dividend growth rates in the BDC industry, at 9.29%. This industry isn’t known for dividend growth. In fact, there are many BDCs which have had negative dividend growth over the past 5 years.
We rate CCAP a BUY, based upon its dividend growth, value creation history, its attractive yield, its low Price/NII and P/NAV.
If you’re interested in other high yield vehicles, we cover them every Friday and Sunday in our articles.
All tables by Hidden Dividend Stocks Plus, except where otherwise noted.
Be the first to comment