

Dan Kitwood/Getty Images News
There has been a lot of doom and gloom surrounding European banks in the past few days, particularly Credit Suisse Group AG (CS). This has weighed heavily on risk sentiment.
Looking at the technical charts, I am starting to see a few correlations between vital markets.
For one, the chart of Credit Suisse is key – obviously, because everyone is focused on its troubles (or perceived troubles). Interestingly, CS rallied to put in a bullish reversal hammer on 3 October, arguably at the height of the media pessimism surrounding the stock. This hammer was formed when the stock price made a new low, but managed to recover to close at the day’s highs. Since then, we have seen decent follow through higher in the price.
Daily Chart: Credit Suisse
Tradingview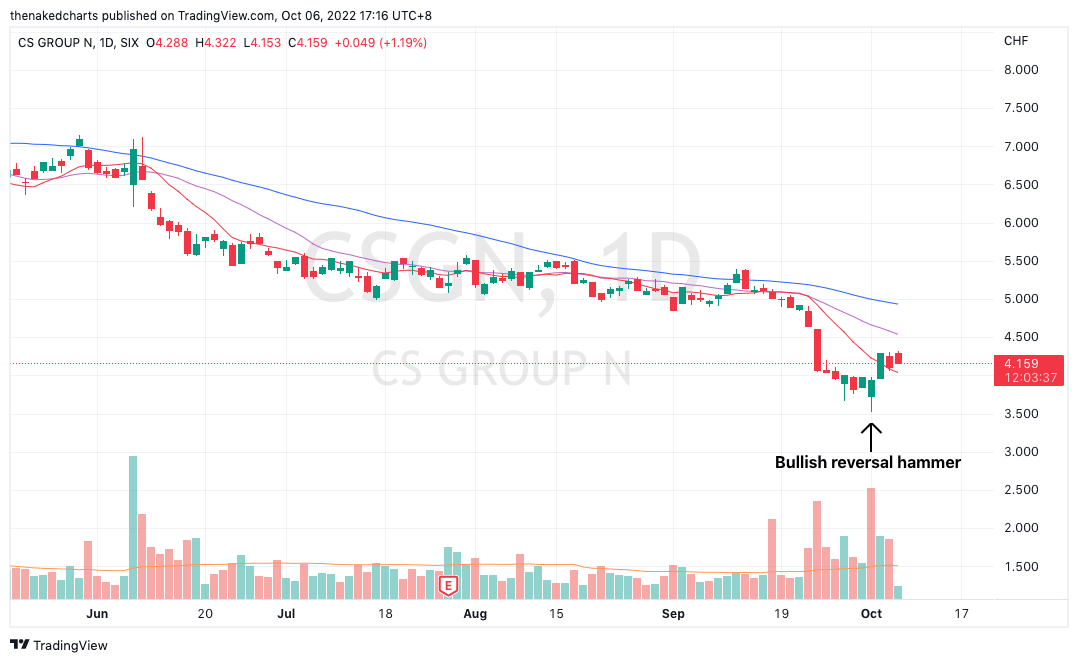
In the past few days, when CS stock rallied, yields actually moved lower. In the chart below, which shows the Eurozone 10-year yield and U.S. 10-year yield, both markets moved lower around the same time when CS stock made a near term bottom.
Chart of Credit Suisse (top panel) against Eurozone 10 Year Yield (middle panel) and US 10 Year Yield (bottom panel)
Tradingview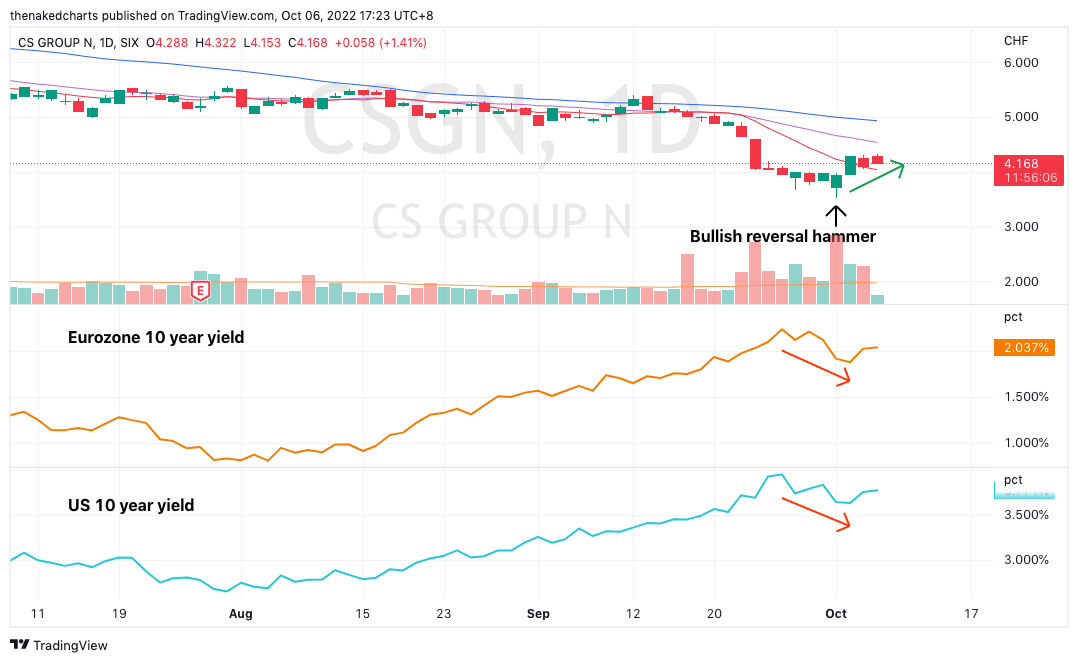
The direction of yields is extremely important. Higher yields have been suppressing risk sentiment, and have been leading to a strengthening U.S. dollar (“USD”) as a safe haven currency. In the past few months, it has been a case of higher yields, stronger USD, and lower equities.
Now, we are starting to see the market pricing in lower yields as a result of the Credit Suisse saga. The bank’s troubles (real or perceived) may lead central banks to go easy on credit conditions going forward; or, at least, that is what the market is starting to expect.
Another key observation is that the recovery in CS stock price also led to a rise in the euro against the USD. This could be due to less demand for USD as a safe haven currency, and/or improved risk sentiment in the Eurozone currency.
Chart of Credit Suisse (top panel) against EUR/USD(bottom panel)
Tradingview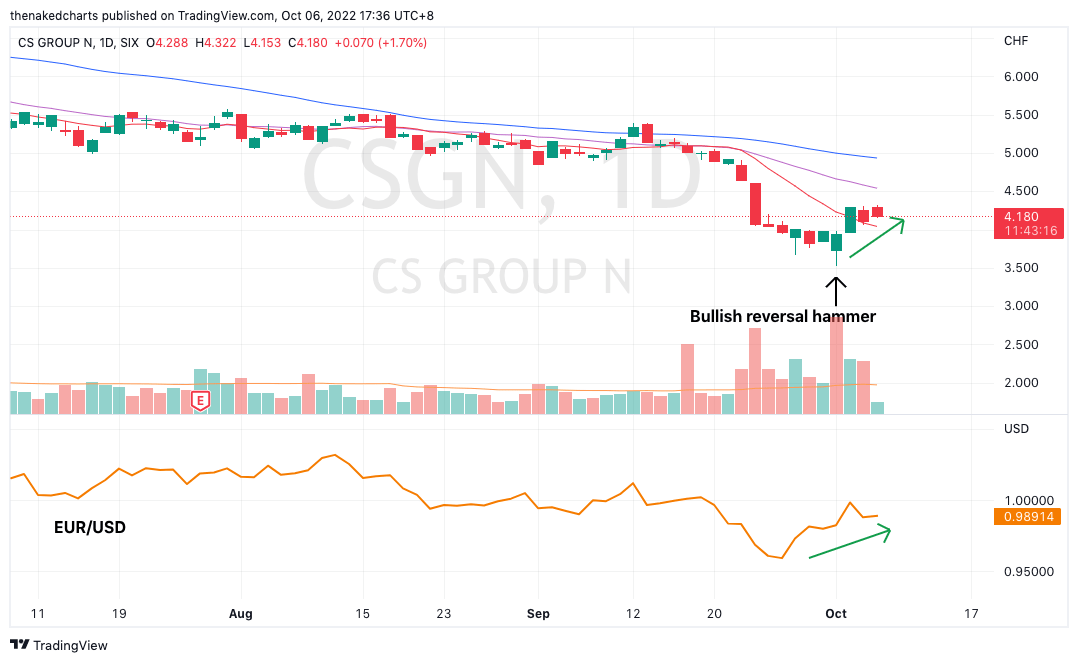
Nevertheless, the close correlation between yields and the USD still stands – that higher yields lead to a stronger USD, and vice versa. As mentioned, we need lower yields and a weaker USD for risk assets to bottom. The chart of CS may be a key cog in the future direction of yields and USD.
The Euro’s prospects against the USD is a crucial determinant for the Dollar Index because the euro is the largest constituent of this index. Looking at the chart of EUR/USD, the currency is now testing the top of its downtrend channel. The expectation is for it to turn lower here, but if we start to see consolidation at current levels, then it means the market may be gearing up for a breakout higher.
Daily Chart: EUR/USD
Tradingview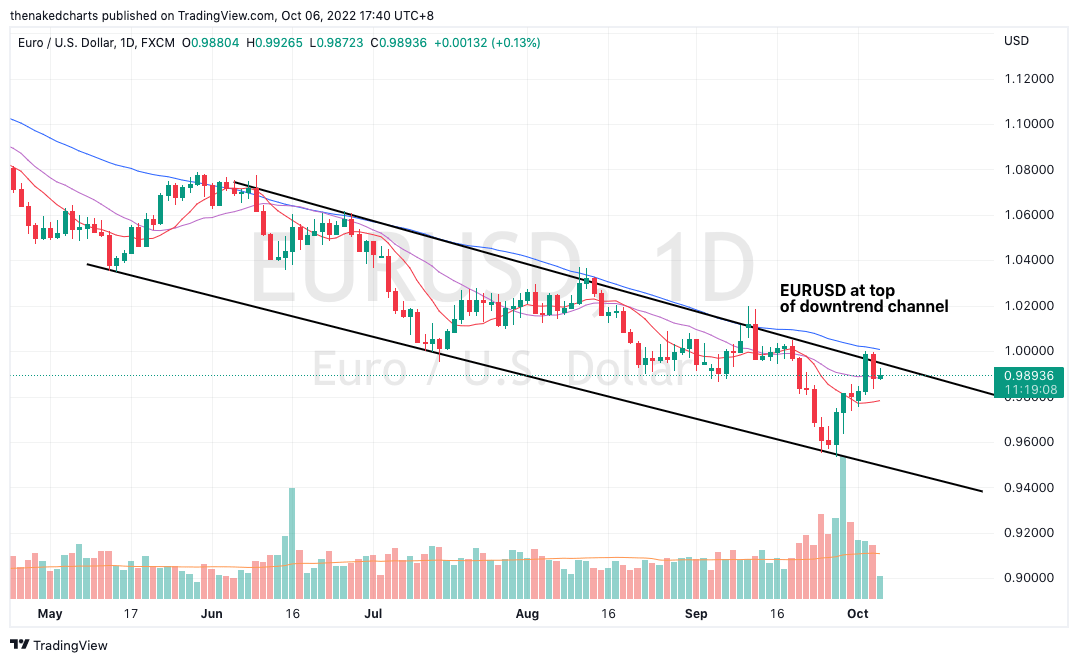
If EUR/USD breaks out higher, then that would be a positive sign for risk assets. I would then expect the USD’s vice grip against other major currencies to weaken. I would also expect CS stock to recover in tandem with the euro, which should also alleviate credit-related risks in the market, leading to lower yields. Modern day markets are intrinsically correlated, so I would not be surprised if these markets move in lockstep in the next few weeks.
Be the first to comment