

Dow Jones, Nasdaq 100, ASX 200, Risk Aversion, Delta Covid Variant, US-China Tensions – Asia Pacific Indices Briefing
- Dow Jones, S&P 500 and Nasdaq 100 sink as risk aversion continues
- Delta Covid variant, US-China geopolitical tensions souring mood
- ASX 200 may be vulnerable, eyeing RBA meeting minutes on Tuesday
Monday’s Wall Street Trading Session Recap
Risk aversion engulfed global financial markets to start off the trading week, arguably extending the somewhat pessimistic mood that wrapped up last week. On Wall Street, the Dow Jones, S&P 500 and tech-heavy Nasdaq Composite closed -2.09%, -1.59% and -1.06% respectively. Energy (-3.59%), financials (-2.8%) and materials (-2.13%) led declines in the S&P 500.
The reflationary trade is coming under fire alongside global growth estimates, with the 10-year Treasury yield dipping below 1.2% for the first time since February. This comes amid rising global coronavirus cases amid the more contagious Delta Covid variant as vaccination rates grow at uneven paces around the world. Last week’s disappointing US consumer sentiment may have also poured cold water on GDP growth bets.
A lack of prominent economic data during Monday’s Wall Street session likely placed investors’ focus on general market sentiment. Meanwhile, US-China geopolitical tensions are heating up. The US, UK and their allies blamed the Chinese government for the recent Microsoft Exchange hack. This could lead to retaliation from the world’s second-largest economy amid an arguably fragile economic environment.
Dow Jones Technical Analysis
Dow Jones futures sank to the 100-day Simple Moving Average (SMA) as the line acted as key support, maintaining the dominant upside focus. This is as the index rejected the key 34760 – 35000 resistance zone. A bounce off the SMA could place the focus back on that range. Otherwise, extending losses under the 100-day SMA may open the door to a material turn lower towards the June low.
Dow Jones Futures – Daily Chart
Nasdaq 100 Technical Analysis
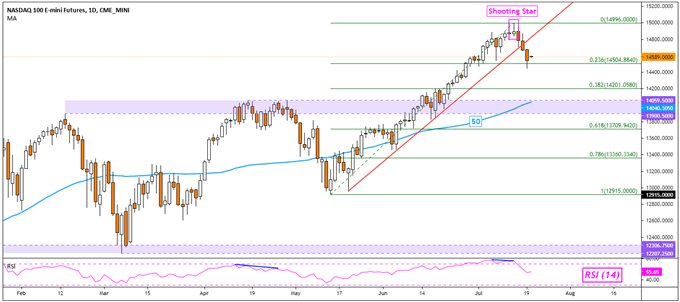
The Nasdaq 100 extended losses after a bearish Shooting Star candlestick pattern emerged last week. Prices took out and subsequently confirmed a break under the near-term rising trendline from May. That may open the door to further losses towards the 50-day SMA. At that point, this line could act as key support and maintain a broader upside focus back towards the all-time high.
Nasdaq 100 – Daily Chart
Tuesday’s Asia Pacific Trading Session
Tuesday’s Asia-Pacific trading session is also looking pretty quiet as the new week gets underway. This may continue placing the focus for investors on general market mood. With that in mind, regional benchmark indices, such as the ASX 200, Nikkei 225 and KOSPI, may follow the pessimistic Wall Street lead. On the other hand, traders may also take a breather and use dips in equities as rebalancing opportunities amid a still-lose global monetary policy environment. RBA minutes of the July meeting are on tap for Australia’s ASX 200, where the central bank’s still-dovish tone could offer support to local equities.
ASX 200 Technical Analysis
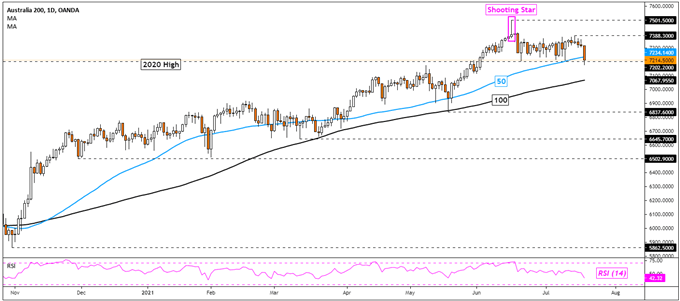
The ASX 200 took out the 50-day SMA, exposing the 100-day line. Still, confirmation of the breakout is lacking as prices once again face the former 2020 high at 7202. This price may act as a key inflection point, opening the door to a bounce back towards the all-time high. Still, the Shooting Star candle, established back in June, continues to carry bearish undertones.
ASX 200 – Daily Chart
— Written by Daniel Dubrovsky, Strategist for DailyFX.com
To contact Daniel, use the comments section below or @ddubrovskyFX on Twitter
Be the first to comment