


Mongkol Onnuan
This article was first released to Systematic Income subscribers and free trials on Jan. 11.
Income investors are often told to diversify their portfolios. One simple way to do it is to hold both equity and fixed-income exposure like the traditional 60/40 approach. Although high-quality bonds and stocks don’t always offset each other – 2022 was a good example when they both fell – in more cases than not they do. One annoying feature of stocks, however, is the typically puny yields on offer from the asset class.
A popular way to solve the problem of low equity yields is to hold covered call funds which are baskets of stocks (or stock index exposure) with written (i.e. short) calls. Covered calls look like a slam dunk because they seem just like stocks but with higher yields and less risk. Higher yields come from the additional income earned from overwritten calls and lower risk comes from the fact that extra income cushions some of the drop in stocks during drawdowns.
In this article we investigate covered call strategies of CEFs and, specifically, whether it’s reasonable to view covered calls as “stocks but with less risk.” Our conclusion is that the covered call strategy creates a large performance drag vs. stocks that makes this statement incorrect. A better description of covered call CEFs is “60-70% like stocks with a bit less risk occasionally.”
In the end there’s nothing wrong with holding covered call CEFs but investors should be clear-eyed that the strategy is very likely going to significantly lag the underlying stock portfolio over the longer term if future equity market returns look more or less like that of the last several decades, featuring significant mean reversion and uptrending returns. At the same time the lower risk profile of covered calls over stocks is not particularly impressive particularly for covered call CEF which often underperform their underlying equity portfolios due to widening discounts in periods of negative stock returns.
Are Covered Calls “Stocks With Less Risk”
One curious aspect of covered call funds has to do with the performance of its benchmark indices – an aspect of the strategy that often goes unmentioned by covered call advocates.
Typically, investors are sold on a particular strategy by how well it does over the longer term relative to another reasonable alternative. For instance, value managers pitch value stocks as the best way to allocate to stocks because value investing has stood the test of time and outperforms over the very long term. Growth managers, instead, point to high-flying companies that are looking to revolutionize some aspect of modern life and will reward investors down the line with superior returns and so on.
What’s curious about covered call strategies is that no one pitches them as superior total return alternatives to stocks. The reason for this is clear – over the longer term covered call strategies significantly lag stocks. This may sound like a controversial statement but, in fact, CBOE has taken all controversy out of it by putting together benchmark indices for call writing (a.k.a. buy-write) strategies shown in the table below. These strategies are all based on the S&P 500 index but use slightly different approaches to selecting which options to sell.
| BOE Index |
Investment Strategy |
| BXM | S&P 500 ATM BuyWrite Index |
| BXMD | S&P 500 30-Delta BuyWrite Index |
| PUT | S&P 500 ATM PutWrite Index |
| BXY | S&P 500 2% OTM BuyWrite Index |
| BXMC | S&P 500 Conditional BuyWrite Index |
| BXMW | S&P 500 Multi-Week BuyWrite Index |
If we look at the longer-term profile of these strategies against the S&P 500 we see that they don’t even come close. Over the last decade these strategies lag the S&P 500 by 3-6% per annum.
Systematic Income
It’s certainly possible (theoretically at least) to construct strategies that do better than this, however, the reasons for underperformance are structural rather than tactical. In other words, it’s the nature of covered call strategies that drive this wedge between them and stocks rather than the individual details for how they manage the options portfolio.
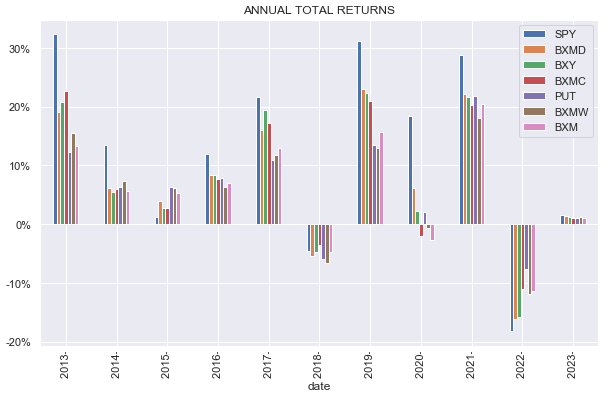
These structural issues are two fold. One, covered calls sell away upside, which is quite valuable during strong years. And two, covered call strategies underperform further during periods of high mean reversion i.e. when stocks move up and down quite a lot, rather than trend in a stable fashion (2020 is a particularly good case study when covered calls finished flat but stocks zoomed higher). This combination presents a significant headwind for covered call funds.
The chart below shows that in years when equity returns are very strong (e.g. 2013, 2019, 2021), stocks often outperform covered call strategies by 10-20%. And in the years when stocks are down, covered call strategies outperform stocks by 1-11%.
Systematic Income
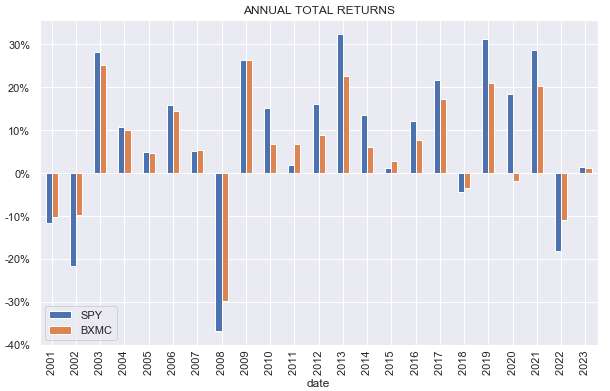
The chart below shows a longer period using BXMC as the covered call strategy since not all strategies are backdated to 2000.
Systematic Income
Fewer years of smaller outperformance versus more years of greater underperformance sums up to a growing wedge between covered call strategies and their underlying equity portfolios over time. This situation will only change if stocks keep moving lower over time. This is certainly possible but unlikely and in any case the absolute performance of covered call strategies in this scenario would still be very poor even if not as bad as that of pure equities.
Many investors focus on the downside outperformance of covered call funds and use this to conclude that covered calls are just like stocks but with better downside control or with lower risk. As discussed, the reality is very different. If it were true, covered call funds would generate as much upside performance as stocks but with less downside. What actually happens is that covered calls generate much less upside than stocks and this gap to the upside is much larger than their outperformance gap to the downside. Furthermore, historically, there have been many more up years for stocks than down years.
These two factors (there being more up than down years for stocks and covered calls having a larger upside performance gap vs. stocks than their downside outperformance) add up to generate fairly consistent and large underperformance to funds that just hold stocks.
There are two things that investors may respond with.
One is to say that, well, I only allocate to covered call funds when I expect stocks to move lower. On paper that sounds like a great strategy, however it assumes that investors can nail the years when stocks go down. Any investor who can do this with high regularity should either be shorting stocks in those years or certainly avoiding covered calls since covered call strategies have generated negative returns this century when stocks finished lower.
Something else investors can respond with to this analysis is to dismiss this focus on total returns and focus instead on the “cold, hard cash” of covered call funds. It’s incontrovertible that covered call funds have yields that are miles above their equity counterparts due to the additional income they generate for selling calls.
However, it’s important not to forget that there is, in fact, a direct link between income and the capital base of the portfolio. The higher the capital base the more income that capital can support.
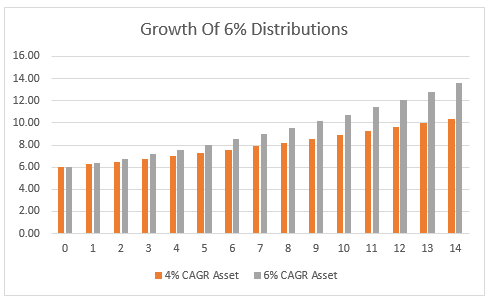
We can illustrate this with the following chart which shows 6% annual distributions from two funds that start from $100 and grow at different rates of return – one at 4% and another at 6%. At the end of 15 years one fund is able to deliver distributions a third higher than the other fund. What this shows is that over the longer term the apparent yield deficit between covered call and equity funds will close due to the stronger total returns of the pure equity strategy (assuming stocks don’t fall over the longer term). In short the higher yield of covered call strategies is financed in large part by borrowing from future total returns.
Systematic Income
The key takeaway of this section is that investors should stop thinking of covered call funds as “equity with less risk” for the simple reason that covered call strategies don’t deliver anything like long-term equity returns. In other words, covered calls should be viewed as a different asset class.
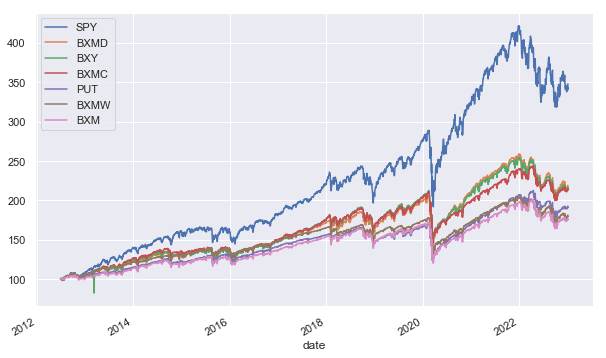
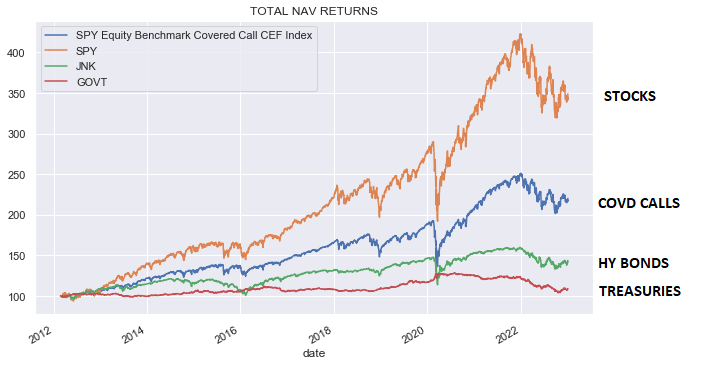
We can illustrate this another way by plotting returns of four assets over the last decade: SPY (orange line), covered call CEFs (blue line), high-yield corporate bonds (green line – proxied by JNK) and Treasuries (red line, proxied by GOVT).
The differences between the total returns of these assets shows that saying covered calls are like stocks with less risk is sort of like saying high-yield bonds are like covered calls but with less risk. Covered calls are a distinct strategy that happens to hold stocks, however, investors shouldn’t confuse it with stocks.
Systematic Income
It’s clear that the high yields of covered calls are very attractive, especially relative to the puny yields of most equity funds. However, for investors with a fairly upbeat view on stocks over the longer term, it can make more sense to manufacture their own yields by selling a little of their equity positions over time rather than use covered call funds despite their greater convenience.
Finally, let’s have a quick look at actual covered call CEFs. As the chart immediately above suggests, covered call CEFs have significantly lagged the S&P 500 over the last decade. In some sense this is not a fair comparison because not all covered call CEFs benchmark against the S&P 500. Some benchmark against the Nasdaq 100, others against global MSCI indices and some have no benchmark at all.
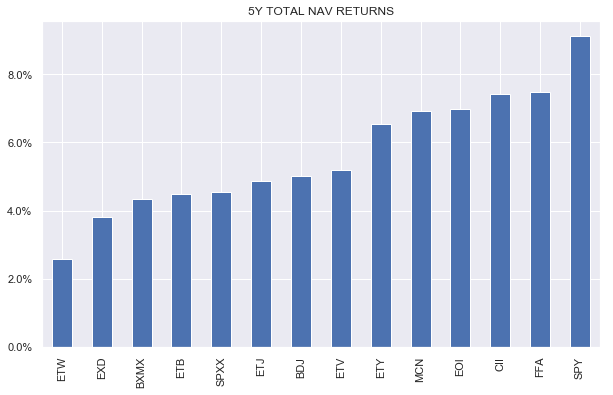
For a fairer comparison we selected only funds using the S&P 500 as their equity benchmark. The following table shows five-year total NAV returns with the S&P 500 beating all funds by a healthy margin and the average fund by around 3.5% per annum. 10Y total NAV returns look slightly worse with the gap to the average S&P 500 benchmarked covered call CEF rising to more than 4% per annum.
Systematic Income
Where Are We Now?
As we mentioned above there is nothing wrong with holding covered calls so long as investors view it as a different asset class. As it happens we don’t find the risk/reward particularly compelling so we don’t hold any in our Income Portfolios. At the same time we encourage investors to hold equity exposure via open-end equity funds as a way to balance out fixed-income / credit exposure.
That said, for investors who find covered calls compelling there are three primary factors that we find useful in guiding an allocation to the sector.
One is the same metric that is used for allocation to stocks – current valuations or P/E to be more precise. This is because covered call funds have exposure to stocks, mitigated in part by additional income from selling calls.
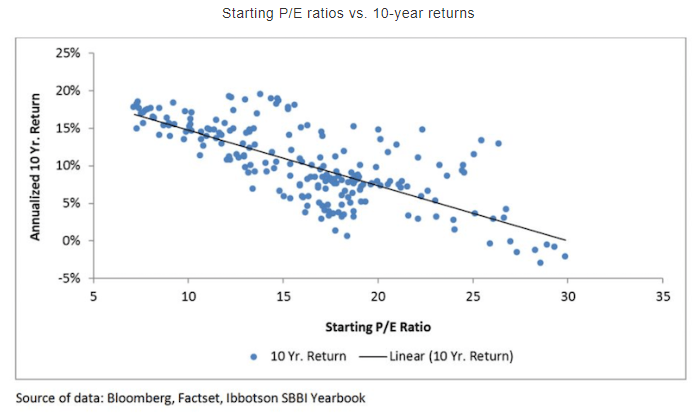
The reason P/E can be useful is that it has a decent relationship with longer-term stock returns as the following chart shows. Not surprisingly, the higher the starting valuation, the lower the subsequent 10Y returns. Admittedly, the same metric is less useful for forecasting returns over a shorter-period.
daytrading.com
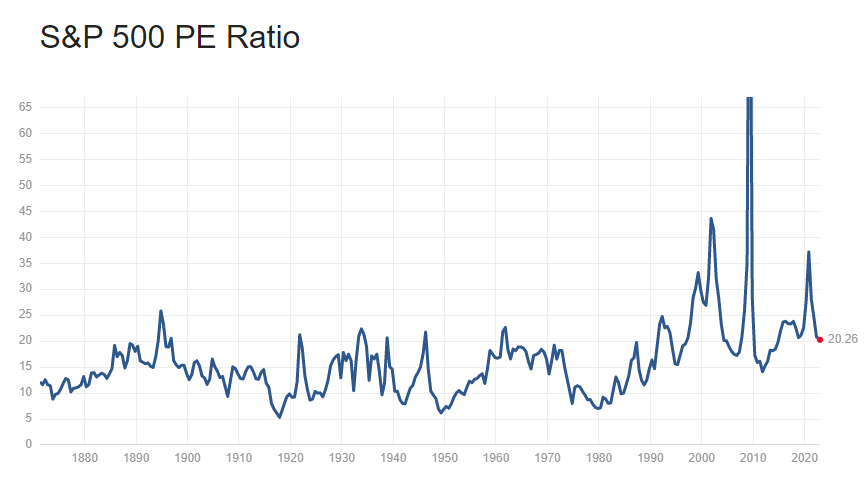
The following chart shows the current valuation of the S&P 500 index. It’s currently around 20. This is clearly well off its recent peak but still above its long-term average. This also is in the context of earnings that the consensus expects to keep moving lower over the rest of the year, something which could weigh on stocks (since it would mechanically raise the P/E at current equity prices). Historically, this has translated into 5-10% 10Y returns. In short, this metric is neutral.
multpl.com
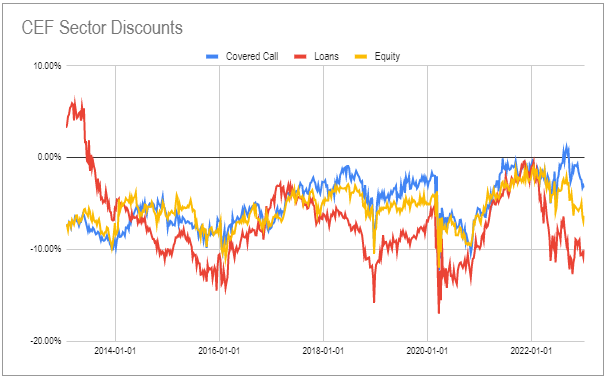
The second metric for guiding an allocation to covered call CEFs are CEF discounts. On this metric, the sector (blue line) looks very expensive in both absolute terms (it’s barely trading at a discount in aggregate) as well as relative to other sectors. In fact, few other sectors trade at tighter discounts than the Covered Call sector. There are covered call CEFs that trade at wide discounts, however, on average the sector looks expensive on this metric.
Systematic Income CEF Tool
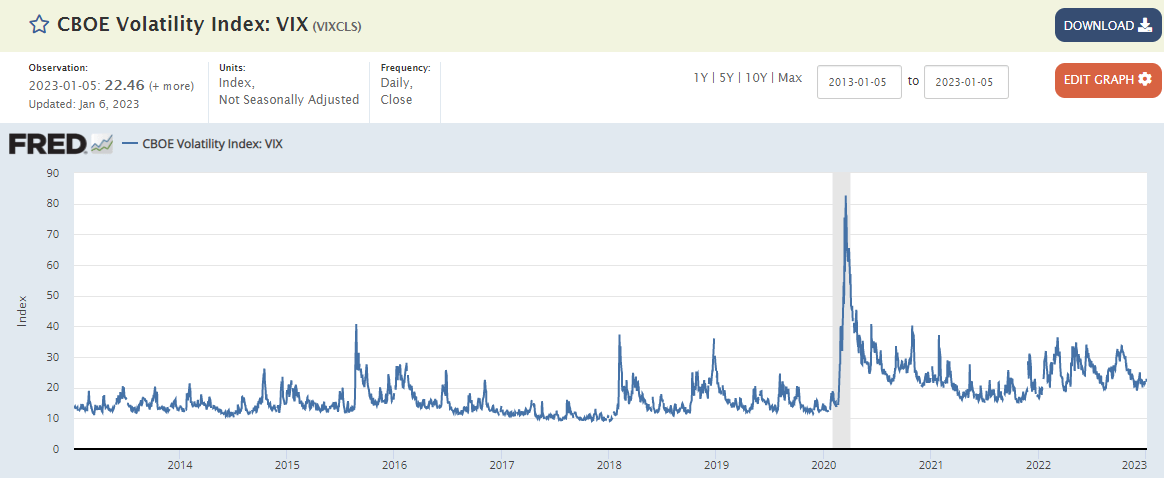
The final metric, which is often surprisingly absent in covered call commentary, is the level of implied volatility which is simply the compensation for selling equity options – the core strategy of covered call funds.
On this metric, the current level of the VIX of 22.46 is fairly low for the post-COVID market environment but decent relative to the longer-term environment. The question is which environment is more applicable to the future market – arguably, the more recent environment of higher inflation, market volatility and higher interest rates is the more reasonable one to use. This metric is unattractive-to-neutral for allocating to covered call funds today.
FRED
Takeaways
History has clearly shown that the view of covered call CEFs of being “like stocks but with less risk” is much too simplistic. It’s compelling however as it seems to let investors have their cake and eat it too. The reality is different. First, covered calls are well and truly not “stocks” and not just because of the added options but because of significantly lower long-term returns.
On the return side of the equation, covered call CEFs have underperformed their equity benchmarks by 2-7% per annum historically. On the risk part of the equation, while covered call ETFs and covered call CEF total NAV returns do tend to outperform equities during down years, covered call CEF total price returns tend not to because discounts typically widen when stocks fall.
Another very important point is that the outperformance during down years is much less than the underperformance in up years. In short, a covered call CEF NAV may outperform by 1% in a down stock year but underperform by 5% in a strong up year. When you string those together you get long-term underperformance, particularly when there are more up than down years.
In short, the common view that covered call CEFs are just like stocks with less risk is not really true. A better way to say it is that covered call CEFs are like half stocks with nearly all the risk. Investors who want to have equity exposure should just hold stocks – the higher yield of covered call CEFs comes at the expense of significant underperformance over time.
Be the first to comment