

6381380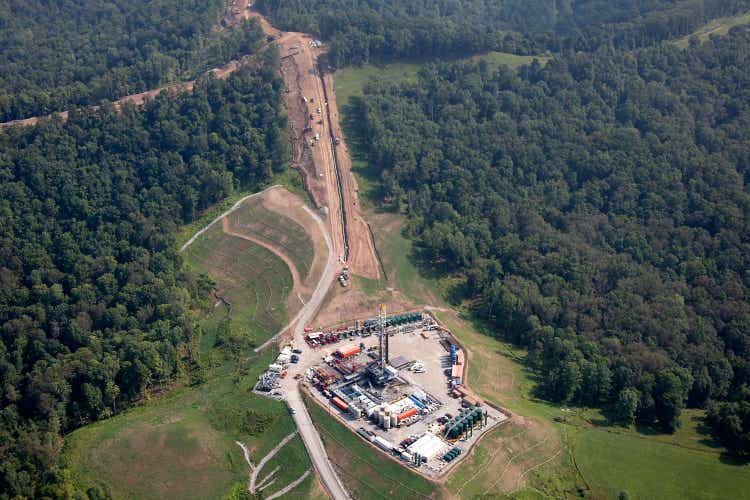
Coterra Energy’s (NYSE:CTRA) net income popped in the first nine months of 2022. However, according to the current market condition and gas and oil market outlook, I expect CTRA’s 4Q 2022 and 1Q 2023 financial results to be weaker than 3Q 2022. In the third quarter of 2022, Natural gas accounted for 73% and 62% of Coterra Energy’s production and revenue. The company’s natural gas production in the fourth quarter of 2022 is estimated to be lower than in 3Q 2022. Also, U.S. natural gas prices dropped in the fourth quarter of 2022. Also, due to rising U.S. natural gas production, natural gas prices are not expected to increase in the following months. Moreover, the oil market outlook is not as strong as before. However, the company’s debt and return ratios indicate that Coterra Energy is financially healthy. Thus CTRA is able to stay profitable and meet its obligations. The stock is a hold.
Quarterly outlook
In its 3Q 2022 financial results, CTRA reported natural gas revenues of $1644 million, compared with 2Q 2022 operating revenues of $1468 million. The company’s 3Q 2022 oil revenues decreased from $876 million in 2Q 2022 to $755 million in 3Q 2022. Also, its NGL revenues decreased from $280 million in 2Q 2022 to $259 million in 3Q 2022. CTRA reported a net income of $1196 million, or $1.51 per share in the third quarter of 2022, compared with $1229 million, or $1.53 per share in the previous quarter. However, the company’s adjusted net income increased from $1083 million in 2Q 2022 to $1126 million in 3Q 2022 as its gain on derivative instruments decreased from $227 million in 2Q 2022 to $103 million in 3Q 2022.
CTRA’s cash flow from operating activities increased from $879 million in 2Q 2022 to $1771 in 3Q 2022. Driven by changes in the company’s assets and liabilities, CTRA reported a discretionary cash flow of $1524 million in 3Q 2022, compared with $1493 million in 2Q 2022. CTRA cash paid for capital expenditures decreased from $474 million in 2Q 2022 to $460 million in 3Q 2022. As a result, the company’s free cash flow increased from $1019 million on 30 June 2022 to $1064 million on 30 September 2022. “Coterra continues to execute and has delivered another strong operational quarter with outsized shareholder returns,” the CEO commented. “As a low-cost operator of diversified, top-tier assets, and with a market-leading balance sheet, Coterra is positioned to succeed through cycles,” he continued.
The market outlook
CTRA reported natural gas, oil, and NGL production volumes of 258.2 Bcf, 8.1 MMBbl, and 7.9 MMBbl, respectively. The company’s natural gas production is mainly driven by its operations in the Marcellus Shale. On the other hand, its oil and NGL productions are mainly driven by the company’s operations in the Permian Basin (see Figure 1). “Coterra is currently running six rigs and two completion crews in the Permian Basin and three rigs and one completion crew in the Marcellus,” the company stated. In the fourth quarter of 2022, CTRA expects its oil production volumes to be between 86 to 89 MBopd (compared to 87.9 MBopd in 3Q 2022). Also, CTRA expects its 4Q 2022 natural gas production to average between 2725 and 2775 MMcfpd (compared with 2807 MMcfpd in 3Q 2022).
Figure 1 – CTRA’s production volumes
3Q 2022 financial results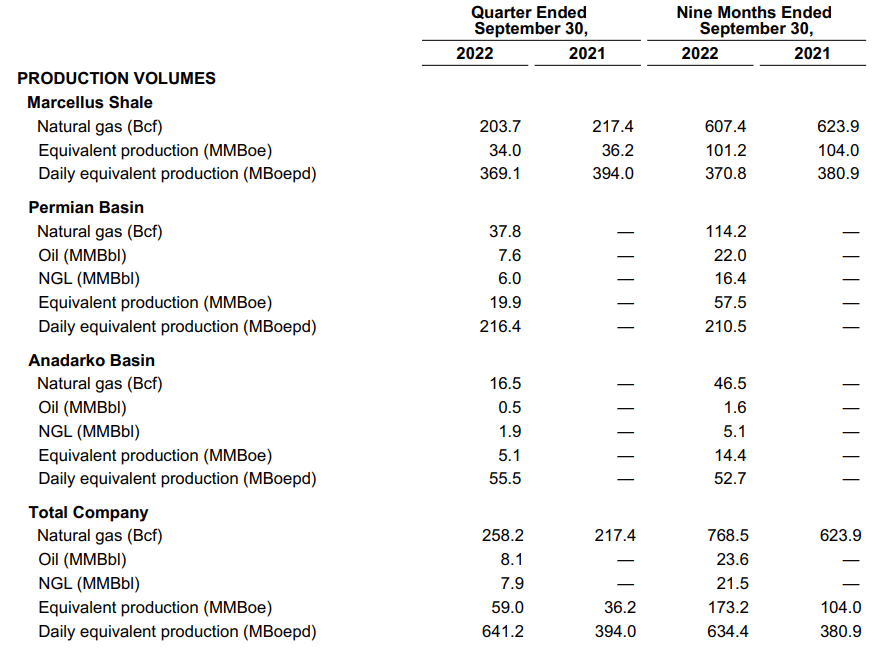
According to EIA’s short-term energy outlook, due to rising U.S. natural gas production, U.S. natural gas storage levels will move closer to the previous five-year average in the following months. EIA expects U.S. natural gas production to increase from 98.13 Bcfpd in 2022 to 100.38 Bcfpd in 2023. Also, it is worth noting that in the fourth quarter of 2022, U.S. dry natural gas production was 100.54 Bcfpd, compared with 99.21 Bcfpd in 3Q 2022.
Due to smaller-than-expected storage draw, warmer-than-expected weather in January, and the restart delay of the Freeport LNG export plant to the second half of January (which means more gas for the domestic market), natural gas prices in the United States decreased to their lowest levels in the past year (see Figure 3).
Figure 2 – U.S. dry natural gas production
eia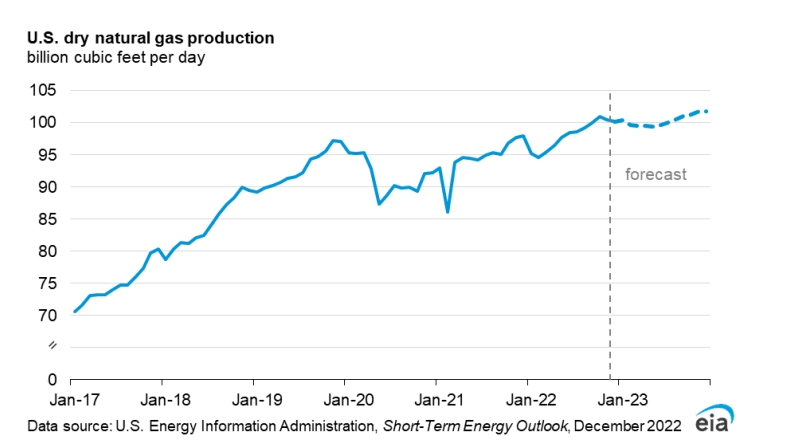
Figure 3 – U.S. natural gas price
tradingeconomics.com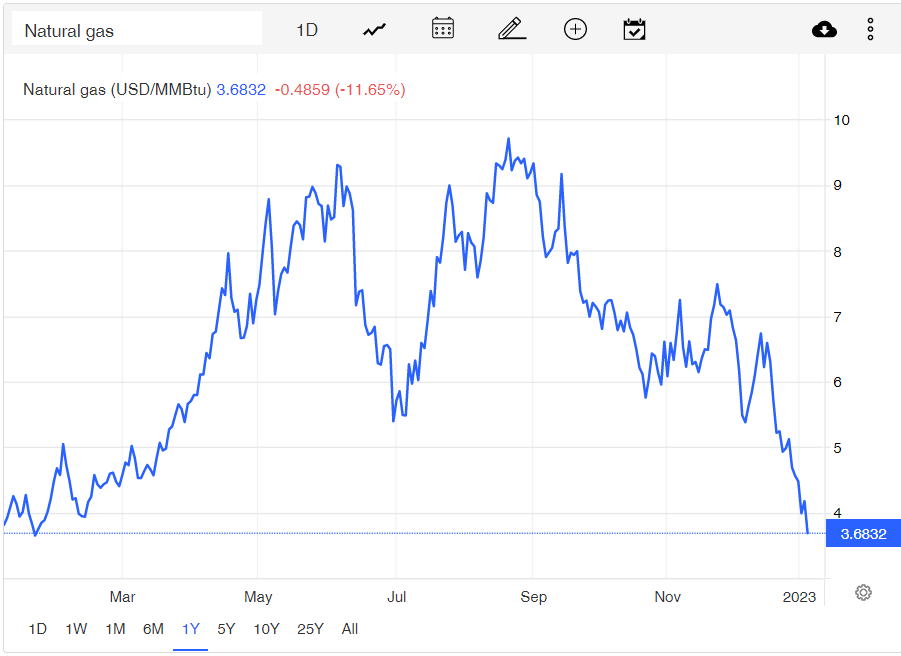
According to Figure 4, EIA projects that International petroleum and other liquids production will decrease to below 101 mb/d in the first half of 2023. However, in the second half of 2023, total world petroleum and other liquids production will increase again. In the United States, petroleum and other liquids production is expected to increase further in the first half of 2023. It is worth noting that U.S. petroleum and other liquids production in 4Q 2022 was higher than in 3Q 2022.
According to EIA’s drilling productivity report, oil production in the Permian Basin in January 2023 is projected to be 37 thousand barrels per day higher than in December 2022. Also, gas production in the Permian Basin is projected to increase by 119 million cubic feet per day in January.
Due to the global recession, the demand outlook for oil is not strong. Thus, crude oil prices will not increase to their significantly high levels in the first nine months of 2022 in my opinion. According to EIA, Brent crude oil spot price in 4Q 2022 is 10% lower than in 3Q 2022. However, due to falling global oil inventories in early 2023 (see Figure 5), China’s reopening, and OPEC+ further production cuts, crude oil prices are likely supported. Brent crude oil spot price is projected to remain below $90 per barrel in 1Q 2023. However, it is expected to increase in the second quarter of 2023.
Figure 4 – International petroleum and other liquids production and consumption
eia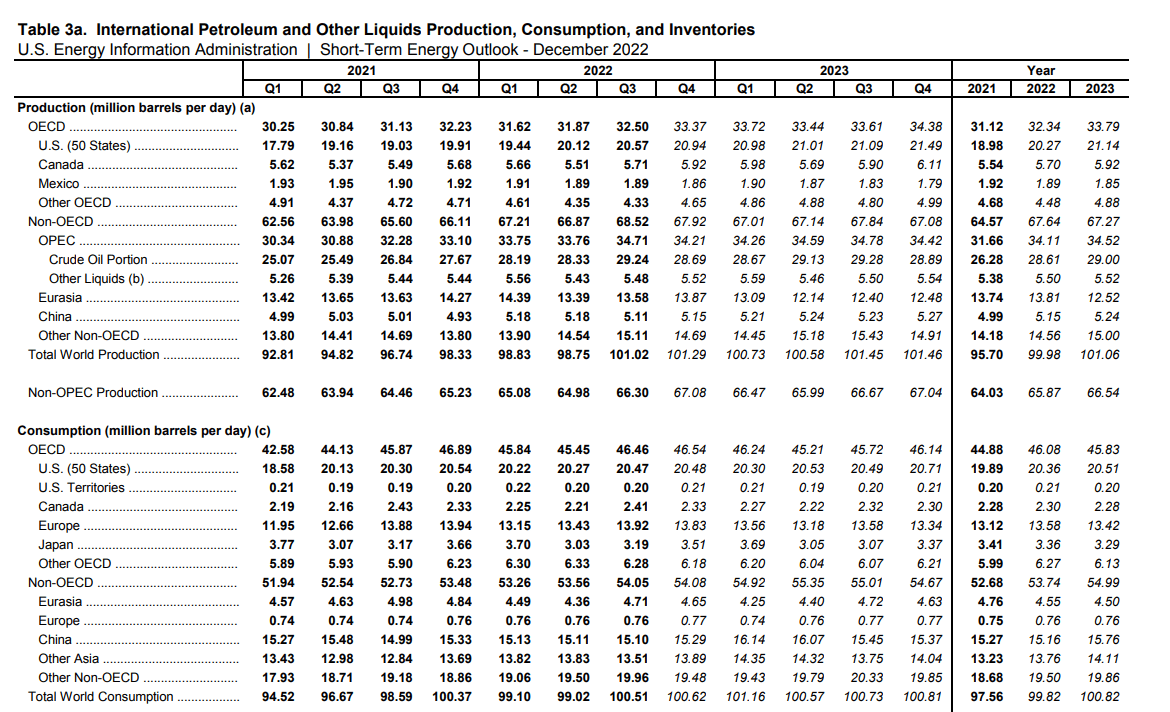
Figure 5 – Brent crude oil spot price and global inventory changes
eia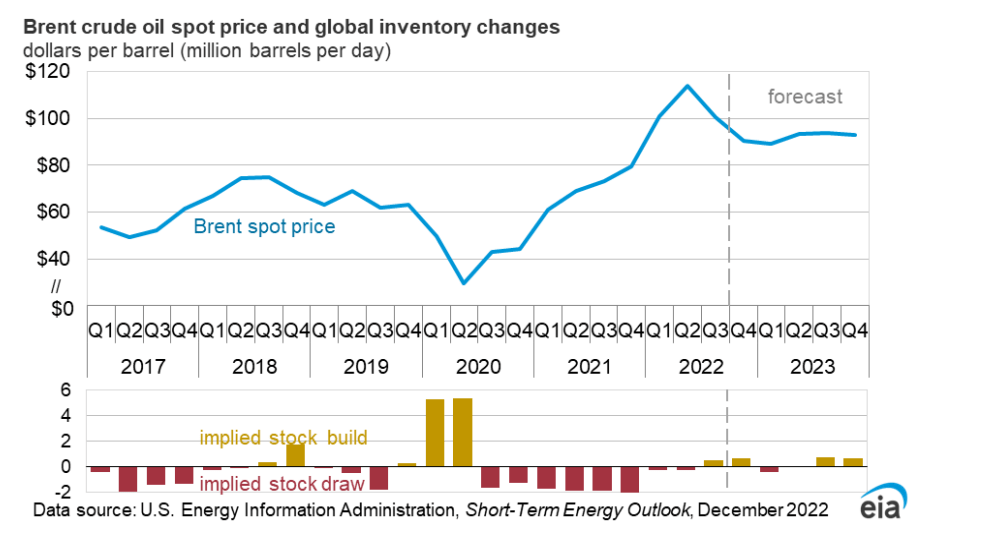
CTRA performance outlook
In the following section, I provided some leverage and return ratios to illustrate the credit ratings of Coterra Energy Inc. In the energy sector, one key way for investors to keep an eye on each company’s performance outlook is by considering their debt levels. Since the sector is capital-intensive, high debt levels may lead to a lower ability to purchase new equipment or meet other obligations. Thus, I catered some specific leverage ratios to assess the financial health of an energy company.
Figure 6 shows CTRA’s net debt-to-EBITDA ratio during the recent quarters. This ratio determines the probability of defaulting on issued debt, and as energy companies often have a great amount of debt on their balance sheet, this ratio could be of help to determine how many years of EBITDA would be necessary for Coterra Energy to be able to pay back its debt. It is observable that the company’s net debt-to-EBITDA has been on a decreasing path during previous quarters. For instance, its amount of the third quarter of 2022 was less about 1x, which is far lower year-over-year compared with its level of 3.85x at the end of September 2021.
Figure 6 – CTRA’s net debt-to-EBITDA ratio
Author (based on SA data)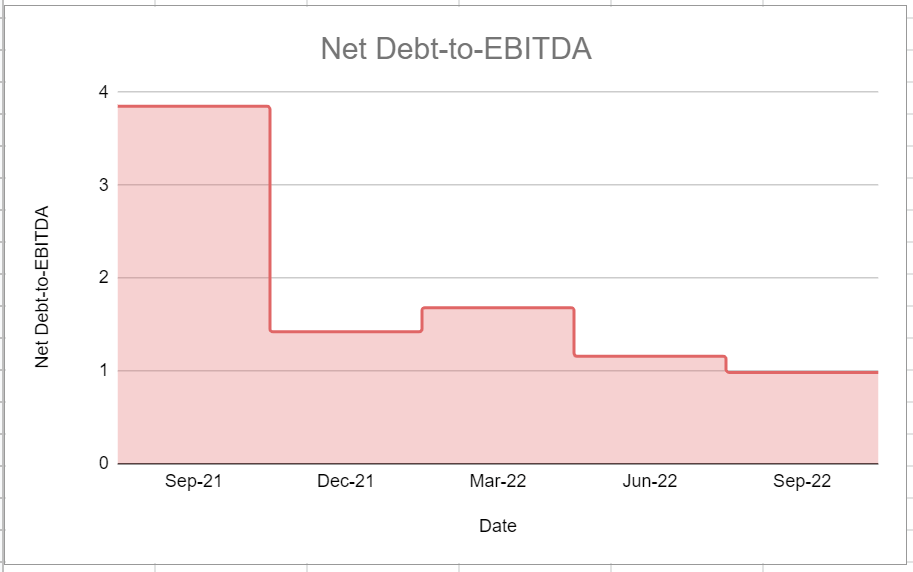
Moreover, Figure 7 is a picture of the company’s debt-equity or risk ratio. The debt-to-equity ratio is a leverage ratio that measures the weight of total debt and financial liabilities compared with total shareholders’ equity. Generally, this ratio determines whether a company’s capital structure is toward debt or equity financing. Figure 7 indicates that during recent quarters CTRA had the lowest amount of debt-to-equity ratio in the third quarter of 2022. Its amount sat at 0.21x at the end of September 2022 year-over-year compared with 0.42x in the third quarter of 2021. Moreover, the company’s level of risk ratio decreased by 25% from 0.28x in the second quarter of 2022.
Figure 7 – CTRA’s debt-to-equity ratio
Author (based on SA data)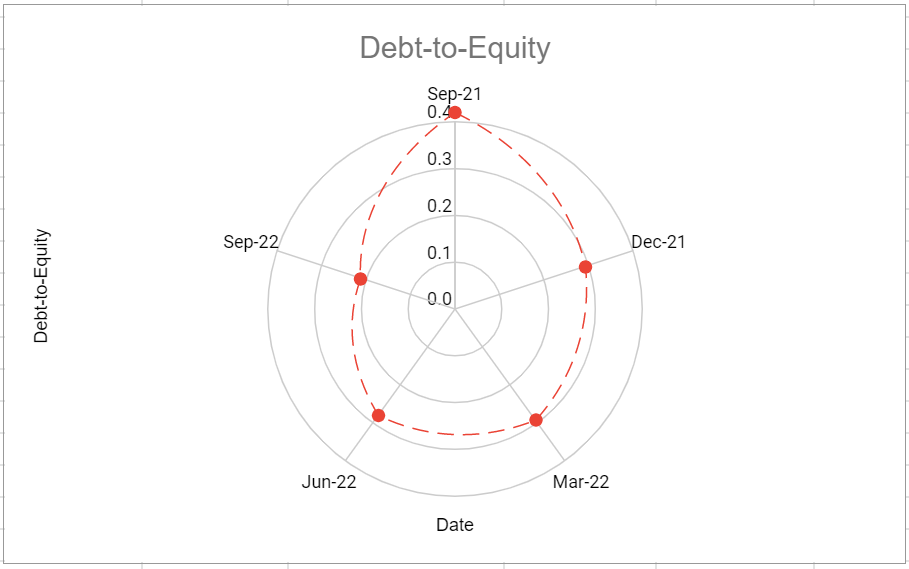
Apart from its leverage ratios, I investigated the company’s return on assets to represent the ability of Coterra Energy to cater returns to its shareholders. The return on assets ratio reflects how much profit a company is able to generate for every dollar of its assets. ROA of CTRA increased in almost every quarter of 2022 and sat at 6% at the end of the third quarter, which is much higher year-over-year versus its level of only 1% at the end of the same quarter of 2021 (see Figure 8).
Figure 8 – CTRA’s ROA ratio
Author (based on SA data)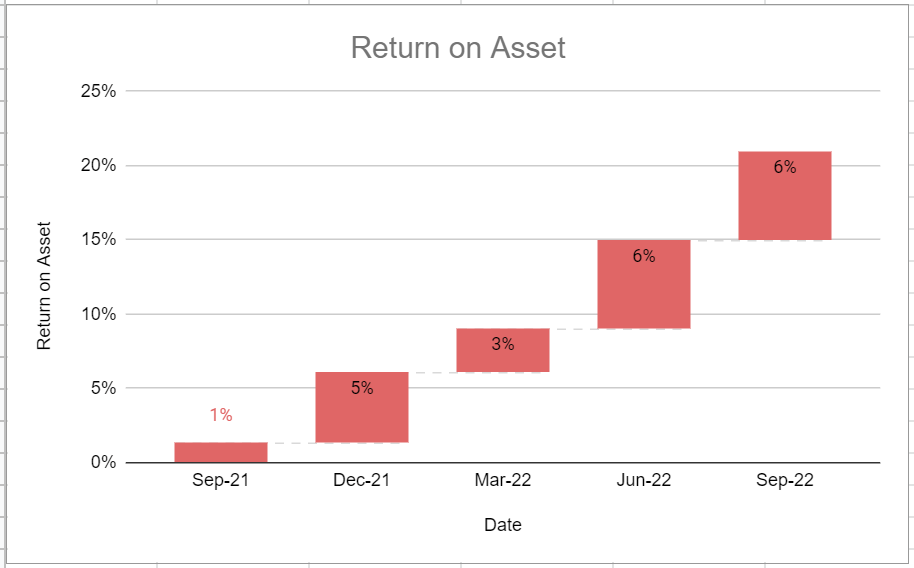
Summary
The natural gas market outlook is not as strong as before. Thus, I believe CTRA’s net income in the upcoming quarters will be lower than in 3Q 2022. However, due to the increasing natural gas and oil production in the United States and CTRA’s high-quality and diversified asset portfolio, the company will remain profitable. Furthermore, to evaluate CTRA’s credit ratings, I investigated its debt and return ratios. The company’s debt and return ratios show that CTRA is in a good position. The stock is a hold.
Be the first to comment