

nicolas_
Investment Thesis
Corning Incorporated (NYSE:GLW) has versatile products lined up and well-diversified industrial applications from its leading research capabilities. Its strategic framework, put to work since 2015, has been guiding the company’s management. The consistency of both bodes well for the company in a long term. Its current price is fairly valued with specific worst-case scenarios priced in by the market. We assess both its downside risks and upside growth potential.
Company Overview
Corning Incorporated is a leading innovator in materials science, originating in a glass business established in 1851. It’s named after where the business started, Corning, New York. The company focuses on glass science, ceramic science, and optical physics with manufacturing and engineering capabilities to develop category-defining products. It reports in five segments: Display Technologies, Optical Communications Specialty Materials, Environmental Technologies, and Life Sciences, and manufactures products at 119 plants in 15 countries.
Strength
Strategic Framework
Corning spans five different industries in its product application, with deep-benched research capability and market-leading positions in most of them. As mentioned in its 10-K, the company initiated a Strategy and Capital Allocation Framework in 2015. What we see is a consistent execution, even through volatile market conditions, over the past seven years that resulted in a continuous improvement of product and financial performance and resilience from market volatility. =What stands out to us is its focused and cohesive business portfolio:
Corning Strategy Framework (Corning Investor Relations)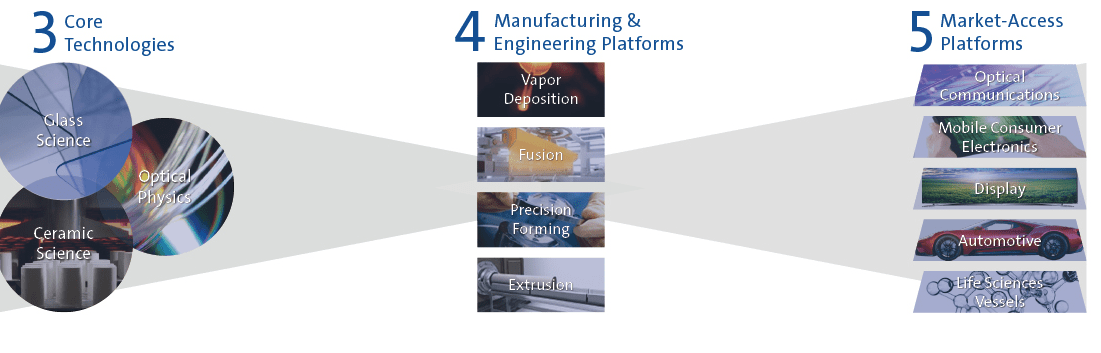
The company’s three core technologies of Glass Science, Ceramic Science, and Optical Physics synergize with its four manufacturing and engineering platforms across Vapor Deposition, Fusion, Precision Forming, and Extrusion, and then sells products in five market-access platforms: Optical Communications, Mobile Consumer Electronics, Display, Automotive, and Life Science Vessels. All these segments seem so unrelated to each other. Yet, because the materials scientific research they are doing is so fundamental, their results are applicable in all these fields, creating higher and sustainable competitive barriers. Their portfolio of patents worldwide in each reportable segment shows how deep-benched the capacity is. The upcoming expiring ones only accounted for a minor percentage.
Corning Patent Portfolio (Company 2022 10-K)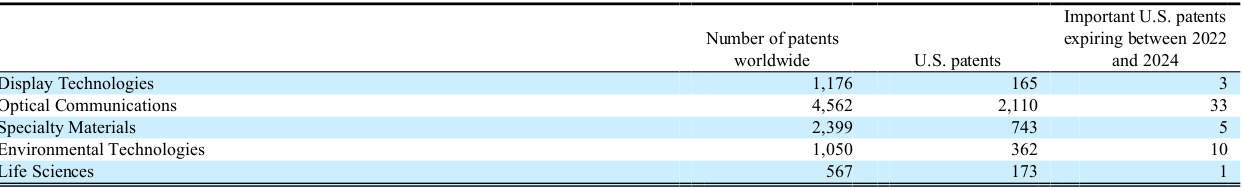
As they explained in their presentation, few competitors can match their expertise in any single core capabilities. Still, they continue to focus on using at least two of the core technologies to innovate. This has made them formidable in the competition and disruptive. For example, perhaps the most well-known application of their product is the smartphone glass. In 2020, Corning invented the world’s first transparent, color-free glass-ceramic, called “Ceramic Shield”, featured on the front cover of the latest iPhone models. How many 170-year-old companies can still call themselves a “disruptor” in the true sense?
Also in the same strategic framework, Corning provided a Capital Allocation Model as the following:
Corning Capital Allocation Framework (Corning Investor Relations)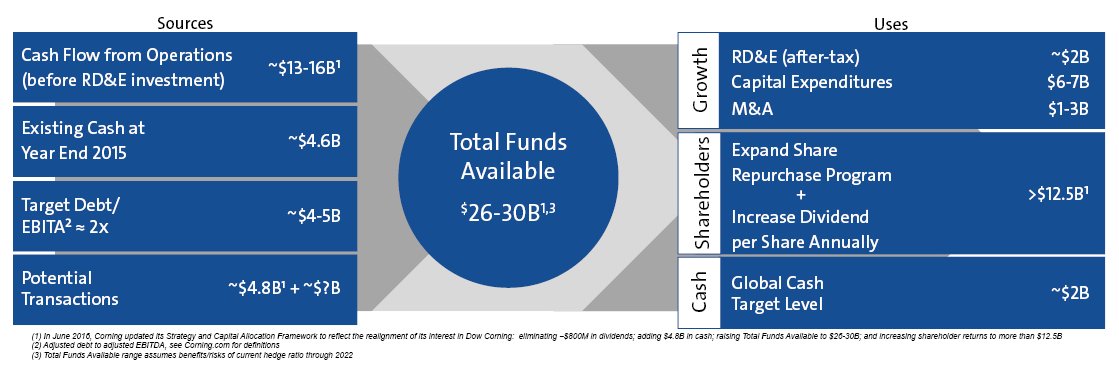
To hold it to the test, we cross-checked a few core metrics in this model since 2015 and found that even though there was a disruption in 2020, the company has been fairly consistent in trying to stay within the range. Its operating cash flow minus CapEx has become mostly stable in the past two years on a quarterly basis, resulting in a gradual upward trend in TTM.
Corning Op Cash Flow Minus CapEx (Calculated and Charted by Waterside Insight with data from the company)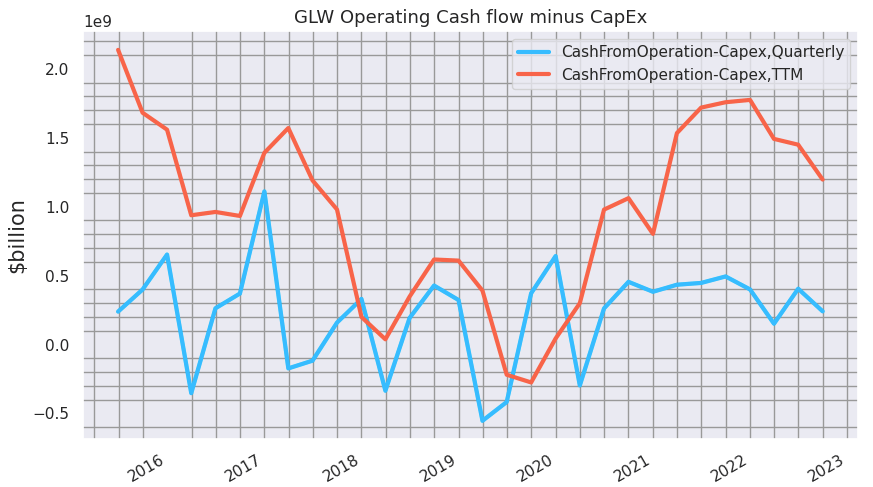
In the model, the company wanted to maintain a 2x Debt-to-EBITDA ratio. After a spike up around 2020, it has brought it back down to around 2x again.
Corning Debt-to-EBITDA Ratio (Calculated and Charted by Waterside Insight with data from the company)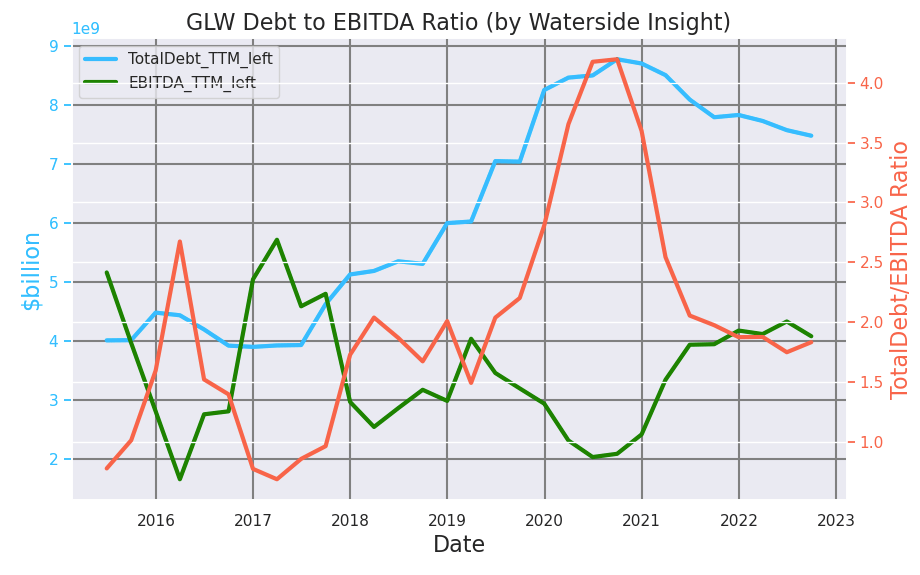
As a research-based company, Corning’s research expenses have been consistently in the 30% to 35% range compared to its operating expenses. There was a jump in 2020 and then a slump in 2021, which was due to a pre-tax asset impairment loss of $211 million and then the absence of it. It seems to be a one-off event.
Corning R&D Exp vs OpExp (Calculated and Charted by Waterside Insight with data from the company)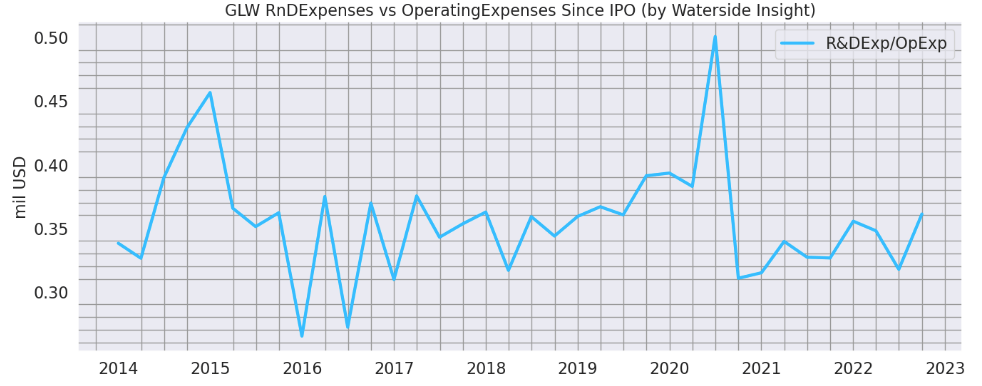
And in the framework, it mentioned shareholder return. The chart below shows that the dividend growth has been fairly consistent since.
Corning Dividend History (Calculated and Charted by Waterside Insight with data from the company)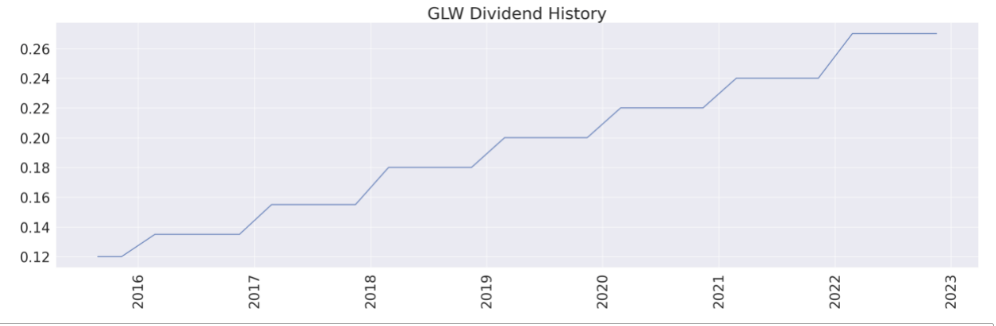
This consistency helps keep the company on track with stable growth and being resilient to external shocks.
Segment Performance
Corning segment performance has been strong since 2015.
Corning Sales by Segment (Calculated and Charted by Waterside Insight with data from the company)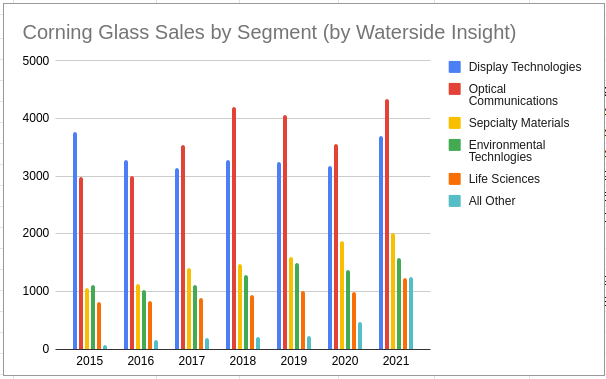
Every segment has been growing. Display tech used to be the largest segment, which could continue getting a tailwind as Apple planned on using its own in-house display screen in 2024. The optical communications segment has overtaken display tech since 2017 as the largest segment by sales. The global optical communication systems and network market are applicable in several industries, according to Fortune Business Insights, in IT& Telecom, Banking & Finance, Aerospace & Defense, Healthcare and Energy&Utilities, not to mention the application of Artificial Intelligence and Cloud Computing. The demand for high-speed connections is tremendous.
Global Optical Communication Market (FutureBusinessInsights.com)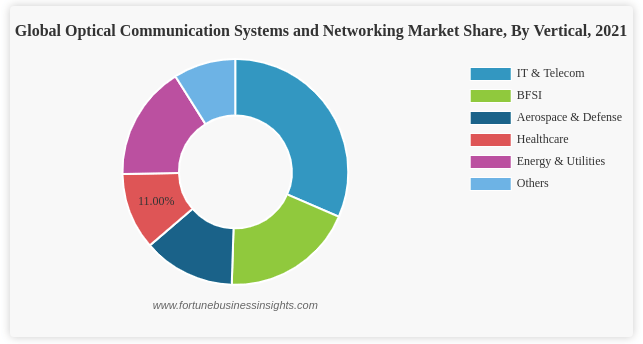
Also worth mentioning is its Other segment, which houses the Hemlock and Emerging Growth Business. It has grown to exceed the Life Science segment from $65 million to $1.2 billion in 6 years. This is where we see its leading position and innovation paying off consistently. The company could very well introduce a few other segments by spinning out the large components, such as solar-grade polysilicon, which reached $892 million in revenue in 2021, and other products that support infrastructure investment programs throughout the country and other renewable energy industries. We don’t want to be too fixated on the current segments’ growth to lose sight of the big picture: we see great versatility in applying its products in many different industries. Overall, the company’s total net sales have been on a steady upward trajectory since 2015.
Corning Net Sales (Calculated and Charted by Waterside Insight with data from the company)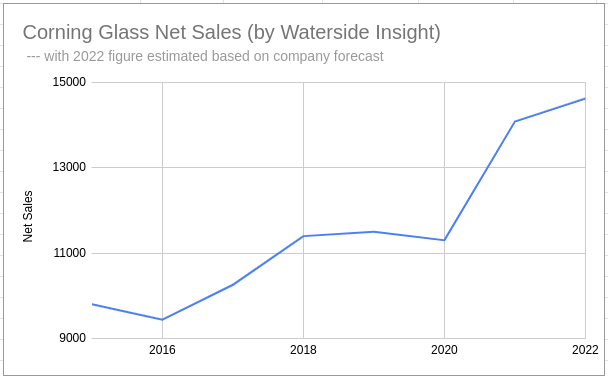
This sales pace is visibly strong in its days of outstanding sales, which have dropped to their lowest level in recent years.
Corning Days Sales Outstanding (Calculated and Charted by Waterside Insight with data from the company)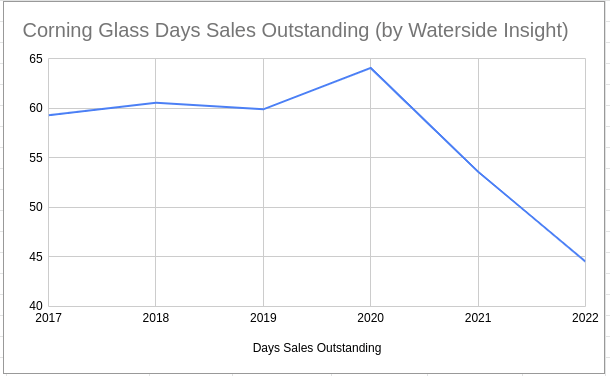
The company’s revenue has been hovering around its highest level since its IPO. In fact, at the end of 2020 and 2021, Corning had deferred revenue of approximately $1.0 billion and $912 million under long-term supply agreements. It will be recognized when control of the promised goods is transferred to the customer based on the units shipped compared to the remaining contractual units. This is a recent phenomenon, as this figure was insignificant in 2019, and it shows further strength in its sales.
Corning Revenue (Calculated and Charted by Waterside Insight with data from the company)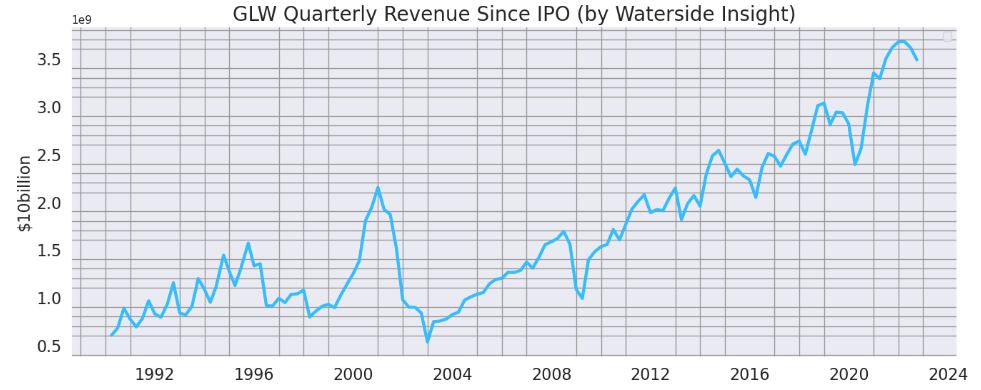
The company’s profit margins have been stable since recovering from the pandemic shock. Although we notice the gross profit has slightly dropped in the last quarter, its margin, which is a ratio over the revenue, is still relatively stable.
Corning Profit Margin (Calculated and Charted by Waterside Insight with data from the company)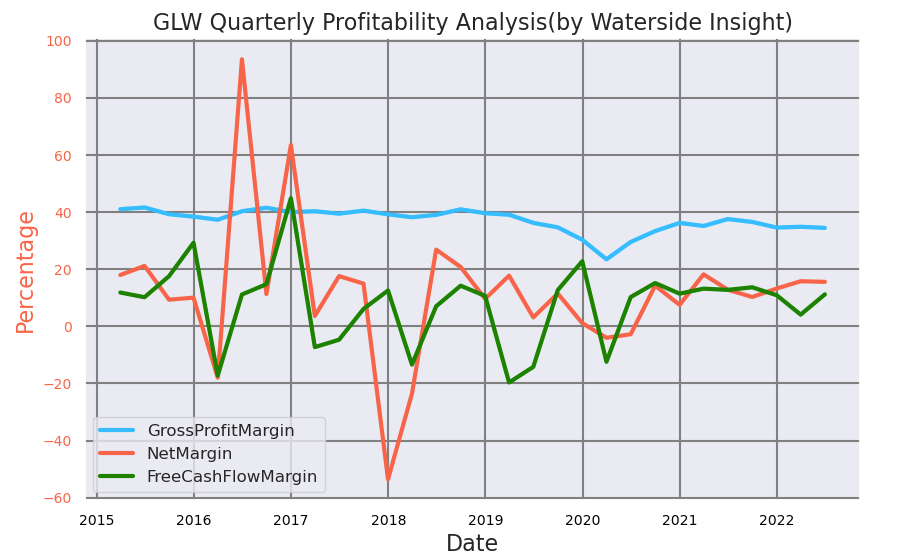
Corning’s TTM free cash flow has risen to a recent high since the pandemic.
Corning Free Cash Flow (Calculated and Charted by Waterside Insight with data from the company)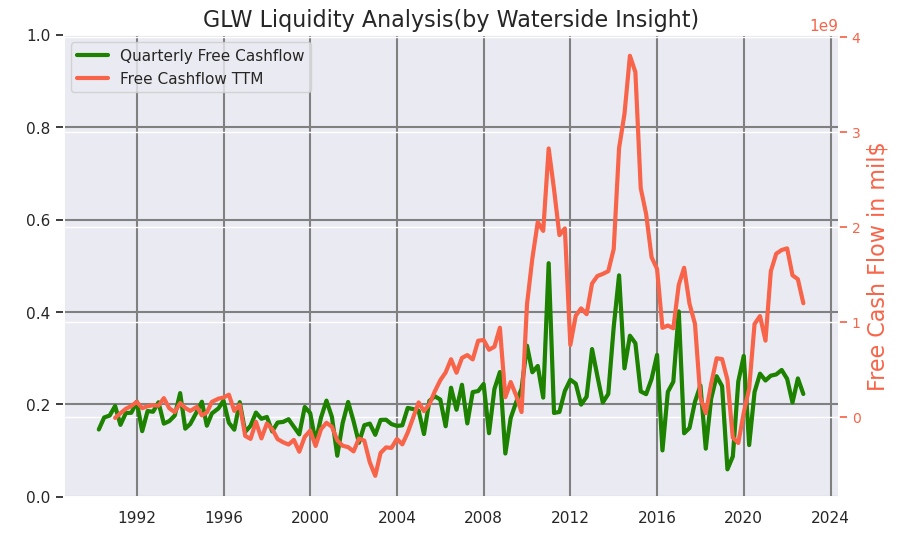
If we look at the bottom line, its EBITDA growth has been fairly stable on a TTM basis in recent years.
Corning TTM EBITDA (Calculated and Charted by Waterside Insight with data from the company)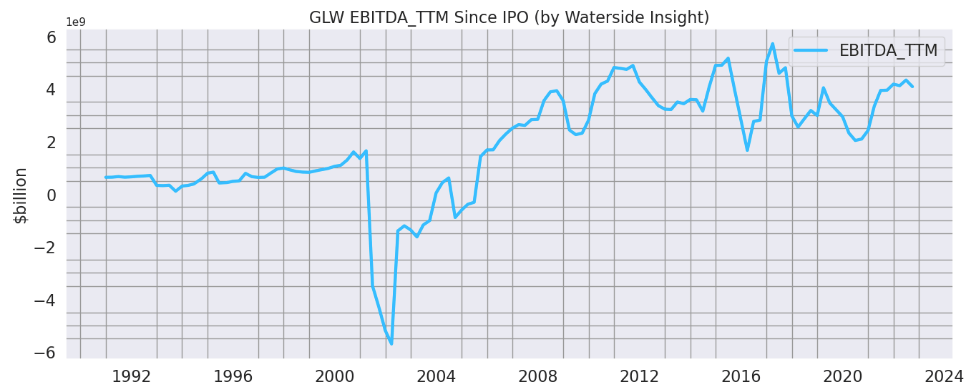
Overall, we see the management’s effort to try to steer the company’s financials with discipline and steady hands. The Strategy and Capital Allocation Framework continue to provide strong guidance for the company’s path toward growth. And consistency in innovation and cutting-edge research capacity provides continuous growth spots.
Weakness/Risks
A broader market weakness and perhaps an upcoming recession are the biggest concern for us. Being so ingrained in the basic material demands of the economy, Corning will inevitably be getting some headwinds. We will factor it into our valuation process.
It is notable that Corning has a concentrated customer base, which could negatively impact sales through the action or loss of one or more key customers.
Corning Important Customer by Segment (Company 2022 10-K)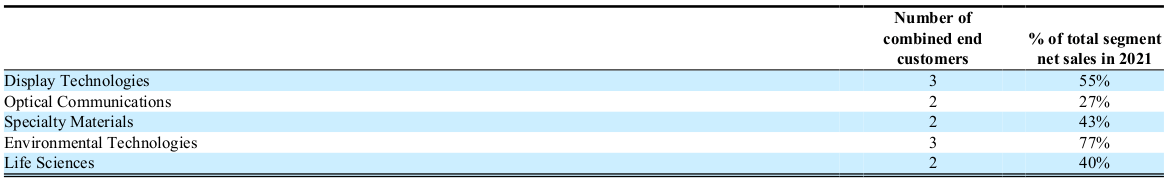
However, for 2021, 2020, and 2019, no single customer met or exceeded 10% of Corning’s consolidated net sales. And these important customers span five different industries, each of which has its own dynamics. The chance of more than one of them getting into trouble simultaneously seems low.
Supply chain risks have always been a concern, since Corning has 119 manufacturing facilities in 15 countries, with 32% of them in the U.S.. But it seems Corning has been coming prepared. It currently has the highest inventory level in its history, while the inventory-to-revenue ratio is still within the historical range. Although it shouldn’t be read as a significant slowdown in sales, any supply disruption probably would be hard to shake it in the short term.
glw (Calculated and Charted by Waterside Insight with data from the company)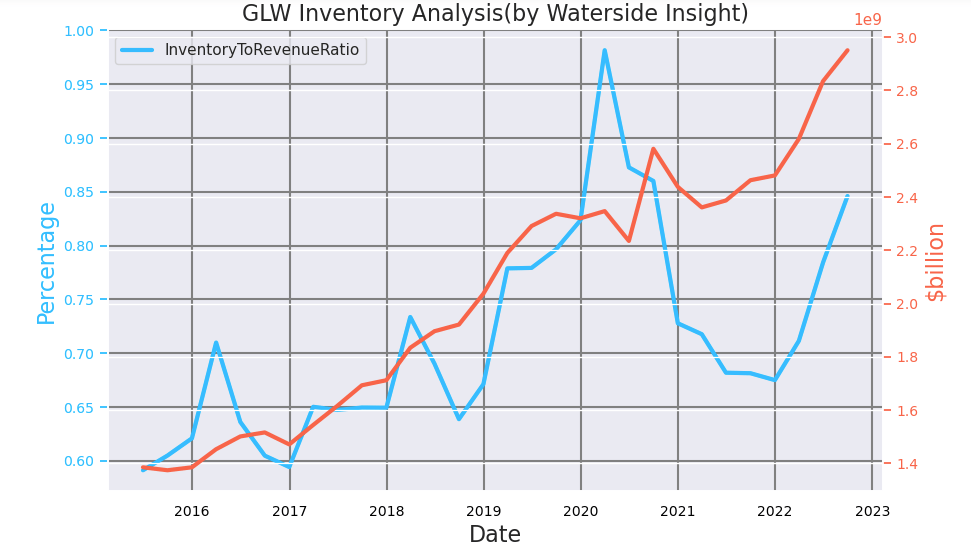
Financial Overview
Corning Financial Overview (Calculated and Charted by Waterside Insight with data from the company)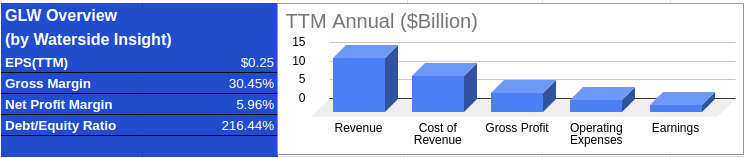
Valuation
We take into consideration of all our analysis above and assess the fair value of Corning with our proprietary models projecting ten years forward. In our bullish case, Corning narrowly escaped from negative growth in 2023 and continued with modest to average growth similar to its usual pattern; the company was valued at $59.08. In our bearish case, the company suffered up to two years of double-digit negative cash flow growth in 2023 and 2024 but bounced back and recovered to its usual growth pattern; it is valued at $36.79. In our base case, it has a double-digit setback of growth in 2023 but returns to mild growth in 2024, and stages a similarly stable growth pattern as of late; it is valued at $49.26. Its current market price seems to be close to our bearish case scenario.
The assumption of 2023 to 2024 growth risks is the key difference for these three scenarios while we try to keep a stable pattern of future growth, assuming the framework put in place in 2015 will continue to take effect.
Conclusion
Corning has resilience derived from its leading position in research and development, while its framework put to work since 2015 gives a stable path in its outlook. The market seems to have priced in a bearish case for the company in the near-term outlook. We are constructive of the company’s growth both in the medium term and long term. However, with uncertainties ahead and a possible looming recession, although we see the company to be relatively undervalued to our base case scenario, we wouldn’t recommend a buy but instead a hold at this juncture.
Be the first to comment