

SimoneN
Unless otherwise indicated, all monetary amounts in the following are in Canadian dollars.
My recent article on Copper Mountain Mining Corporation (TSX:CMMC:CA) and (OTCPK:CPPMF) explored the operations of the company in some detail. That analysis was based primarily on Sedar quarterly and annual filings, plus a bit taken from other sources. The article also discussed the market for copper, a topic on which I have nothing more to say here.
The conclusion of the article was that CMMC stock appeared to be undervalued, based on standard ratios. It also appeared to be undervalued relative to other copper mining companies.
Further interactions with members of Michael Boyd’s Energy Investment Authority led me to understand two things. There were weaknesses in my analysis, and there was an opportunity to improve it.
These issues are both addressed here by working with data from the Life of Mine Plan published in 2020, referred to below as “The Plan”. It is available from sedar.com as a technical report.
My goal here is to share a better analysis based on that more complete information. The conclusion of the work is that Copper Mountain is a better investment than I had thought. This led me to recently establish a position.
Considering Management
Some readers of my prior article claimed that Taseko (TGB) (TSE: TKO) in particular is a superior company, and that by comparison CMMC has poor management. There is a lot to like about Taseko and at some price I would find it appealing.
But CMMC is the one whose stock is much more suppressed in price this year, relative to last year. The prior article discussed some reasons for this, but inherently bad management was not among them.
Taseko is mining a mountain, Gibraltar, that is remarkably similar to Copper Mountain in overall grade and recoverable ore.
If you read the early filings from Taseko regarding Gibraltar, they are strikingly similar to those for Copper Mountain a few years later. They feature a long sequence of delays in getting volume of milling up where they wanted it.
Yet those commenters felt it obvious that Copper Mountain was poor at mine management while Taseko was good at it. I did not find objective evidence to support such claims.
Mining is hard. Murphy is active there.
A Mountain of Copper
Copper Mountain itself has a very long history. It is also a great illustration of the truth that you never run out of a resource; it just gets more expensive to recover.
CMMC 2020 Life of Mine Plan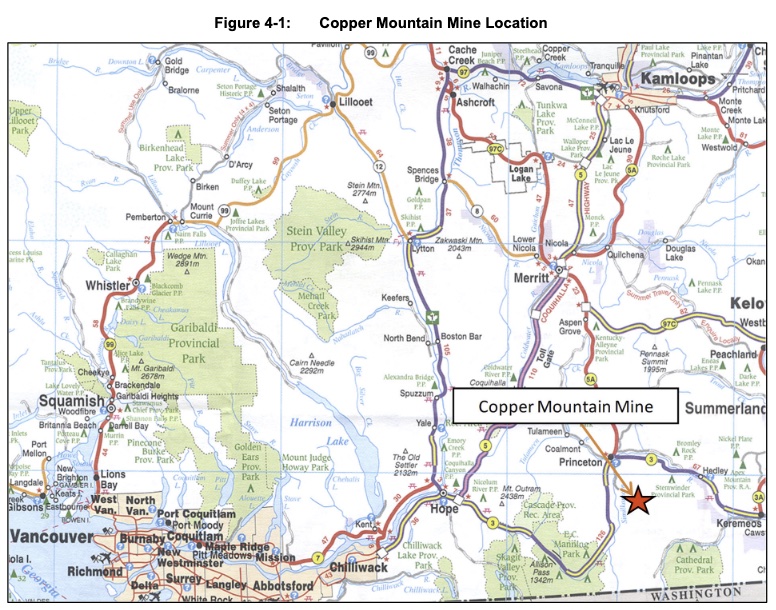
In the geology of this mountain the copper comes with gold and silver. I discussed the accounting for those in the previous article and say no more about them here. The focus of analysis, there and here, is on the earnings per pound of copper produced.
Underground mining began in 1922. Between 1927 and 1957 Granby extracted 31.5 Mt of ore with a calculated grade of 1.08% copper. The grade of copper has gone down from there.
Newmont Mining Corporation began the open-pit era operations in 1972. The initial reserve was 69 Mt grading 0.53%.
Mining ended up shut down for a decade in 1996. Copper Mountain Mining Corporation bought the mine in 2006 and began its present phase.
As of 2020, the understanding of the mountain was based on many measurements. Among them are 7,717 exploratory holes drilled dating back to 1917.
Mostly the holes date from 1950s through the 1970s. CMMC drilled 1,087 holes from 2007 through 2020. The holes in total are illustrated here.
CMMC 2020 Life of Mine Plan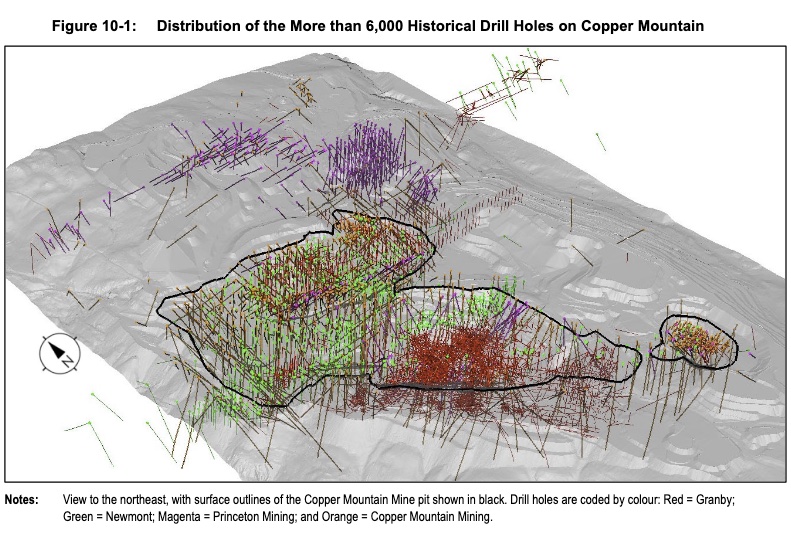
The Plan discusses many other aspects of characterization of the mine. Copper Mountain is relatively well understood, so the mine plan seems to be based on quite solid data. The contrast with what we see from oil and gas firms is notable.
The average copper grade from the 2020 Life Of Mine plan is 0.23%, less than half that from the Newmont Era. Total Proven and Probable (2P) reserves are given as 462 MT.
Here is the summary of the current conclusions from geophysical surveys. CMMC has drilled 250 holes within the region to the left is known as New Ingerbelle. These have expanded the economically viable reserves of the mountain.
CMMC 2020 Life of Mine Plan
With further exploration, the 2P number has continued to increase. The evaluations below are based on the 2020 Plan. There will be a 2022 plan sometime later this year.
Features of The Plan
The Plan laid out, year by year, how much milling would occur, how much ore would be milled, what its grade would be, and how much mining would be required to supply this ore to the mill.
Notably, The Plan assumed that the milling would run 45 ktpd in 2022 and 2023 and 65 ktpd thereafter. CMMC will not make that 45 ktpd rate in 2022, for reasons discussed in the prior article, but are on target to get there soon.
They have a shot at meeting the plan after that. More likely, various events will slow things down and it will end up taking a few more years than indicated to get to the end of the planned mining (if they stick with the 2020 plan). The implications of this will be small potatoes in the context of the valuation results below.
Counterbalancing that, CMMC is talking about going to 100 ktpd of milling. If they manage to do so, then a lot of future production will come forward so its Net Present Value, or NPV, will go up.
As you will see, though, precise results are not the point here. One wants a big margin of safety for a resource extraction investment.
Based on the data from the mountain, the plan shows the expected grade of the copper ore and Strip Ratio. (The Strip Ratio is the ratio of total tonnes mined to ore mined.)
RP Drake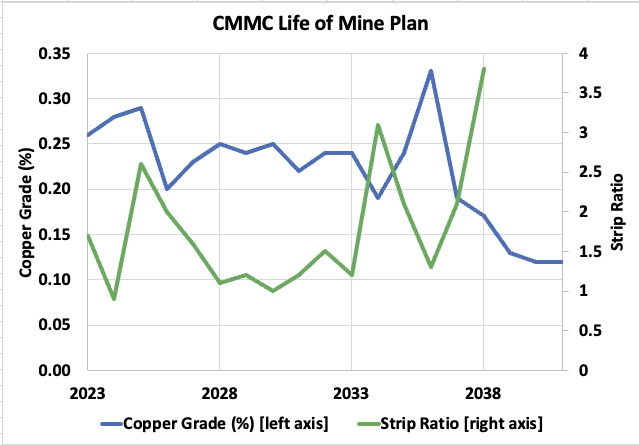
We see that the grade of the ore will mostly run below 0.25%, with a couple of periods when it is higher. I had misinterpreted some things I read, so the previous article anticipated a larger grade.
The Strip Ratio is mostly around 3x but does vary. That (green) curve ends after 2038, when all that is left to do is to mill the remaining, and previously stored, low-grade ore.
The Plan includes modeled recovery rates, which vary with year, but are always between 80% and 90%. The resulting weight of recovered copper ends up averaging around 100M lbs/year until the late 2030s.
RP Drake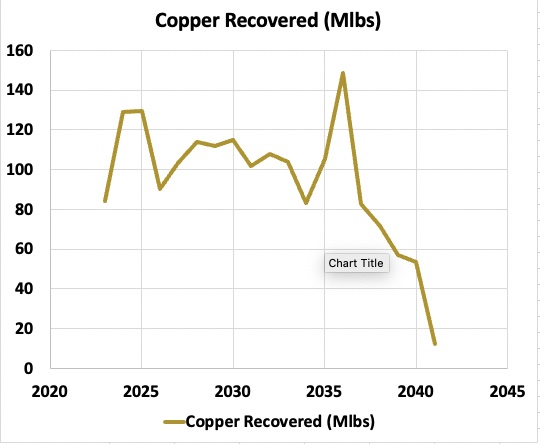
Costs and Profits
My estimate of 2023 total costs (approximately what CMMC calls All-In Sustaining Costs) from the previous article was $260M, of which $210M was for mining and milling. In order to scale these forward, a model was needed for the division between mining costs and milling costs.
I used numbers found in Wills’ Mineral Processing Technology 8th Ed for open-pit copper mining. The total cost in 2023 was assigned 38% to mining (for $80M) and 62% to milling (for $130M). These numbers were scaled forward in time in proportion to changes in mining or milling volumes.
Certainly, the precise ratio of costs varies with year and may even be different on average for this mine. But what matters for the purpose here is that milling is somewhat more expensive than the mining and that the ratio is closer to 2/1 than to 5/1 or 10/1. Here is the resulting estimate of direct mining and milling costs by year.
RP Drake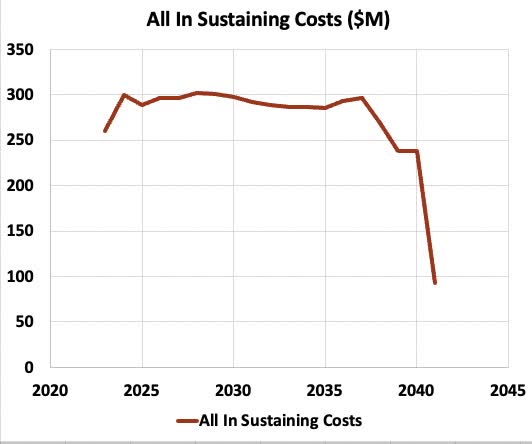
This is in 2023 dollars. These costs increase to about $300M per year with the increase in milled volumes. They stay at about that level until the late 2030s.
Based on the above data and an assumed copper price, one can determine the annual profits on sales of copper. This is revenues from copper less All-In-Sustaining-Costs as discussed in the previous article. These are displayed here graphically for copper prices from US$ 2.00 per pound to US$ 5.00 per pound.
RP Drake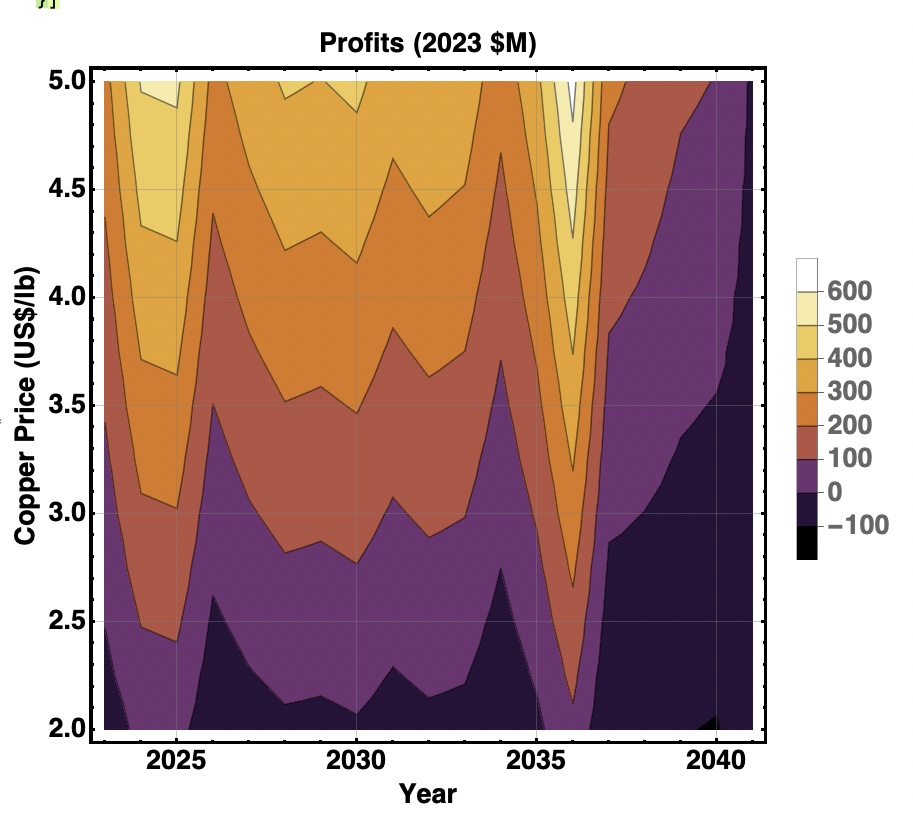
Here there are two vertical stripes, corresponding to increased profits in years where higher-grade ore is mined. Copper prices of US$3.50/lb generate profits near $200M per annum. Copper prices near US$2.00/lb generate losses in nearly all years.
Net Present Value and Valuation
We can take the data just displayed and assume a discount rate to find the NPV of the earnings from any year, for any copper price. Here is what we get for a 10% discount rate:
RP Drake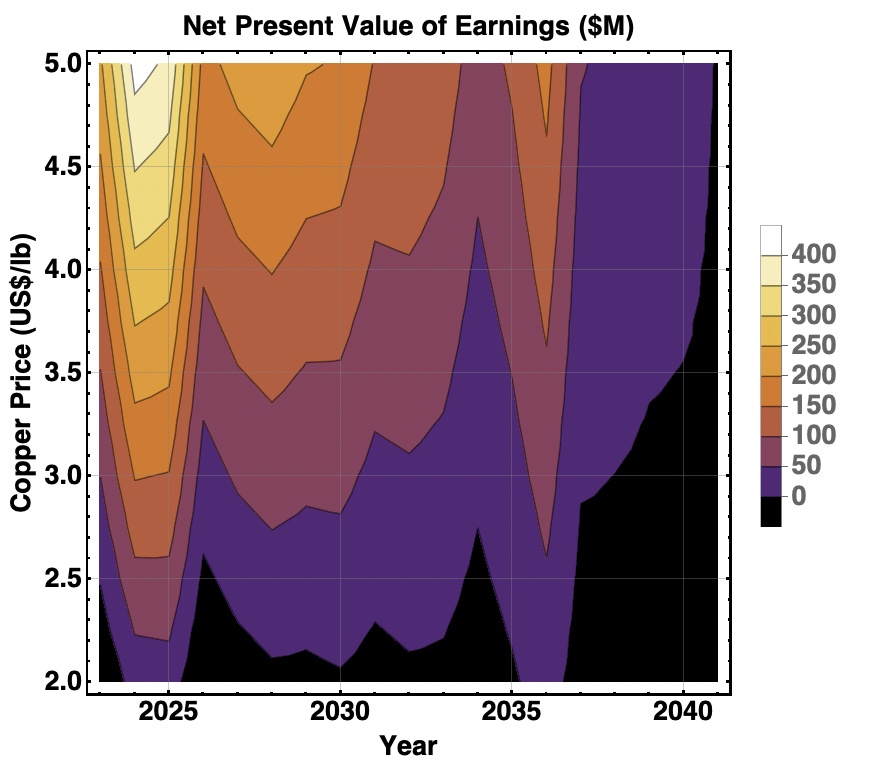
We see, as expected, that the later years are pushed down in value. In particular, that rich ore scheduled to be mined in 2036 has a much smaller relative NPV.
We can get an overall Net Value for CMMC for any given copper price and discount rate by adding up the values shown on the last plot for that price and then subtracting the Net Debt of $250M. This produces the following plot:
RP Drake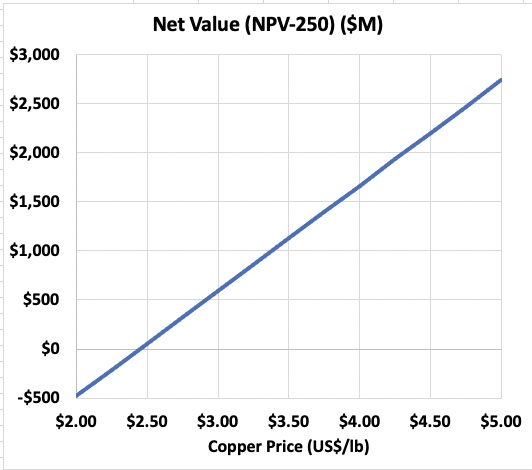
We see that for copper prices above US$3.50, the Net Value comes in above $1B. Dividing this by the current Market Cap, taken to be $300M, we find the multiple by which the stock price would have to increase to reach fair value. That is shown here:
RP Drake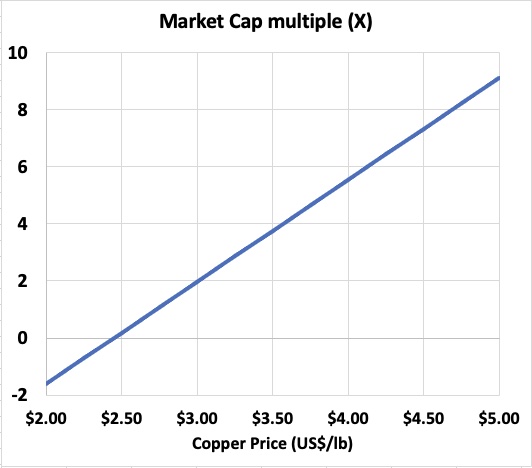
This is the bottom line. If you consider it reasonably likely that copper prices will languish below US$2.50 per pound for an extended period, then CMMC is not for you.
In contrast, if your view of the copper market is similar to mine, then you see the present mid-cycle price as near US$3.50. You also see it as likely to endure overall, or to increase over time thanks to increased demand.
Under these assumptions, CMMC is undervalued by a very substantial amount. Increasing the discount rate does not reduce the multiple enough to make a big difference. There is enough of a margin of safety here that I established a position.
My prior article discussed some reasons for the relative drop in the price of CMMC stock. I want to emphasize that investing there is a decision by me to invest in a firm found to be substantially undervalued in two ways: relative to peers and relative to fundamental value.
My investment does not reflect a decision to invest long-term or to fall in love with the company. As a friend of mine on High Yield Landlord says often, “Love your family not your equities.”
Be the first to comment