

mtcurado
Introduction
The Houston-based ConocoPhillips (NYSE:COP) released its third-quarter 2022 results on November 3, 2022. COP is one of the world’s largest independent oil and gas producers that I consider an oil major, even if it isn’t one by definition.
Note: This article is an update of my article published on July 26, 2022. I have followed COP on Seeking Alpha since March 2017.
This article aims to have a detailed look at the company’s fundamental recent history, including the third-quarter earnings, and draw credible conclusions about what to expect in 2023 and how to navigate the industry successfully.
Undoubtedly, 2022 was an exceptional year that generated a whopping trailing 12-month free cash flow of $18,407 million. Still, this great accomplishment is ending, and oil companies like COP will battle strong headwinds in 2023 with a possible painful recession and diminishing demand.
Below is an overview of what we know so far:
COP 3Q22 highlights earnings (COP Presentation)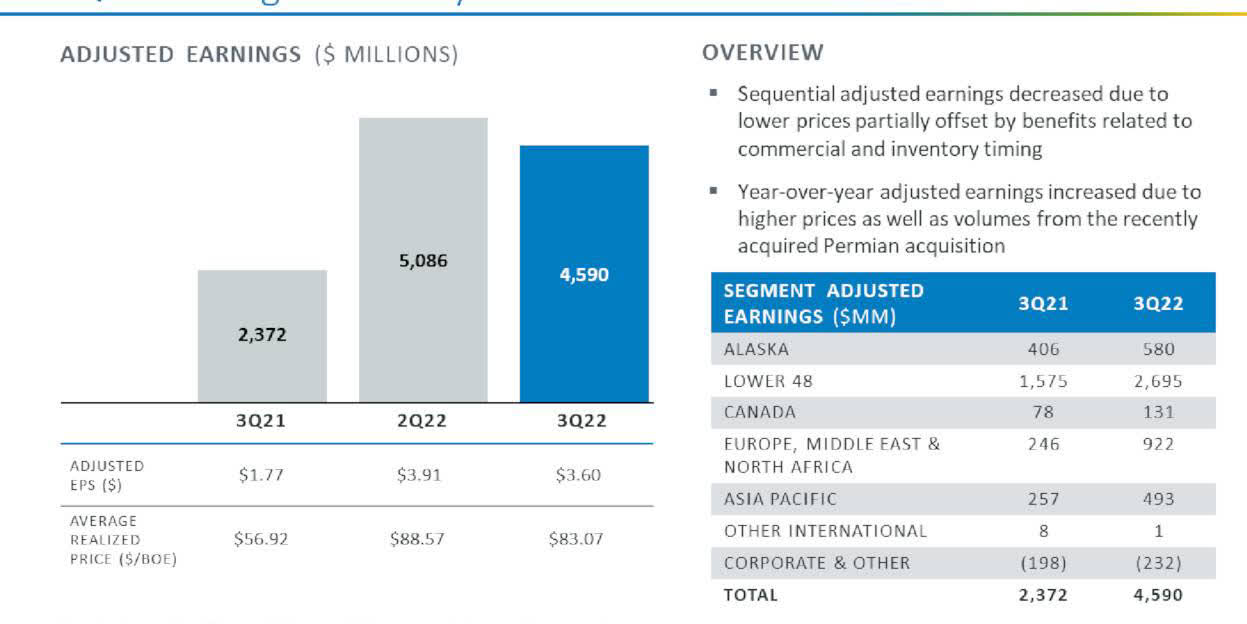
ConocoPhillips reported third-quarter 2022 adjusted earnings per share of $3.60, beating analysts’ expectations. It significantly improved from an adjusted profit of $1.77 per share a year ago.
ConocoPhillips’ quarterly revenues were a whopping $21,614 million in the third quarter, significantly higher than the $11,616 million realized a year ago.
Increased production volumes and higher commodity prices boosted the solid third-quarter results.
CEO Ryan Lance noted in the conference call:
ConocoPhillips is well positioned to win in any environment. We remain committed to delivering on our triple mandate of responsibly and reliably meeting energy transition pathway demand, delivering competitive returns on and of capital and progressing towards achieving our net zero operational emissions ambition.
1 – Stock Performance
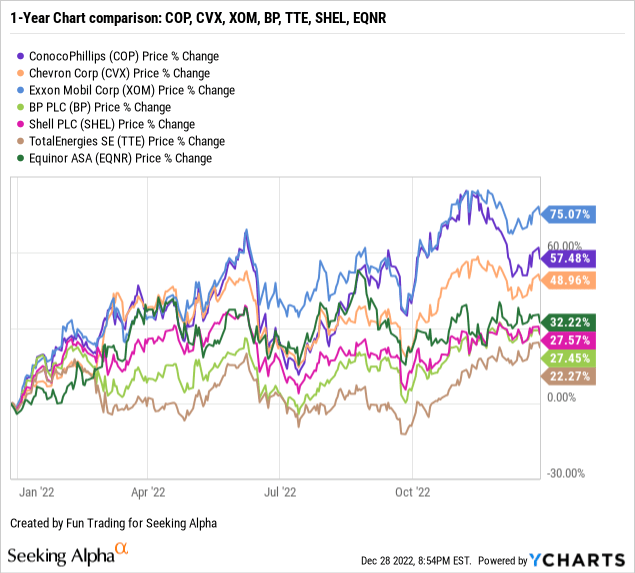
1.1 – The company is a long-term oil investment comparable to my US oil supermajors’ group, such as Exxon Mobil (XOM) or Chevron (CVX). As we can see in the chart below, COP is still one of the best performers in the group and is up 57% yearly.
1.2 – Furthermore, the dividend paid is comparable with most of its peers.
COP Dividend and EV comparison (Fun Trading)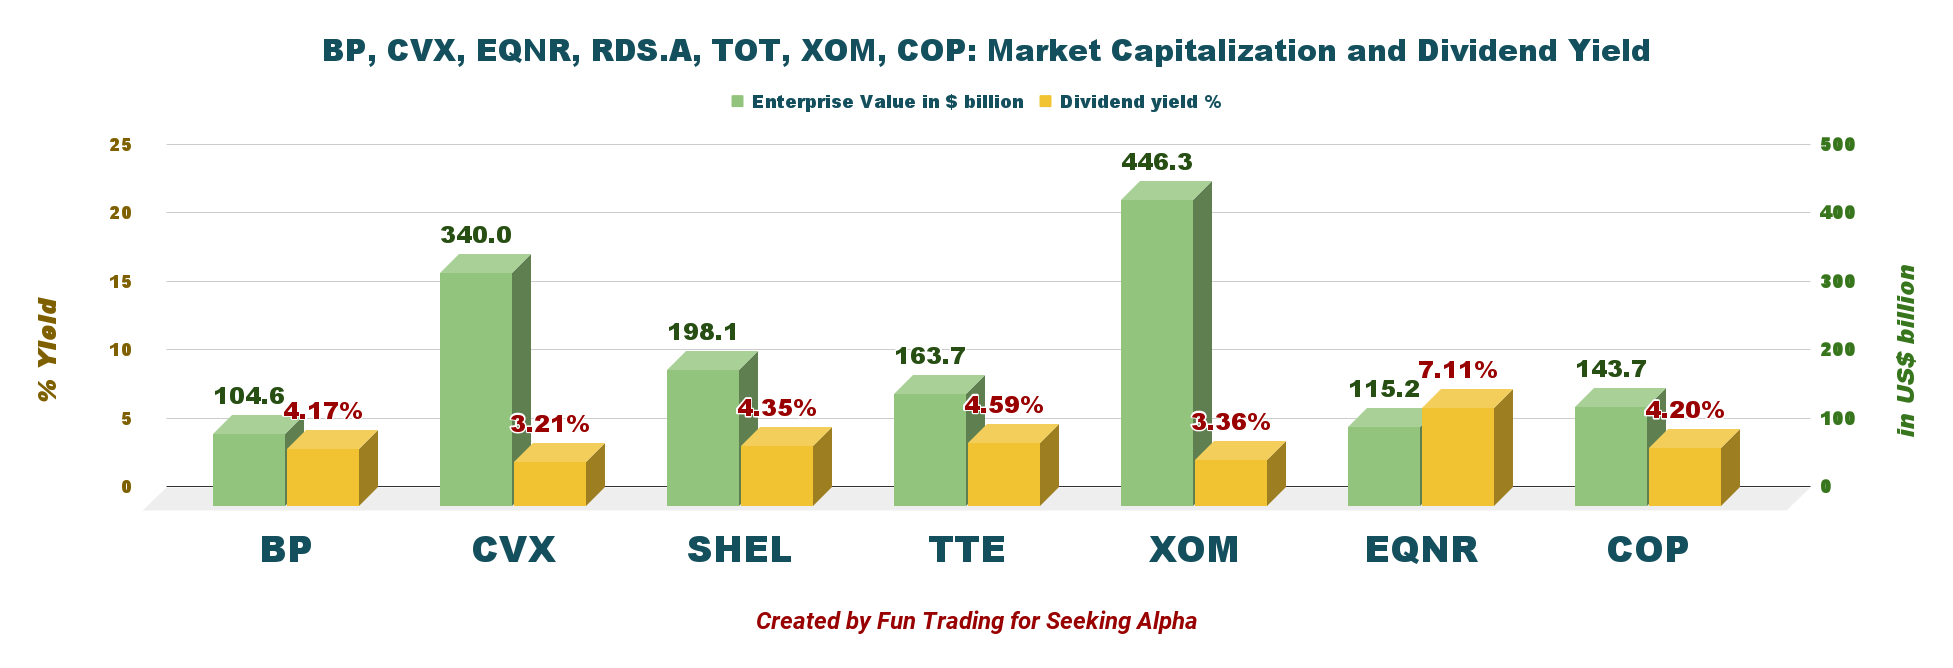
ConocoPhillips – 3Q21 to 3Q22: Financials And Trend – The Raw Numbers
| ConocoPhillips | 3Q21 | 4Q21 | 1Q22 | 2Q22 | 3Q22 |
| Oil Revenues in $ Billion | 11.33 | 15.12 | 17.76 | 21.16 | 21.01 |
| Total Revenues in $ Billion | 11.62 | 15.96 | 19.29 | 21.99 | 21.61 |
| Net income in $ Billion | 2.38 | 2.63 | 5.76 | 5.15 | 4.53 |
| EBITDA $ Billion | 5.48 | 6.62 | 10.0 | 9.74 | 9.57 |
| EPS diluted in $/share | 1.78 | 1.98 | 4.39 | 3.96 | 3.55 |
| Cash from operations in $ Billion | 4.80 | 5.87 | 5.07 | 7.91 | 8.74 |
| Capital Expenditure in $ Billion | 1.30 | 1.56 | 3.16 | 1.97 | 2.50 |
| Free Cash Flow in $ billion | 3.50 | 4.31 | 1.91 | 5.95 | 6.24 |
| Total cash $ Billion | 11.93 | 6.95 | 7.14 | 8.18 | 10.42 |
| Total debt in $ Billion | 19.67 | 19.93 | 18.75 | 16.97 | 16.96 |
| Dividend per share in $ | 0.46+0.20 | 0.46+0.30 | 0.46+0.70 | 0.46+1.40 | 0.51+0.70 |
| Shares outstanding (diluted) in Billion | 1.336 | 1.321 | 1.307 | 1.296 | 1.269 |
Sources: Company data and Fun Trading Analysis
Note: Historical data are available for subscribers only.
Analysis: Balance sheet and Upstream Production
1 – Quarterly revenues and other income were $21.61 billion (oil revenues were $21.01 billion) in 3Q22
COP Quarterly Revenues History (Fun Trading) ConocoPhillips posted total revenue of $21.614 billion for the third quarter, well above the $11.616 billion in the same quarter last year. The chart shows the previous eight years of revenue.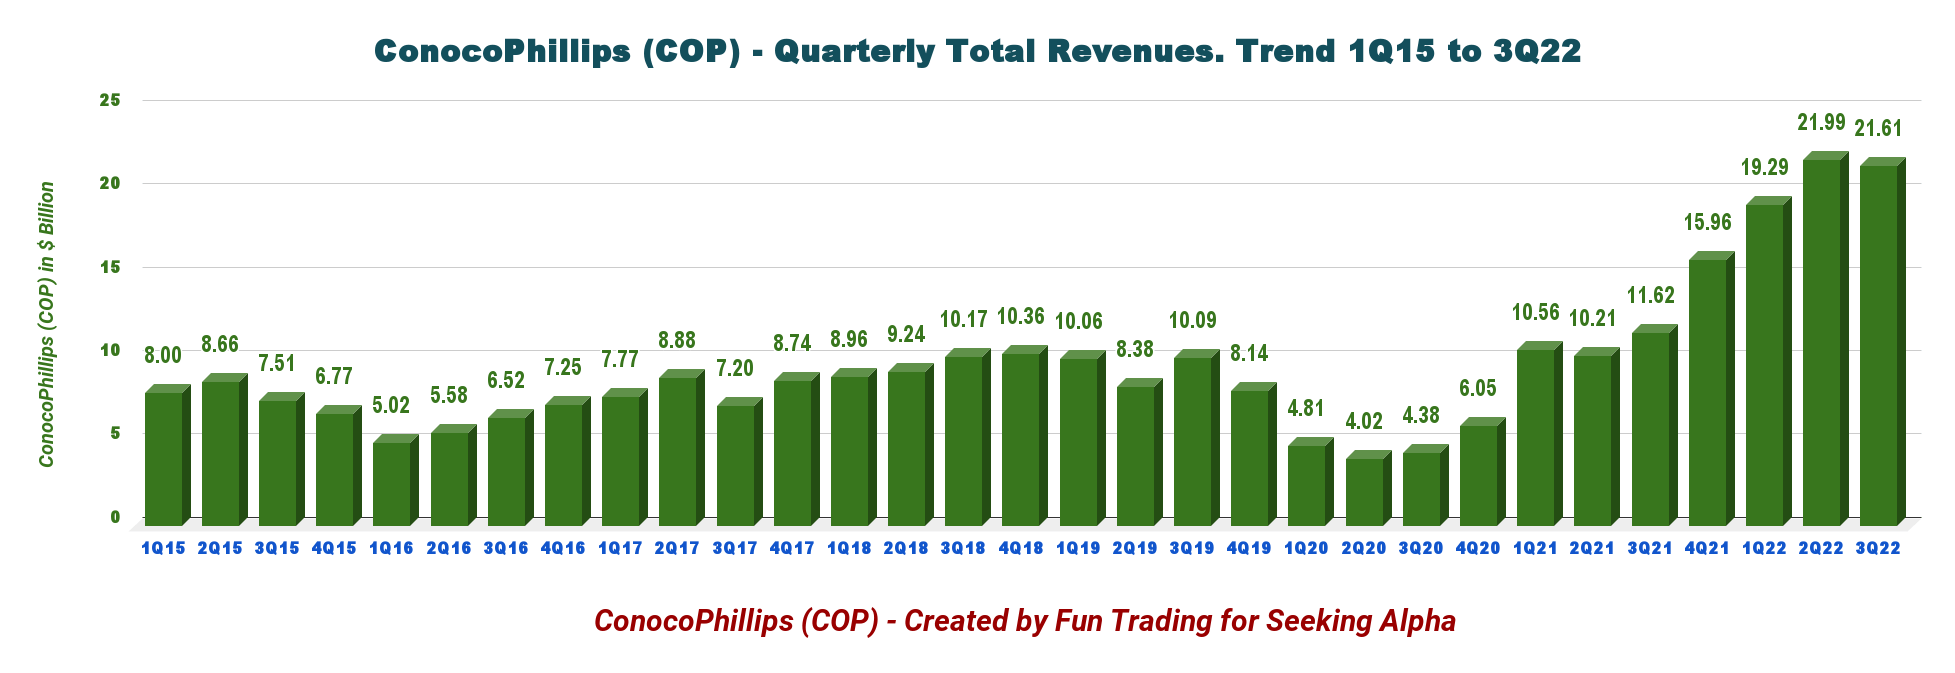
Net income was $4,527 million in 3Q22 or $3.55 per diluted share versus $2,379 million the previous year or $1.78 per diluted share.
ConocoPhillips’ third-quarter total expenses rose to $14,174 million from $8,034 million in the corresponding period of 2021.
The solid quarterly results came from increased oil-equivalent production volumes and realized commodity prices.
Also, ConocoPhillips announced a third-quarter dividend of $0.51 per share and a variable return of cash (“VROC”) payment of $0.70 per share.
2 – Free cash flow (not including divestitures) was $6,243 million in 3Q22
COP Quarterly Free cash flow history (Fun Trading) Note: The generic free cash flow is the cash for operating activities minus CapEx.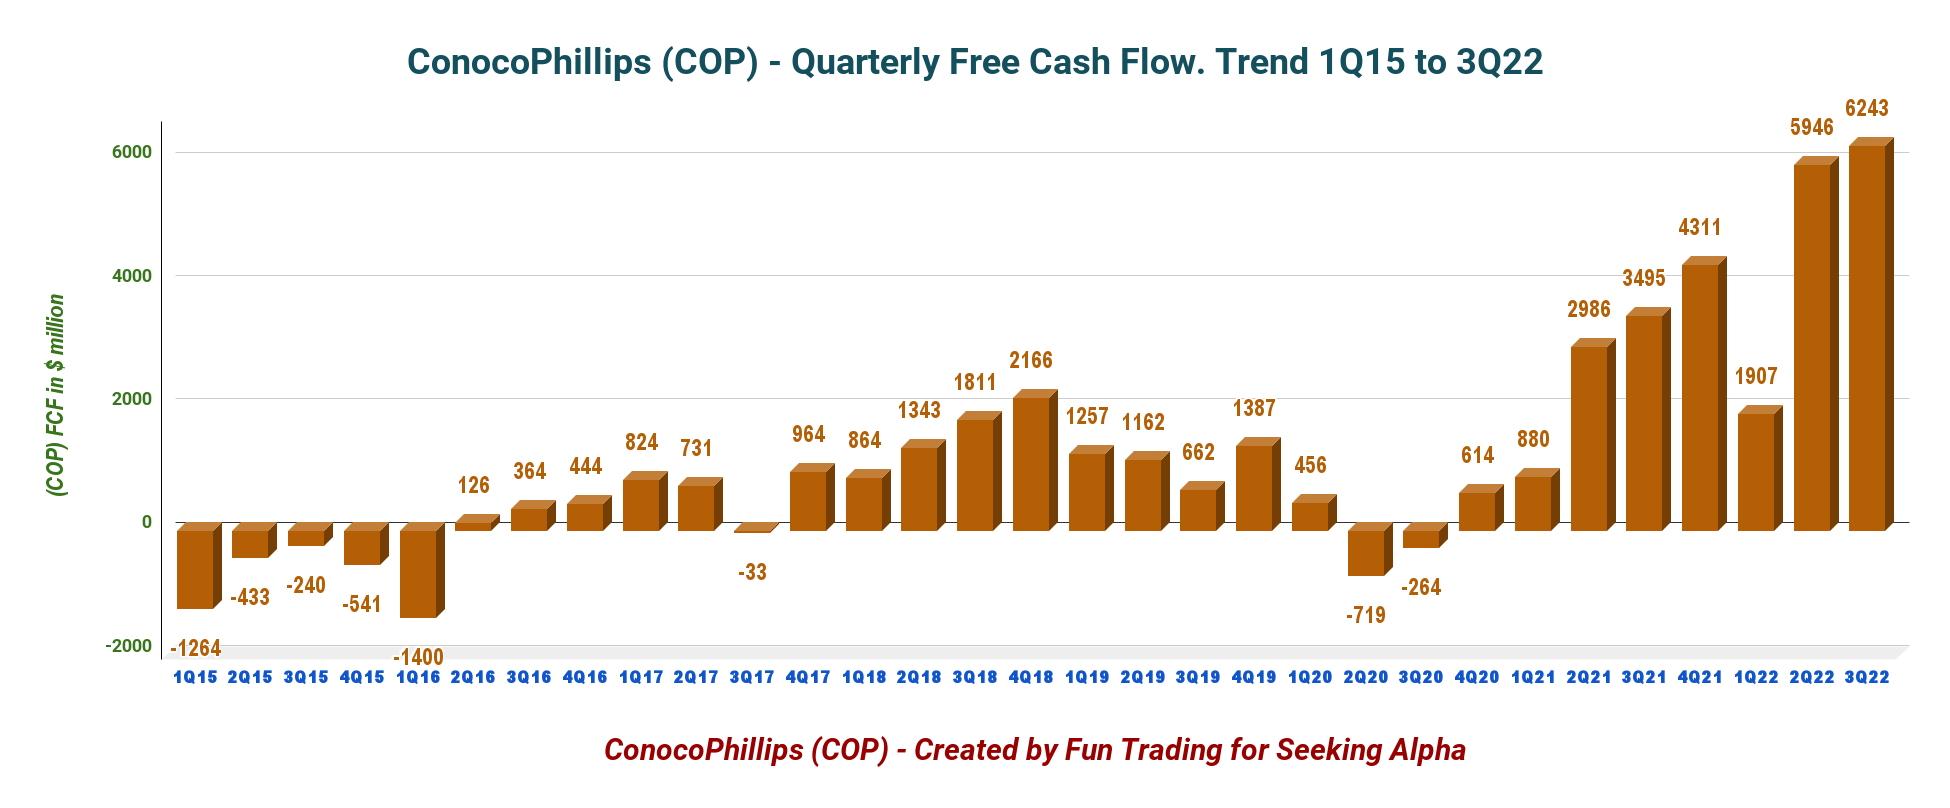
- The trailing 12-month free cash flow for ConocoPhillips is $18,407 million. COP recorded a third-quarter FCF of $6,243 million.
- The quarterly dividend is $1.21 per share yearly or a yield of 4.2%.
ConocoPhillips paid a quarterly dividend of $0.51 per share in the first quarter and an extra dividend of $0.70 per share, for a total of $1.21.
The company announced a $20-billion increase in the existing share repurchase program to $45 billion.
3 – Oil production was 1,754K Boepd in 3Q22
COP Quarterly oil equivalent production history (Fun Trading) Production jumped to a record of 1,754k Boepd, up from 1,544K Boepd the same quarter a year ago. COP shows a one-year trailing production of over 1,700K Boepd. The increase was due to the following: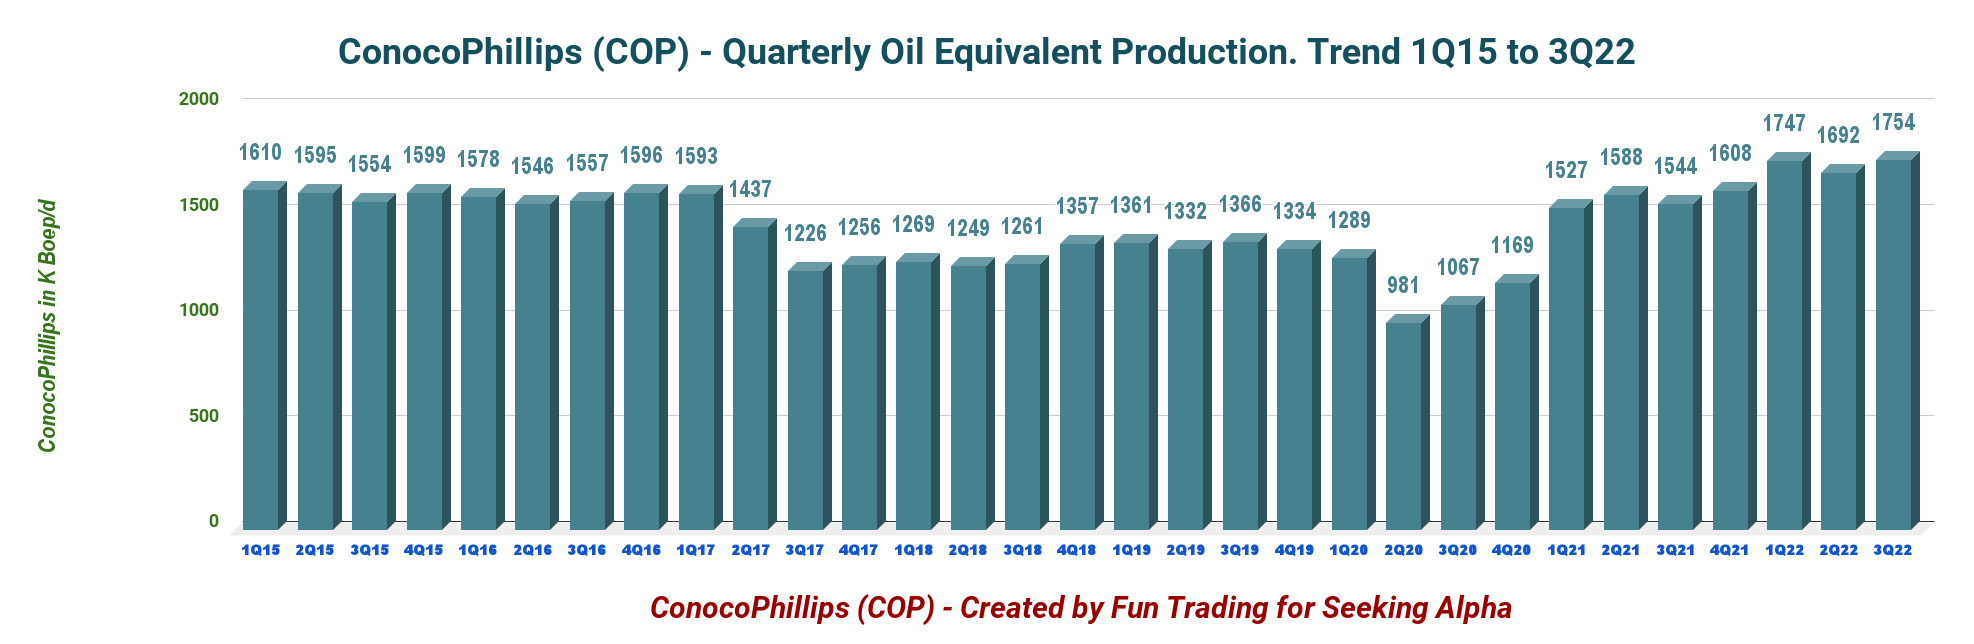
3.1 – Details per commodity: 51% was crude oil
COP Oil equivalent production detail 3Q22 (Fun Trading)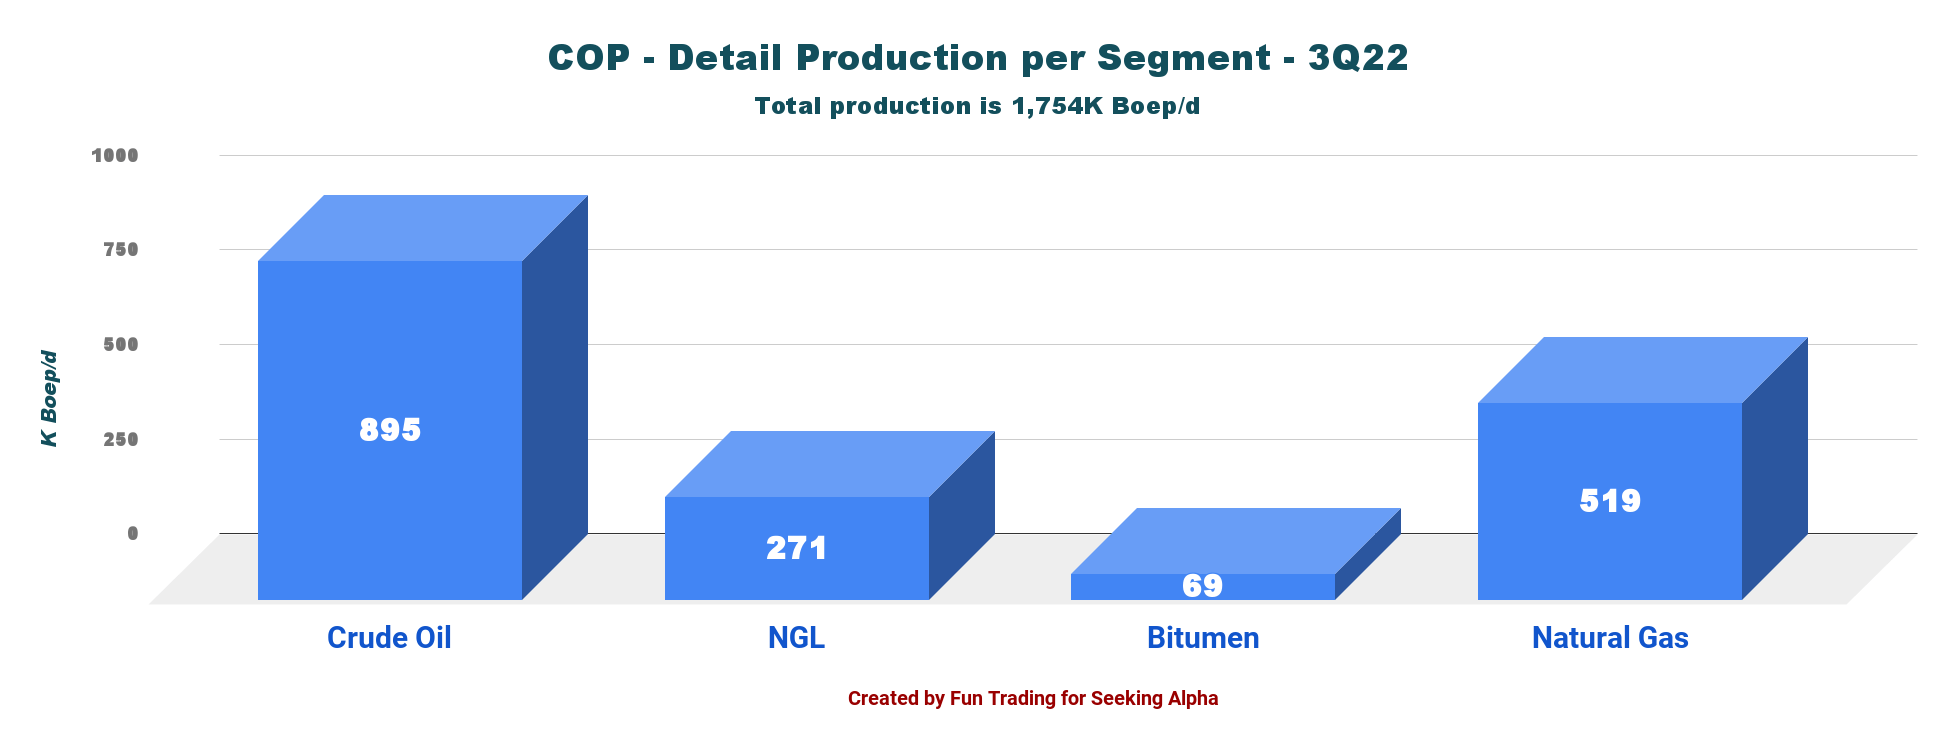
3.2 – Global average oil equivalent prices realized by ConocoPhillips (crude oil, natural gas, NGL, etc.)
The global average oil equivalent price increased significantly yearly, from $56.92 to $83.07.
COP oil price history (Fun Trading)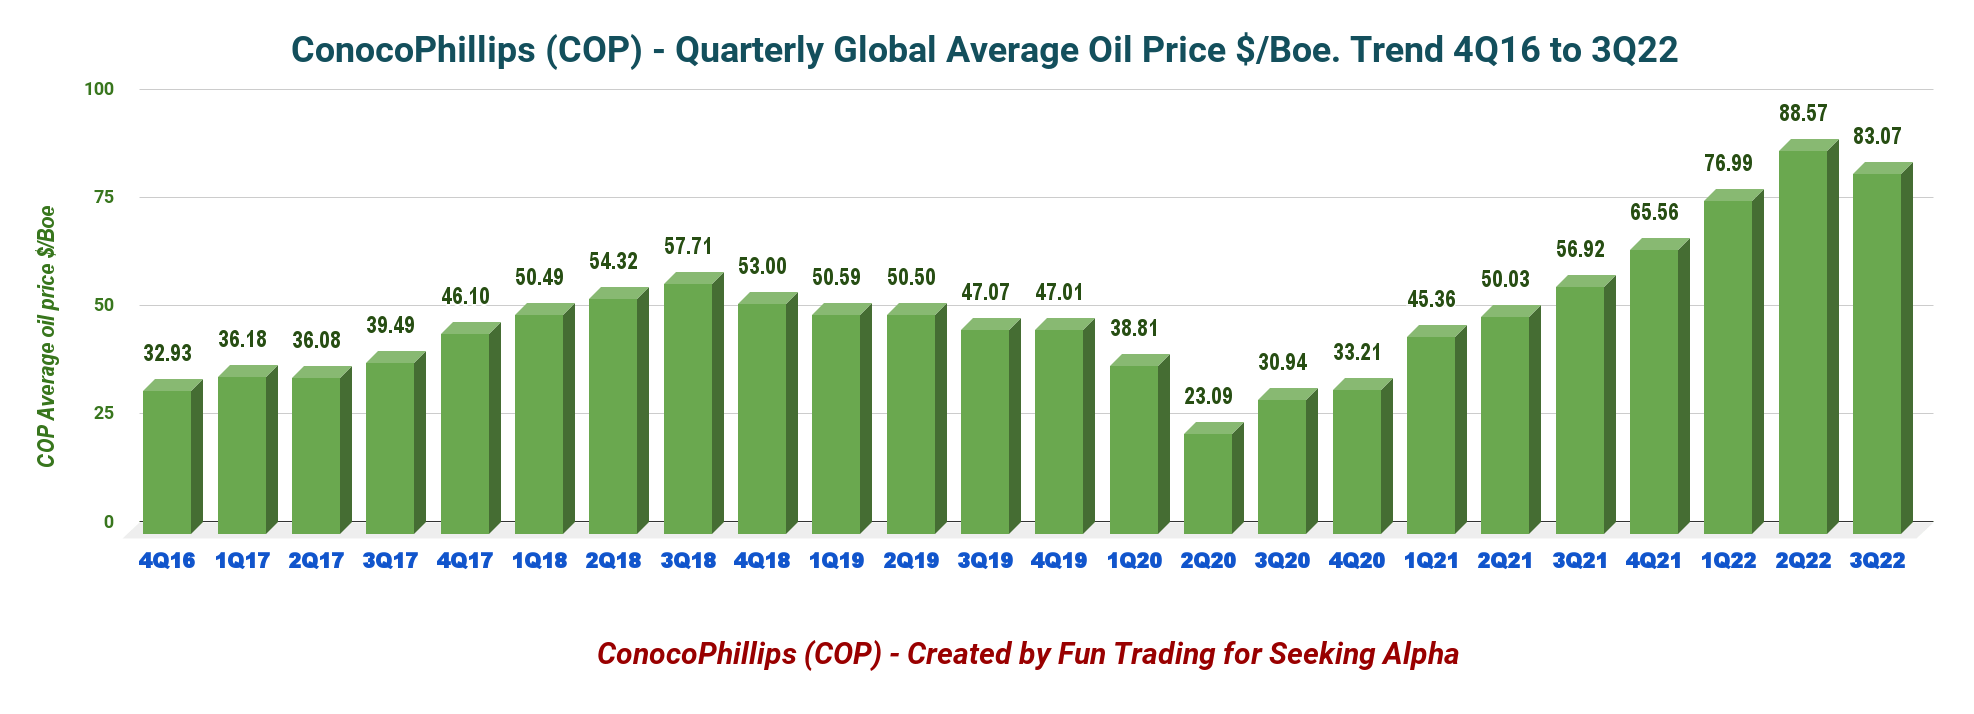
- The average crude oil price for the third quarter was $97.56 per barrel, significantly increasing from the year-ago realization of $70.43.
- Realized natural gas liquids price was $49.77 per barrel, from the year-ago quarter’s $41.19.
- The average natural gas price for third-quarter 2022 was $13.04 per thousand cubic feet, up from the year-ago period’s $5.94.
- The average realized bitumen price was $49.77 per barrel, an increase from the year-ago level of $41.19.
However, the fourth quarter will show a significant decrease in the global average oil equivalent price down to an estimated below $70.
3.3 – Production in Boepd per region. The Lower 48 is the most significant part, with 57.8%
COP Production per region 3Q22 (Fun Trading)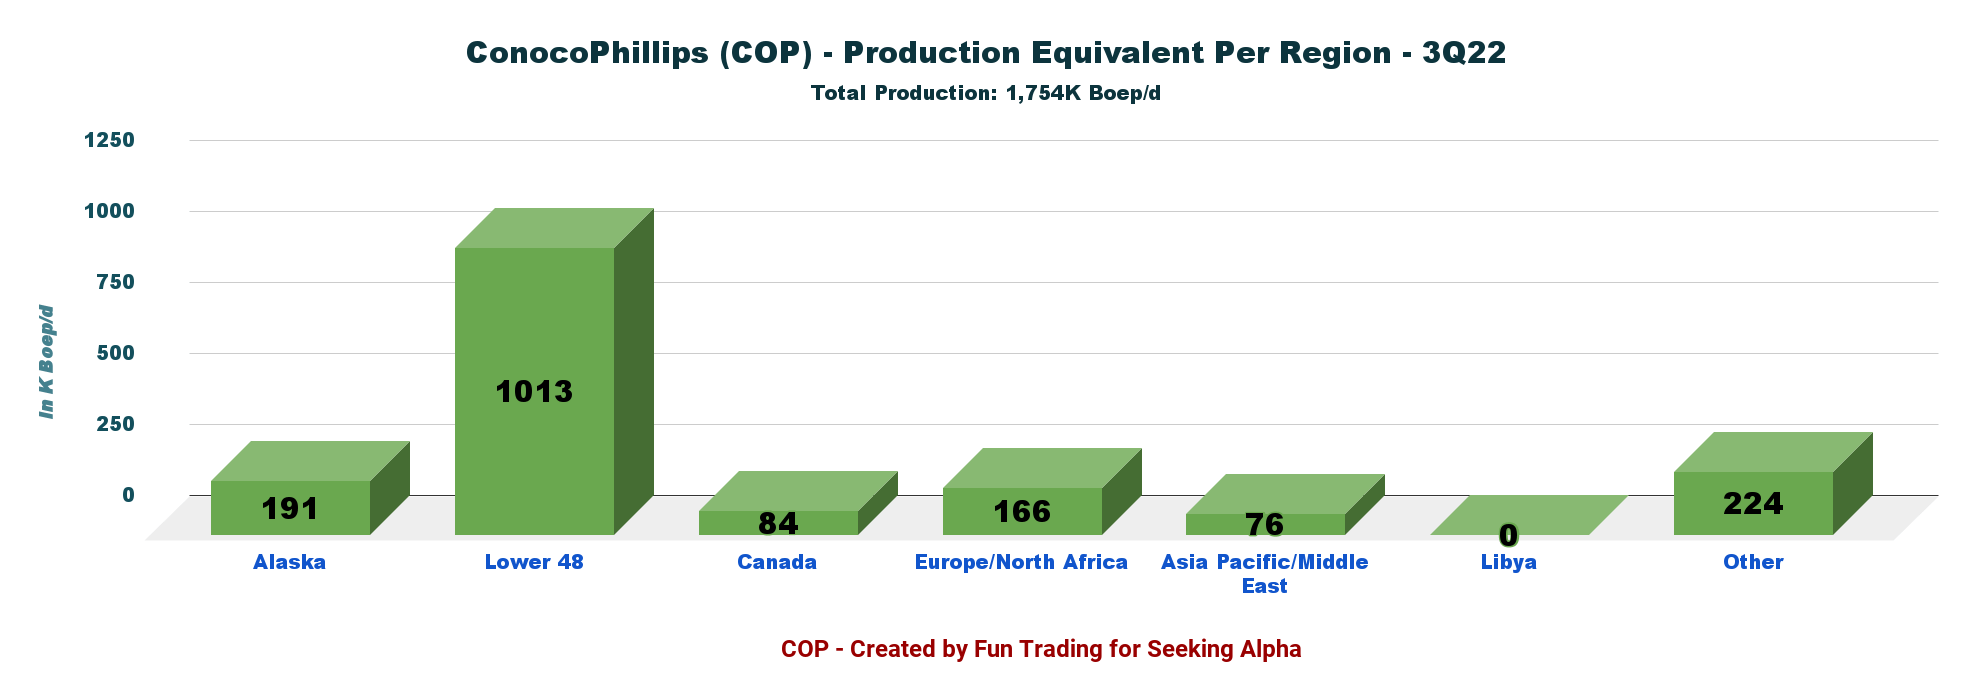
3.4 – Lower 48 production details
Production in the Lower 48 represents 56.3% or 967K Boepd of the total output. The Lower 48 comprises the three US shale basins (Eagle Ford, Bakken, Permian Basin, Delaware) and the Gulf of Mexico production, but not Alaska.
COP Oil Production Lower 48 history (Fun Trading)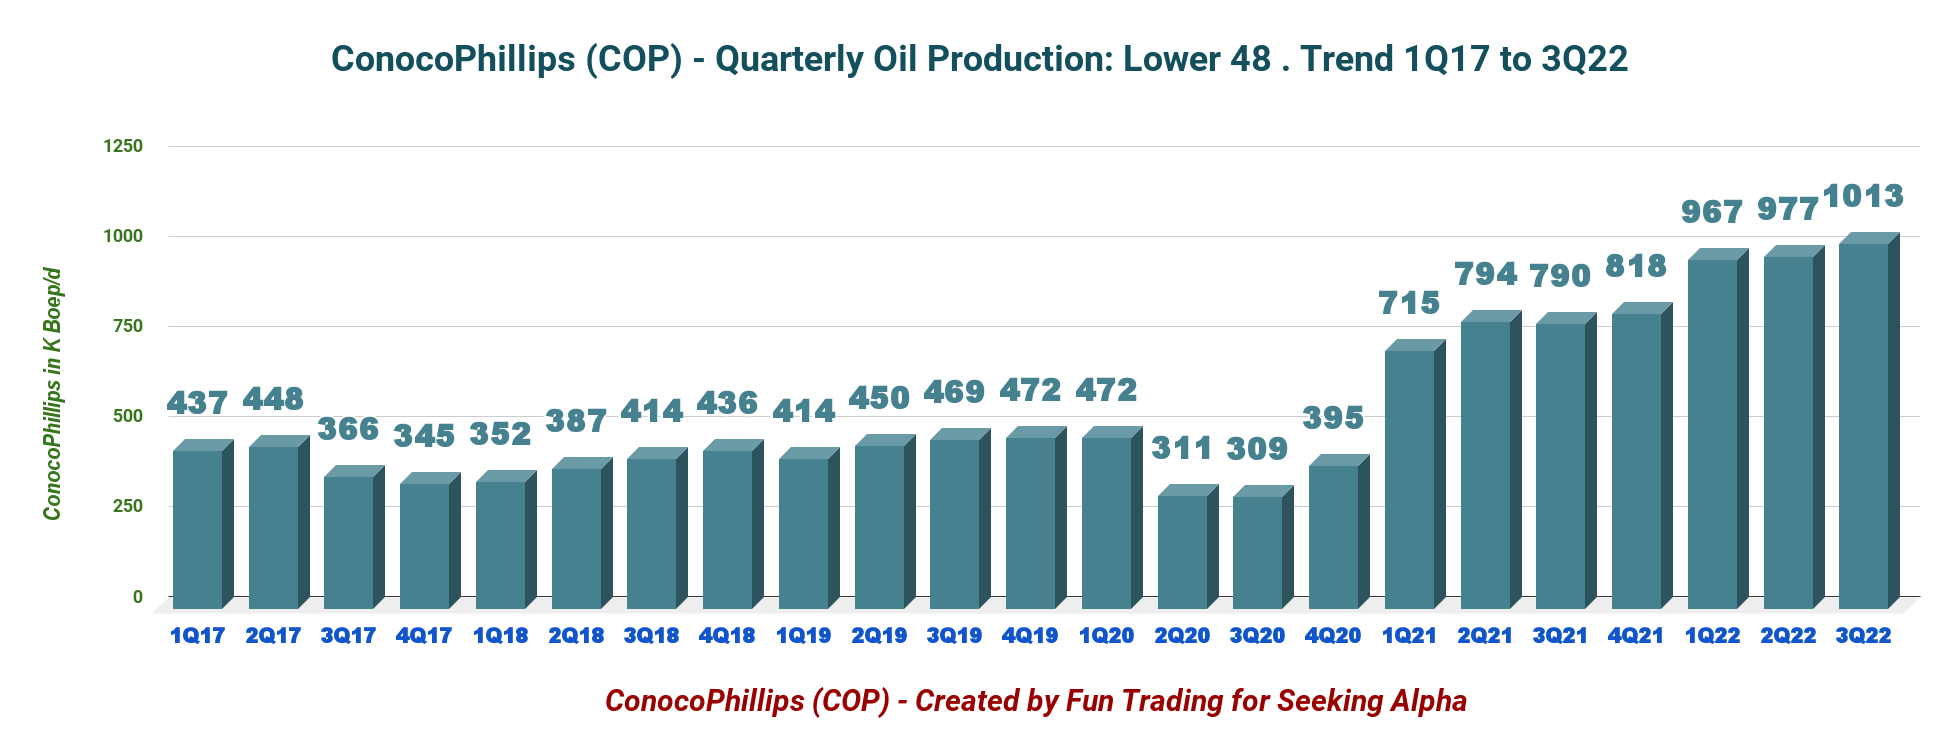
3.5 – Details per US Shale Basins
Below is the production for Eagle Ford, Bakken, and Permian basins.
COP Quarterly Oil production US shale basins (Fun Trading)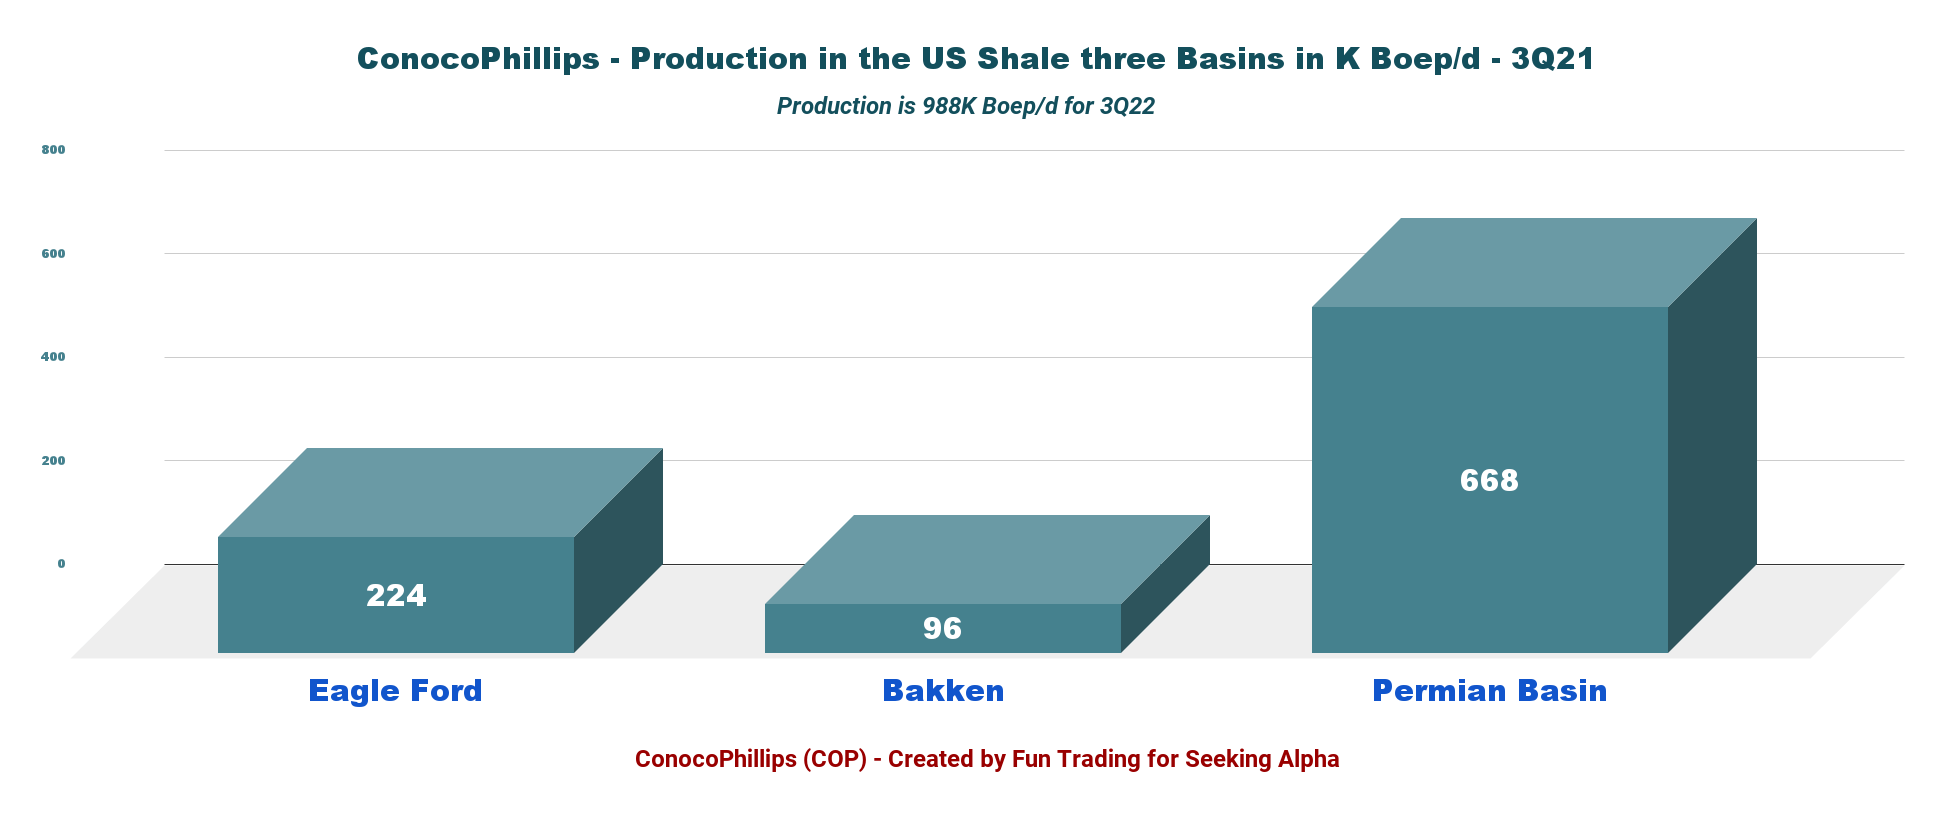
The Permian Basin is the most prolific for the company and represents 38.1% of the total output.
4 – Guidance 2022
COP 2022 Guidance (COP Presentation) Production for 4Q22 is expected to remain strong quarter over quarter to 1.77 million Boepd, with a full-year CapEx increasing to $7.5 billion.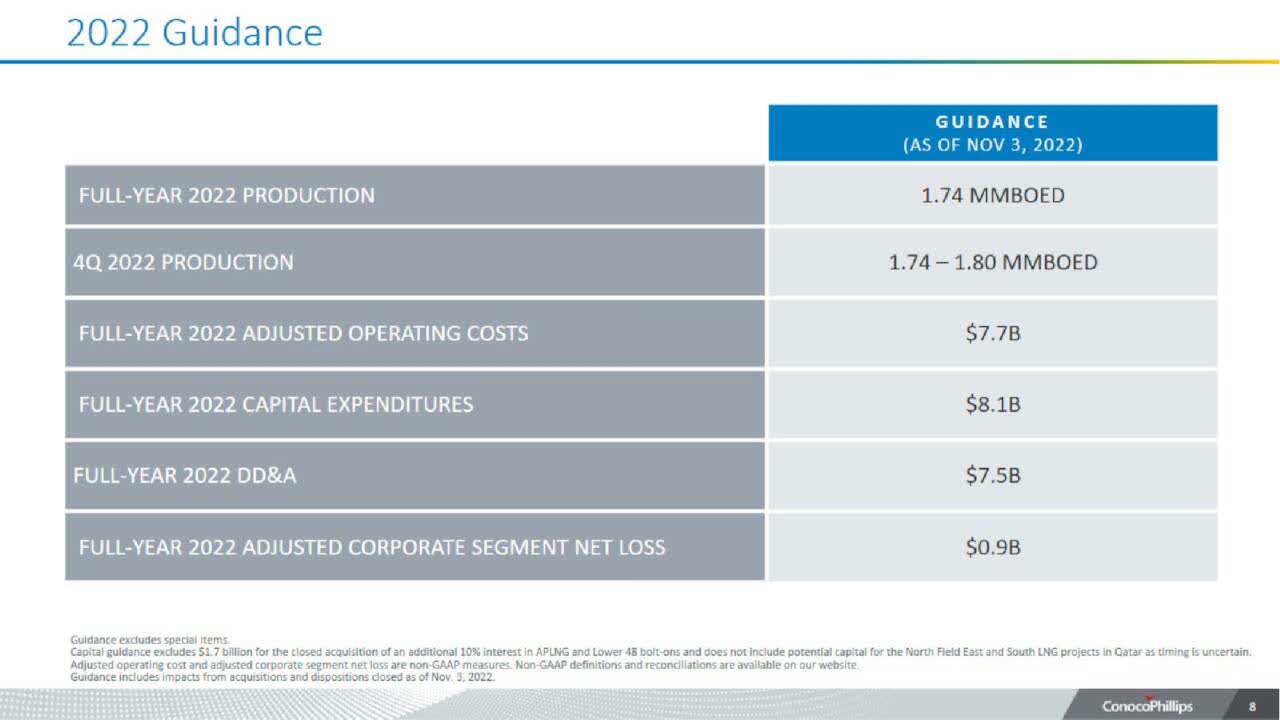
5 – Net Debt is now $6.54 billion in 3Q22
COP Quarterly Cash versus Debt history (Fun Trading) Net debt is about $6.54 billion, with total cash of $10.422 billion – Debt-to-capitalization ratio of 0.346x. Excellent profile.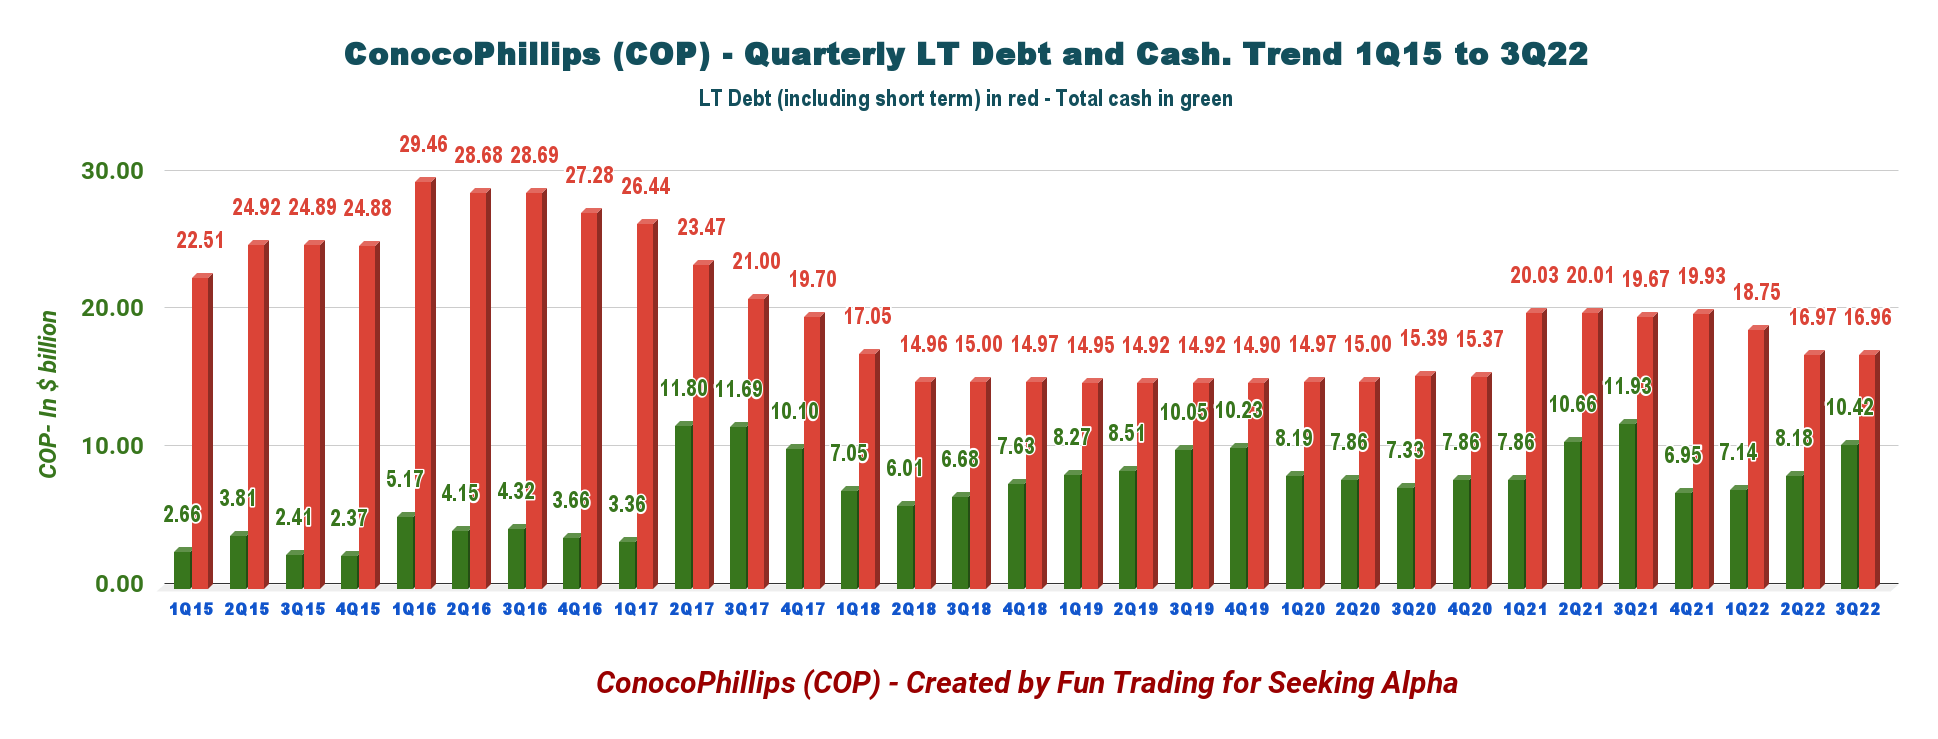
Technical Analysis And Commentary
COP TA Chart short-term (Fun Trading StockCharts)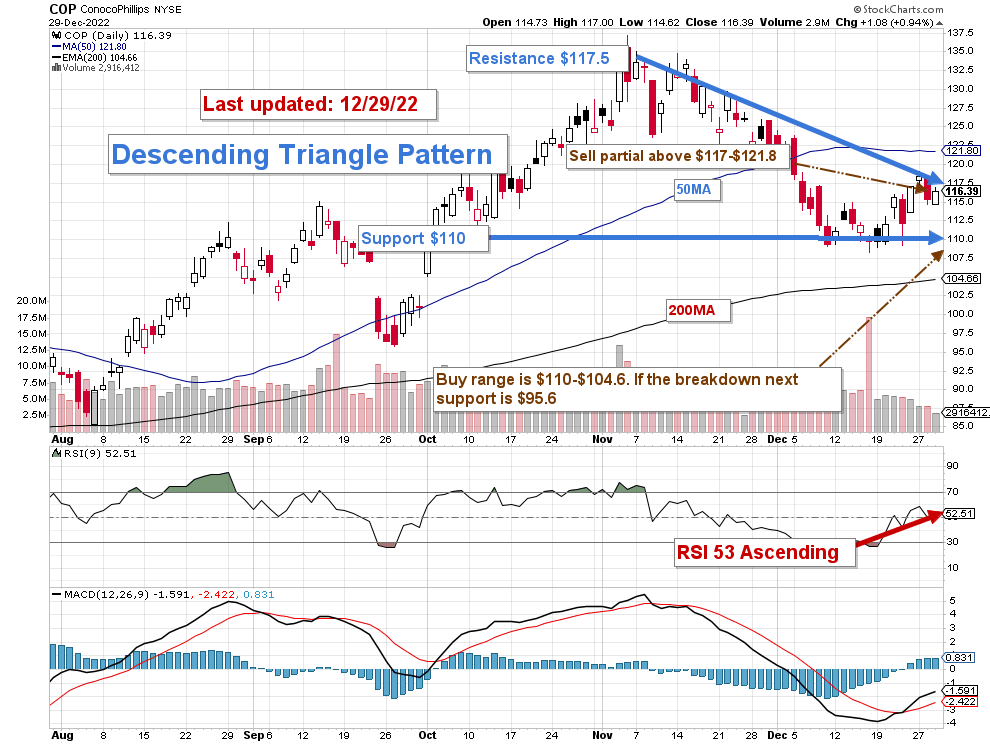
Note: The chart is adjusted for the dividend.
COP forms a descending triangle pattern with resistance at $117.5 and support at $110. The descending triangle is a bearish formation that usually forms during a downtrend as a continuation pattern.
Oil and gas prices have dropped significantly since June and are barely up on a one-year basis.
COP Brent and NG price 1-Year chart (Fun Trading StockCharts)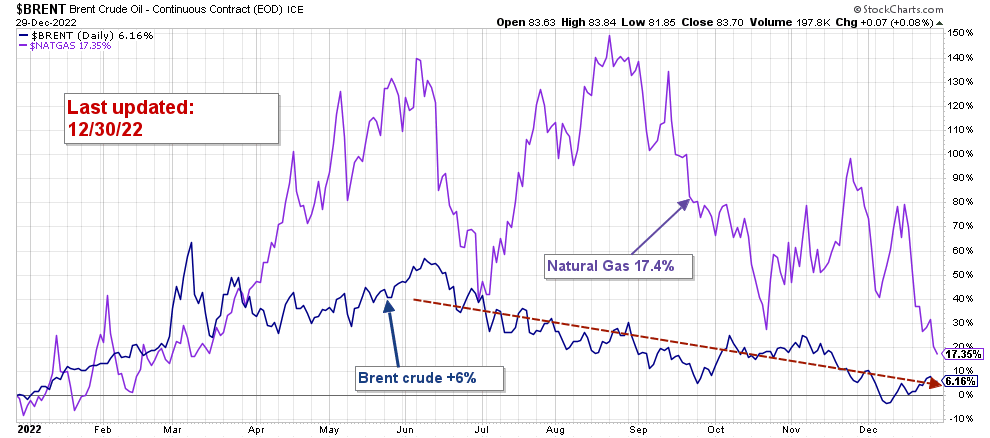
On December 14, 2022, Goldman Sachs expected an oil market surplus in early 2023 and slashed its price forecasts. The analyst firm cut its Brent oil forecasts for the first and second quarter of 2023 to $90 and $95 a barrel from $115 and $105 per barrel, respectively.
A target price that I see optimistic considering the risk of a global recession next year that will affect demand. I am more pessimistic and do not see how oil stocks can perform well in 2023 with a bearish economy and dropping demand.
Technically, oil prices have been weakening since June, and the situation in China may continue to put pressure on the prices. However, on a positive note, we are now close to solid support between $70 and $75, which should limit the downside.
Thus, I think selling 30-40% (Trading LIFO) between $117 and $121.8 and waiting for $110 and $104.6 with potential lower support at $95.6 to consider adding again is a wise winning strategy.
Warning: The TA chart must be updated frequently to be relevant. It is what I am doing in my stock tracker. The chart above has a possible validity of about a week. Remember, the TA chart is a tool only to help you adopt the right strategy. It is not a way to foresee the future. No one and nothing can.
Author’s note: If you find value in this article and would like to encourage such continued efforts, please click the “Like” button below to vote for support. Thanks.
Be the first to comment