

Cindy Ord/Getty Images Entertainment
Introduction
I like to begin my articles, when I can, by reviewing any previous coverage I’ve shared on a stock. In Comcast’s (NASDAQ:CMCSA) case, I first purchased the stock at the very beginning of the March 2020 crash on February 28th, 2020, and wrote about it a few days later in my article “Recent Buy: Comcast“. Since then, the stock price has been on a rollercoaster ride and the total returns have essentially been even.
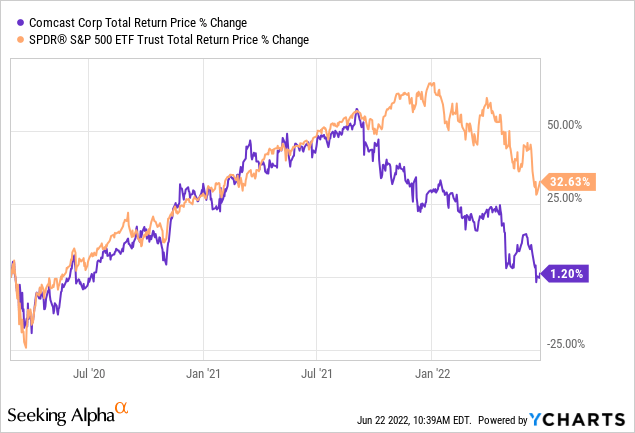
As you can see in the chart above, Comcast’s stock mostly mirrored that of the S&P 500 until about nine months ago, when there was a big divergence in performance, with Comcast underperforming the index. I think this divergence was unjustified and it’s likely that Comcast now trades at a very good relative value compared to the wider market (which is what I’ll make the case for in this article).
While I haven’t written any articles on Comcast since 2020 on Seeking Alpha, on my YouTube channel, I made a very clear case on 2/15/21 that Comcast stock was a superior value that Disney (DIS) and that Disney shareholders who wanted exposure to similar media assets should sell Disney stock and buy Comcast instead. Here is how they have performed since that video.
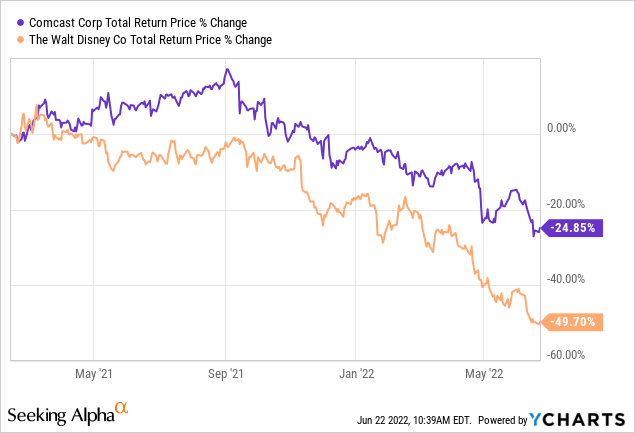
While Comcast stock is down since then, it is down much less than Disney stock which has rightfully cratered -50%, and I think even after the declines in both stocks Comcast remains the better alternative.
In this article, I will reexamine Comcast stock and explain why, even if we have a recession and deep bear market, Comcast should be a better relative value than the S&P 500, and over the longer term, is probably a good absolute value as well.
How Cyclical Are Earnings?
Before I begin this analysis, I’ll check the business’s long-term earnings patterns in order to ensure that the business is a proper fit for this sort of analysis. If the historical earnings 1) don’t have a long enough history 2) are erratic in nature, or 3) are too cyclical, then I either avoid analyzing the stock altogether or I use a different type of analysis that is more appropriate.
FAST Graphs
Over the past 20 years, Comcast has grown earnings every single year except during the heart of the COVID pandemic when parks and theaters were completely shut down, and even then, EPS growth only fell -17%. This isn’t a very cyclical business overall, and if not for the extraordinary circumstances of the COVID pandemic, historically Comcast has been, and still is, a secular growth company. For stocks like this, it is appropriate to use an earnings-based valuation analysis like the one I’ll use in this article.
Market Sentiment Return Expectations
In order to estimate what sort of returns we might expect over the next 10 years, let’s begin by examining what return we could expect 10 years from now if the P/E multiple were to revert to its mean from the previous economic cycle. Since we have had a recent recession (albeit an unusual one), I’m starting this cycle in fiscal year 2015 and running it through 2022’s estimates.
FAST Graphs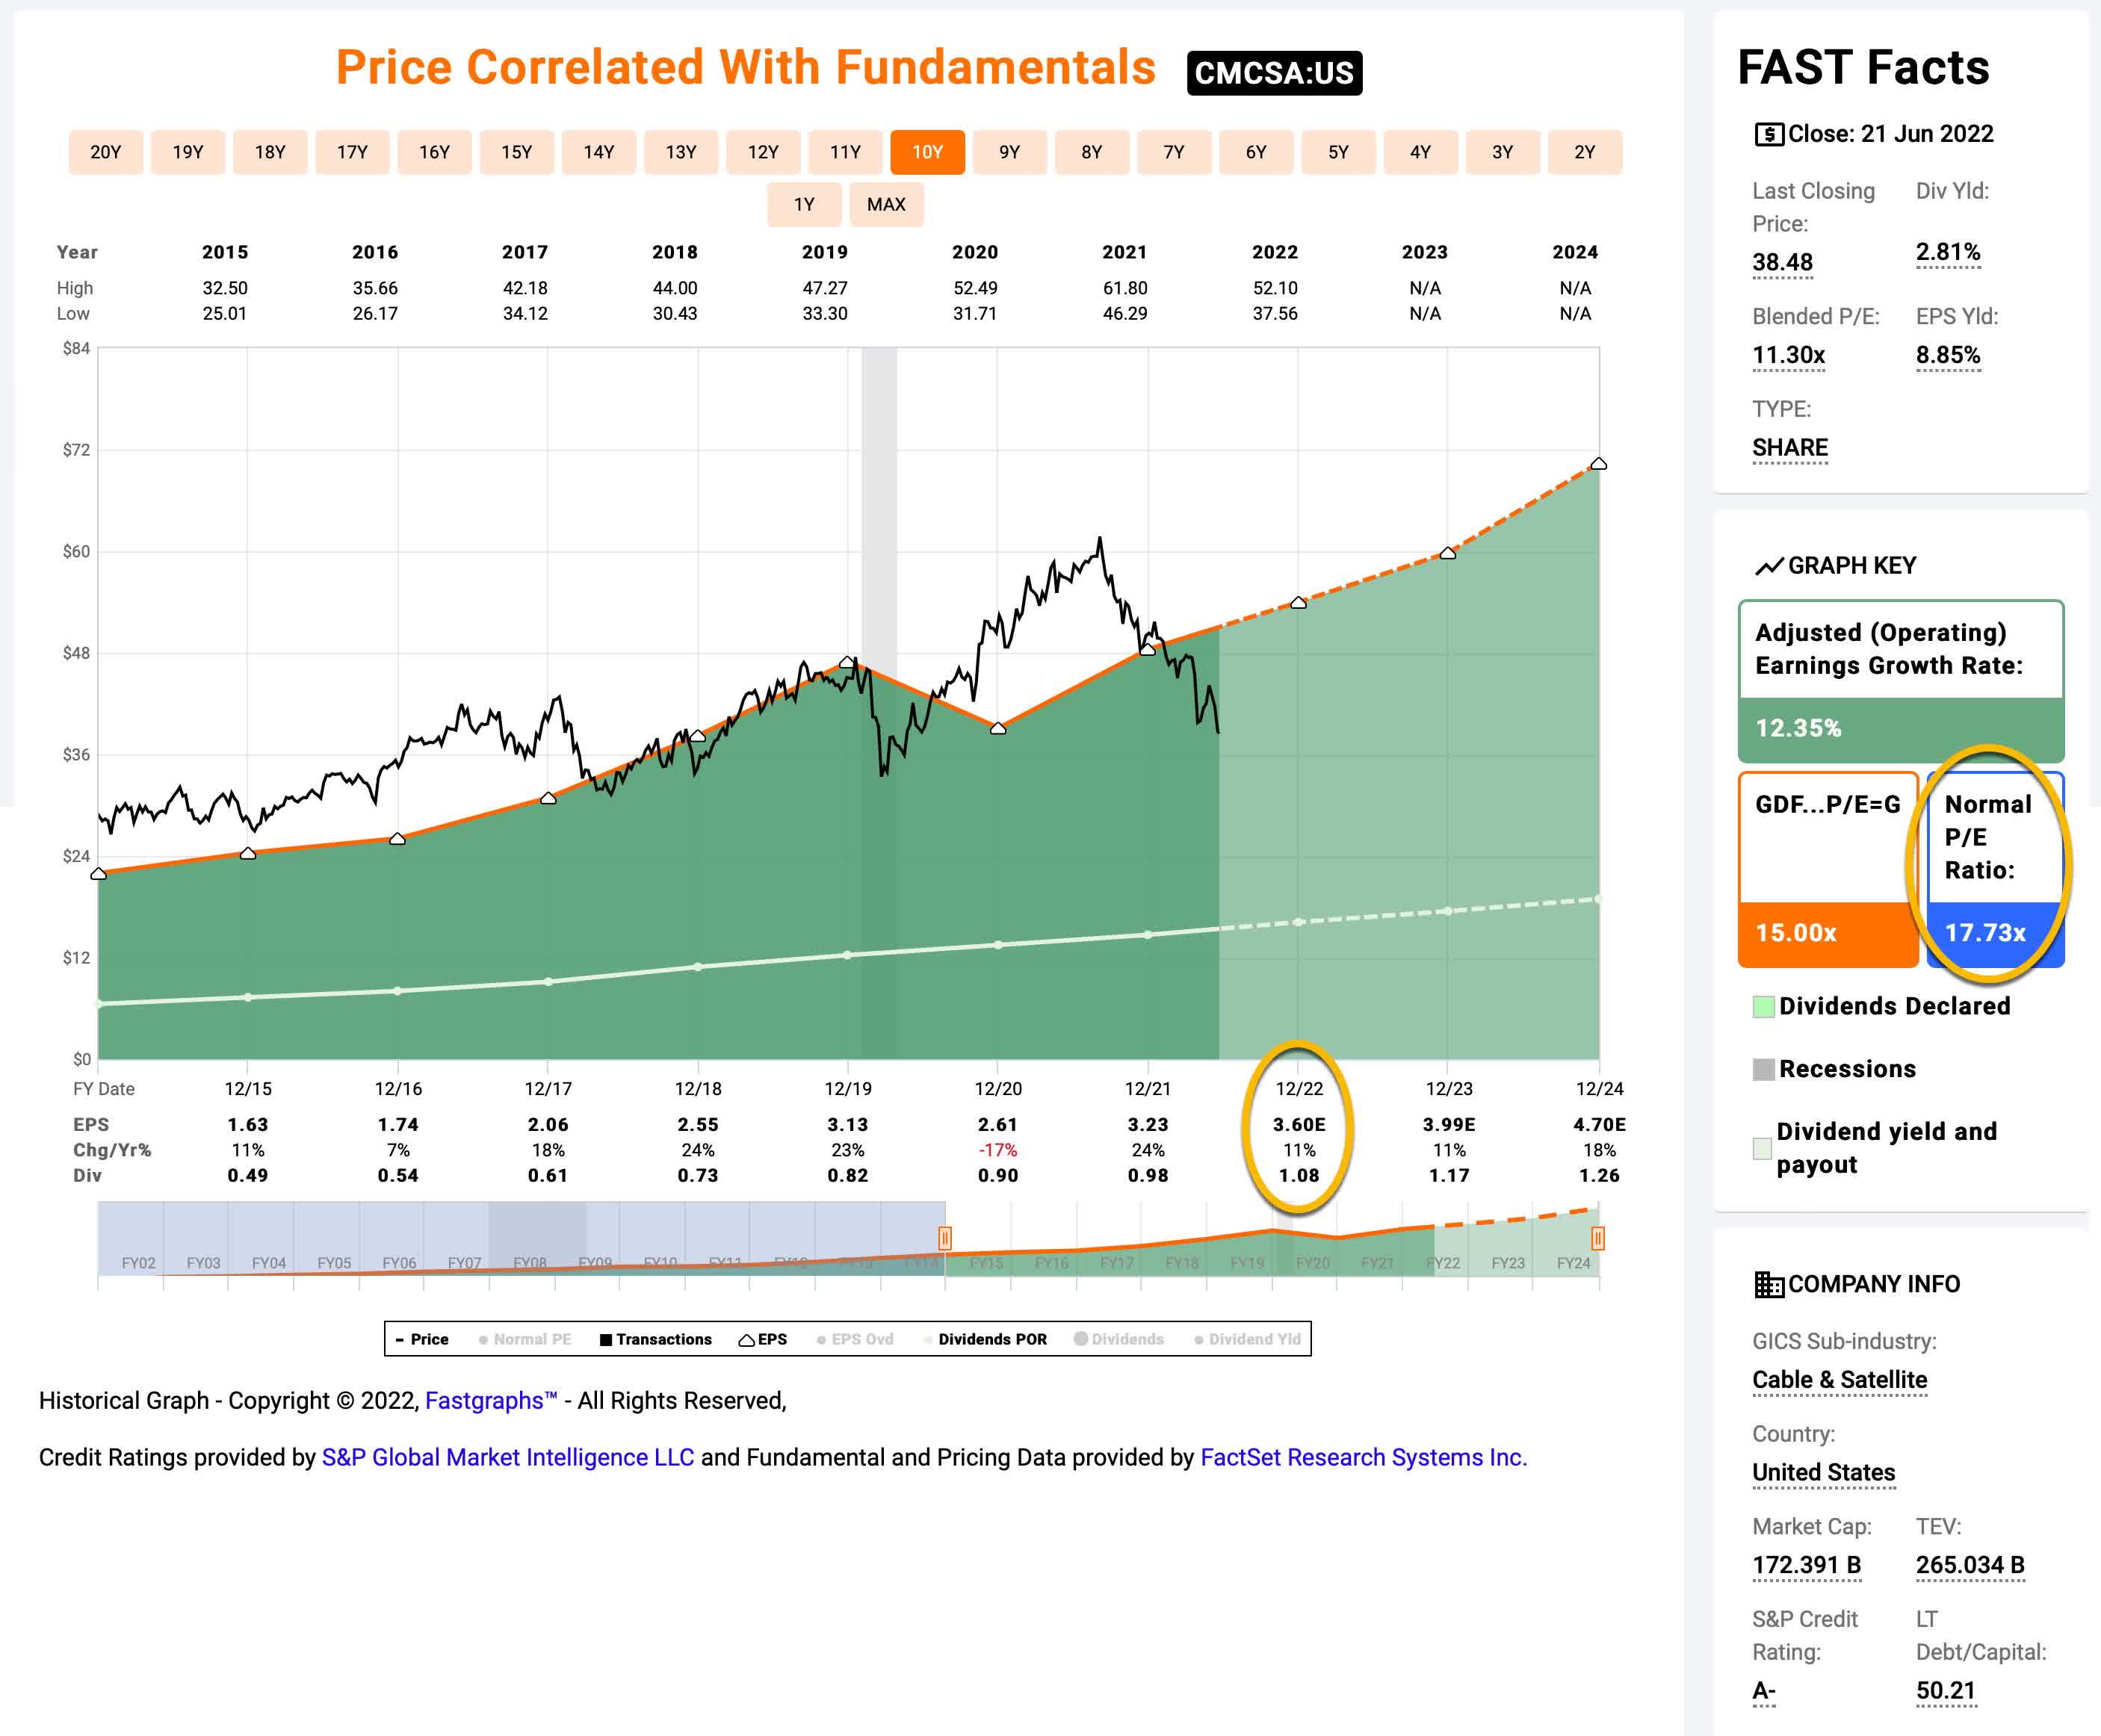
Comcast’s average P/E from 2015 to the present has been about 17.73 (the blue bar circled in gold on the FAST Graph). Using 2022’s forward earnings estimates of $3.60 (also circled in gold), Comcast has a current P/E of 10.79. If that 10.79 P/E were to revert to the average P/E of 17.73 over the course of the next 10 years and everything else was held the same, Comcast’s price would rise and it would produce a 10-Year CAGR of +5.09%. That’s the annual return we can expect from sentiment mean reversion if it takes ten years to revert. If it takes less time to revert, the return would be higher.
Business Earnings Expectations
We previously examined what would happen if market sentiment reverted to the mean. This is entirely determined by the mood of the market and is quite often disconnected, or only loosely connected, to the performance of the actual business. In this section, we will examine the actual earnings of the business. The goal here is simple: We want to know how much money we would earn (expressed in the form of a CAGR %) over the course of 10 years if we bought the business at today’s prices and kept all of the earnings for ourselves.
There are two main components of this: the first is the earnings yield and the second is the rate at which the earnings can be expected to grow. Let’s start with the earnings yield (which is an inverted P/E ratio, so, the Earnings/Price ratio). The current earnings yield is about +9.24%. The way I like to think about this is, if I bought the company’s whole business right now for $100, I would earn $9.24 per year on my investment if earnings remained the same for the next 10 years.
The next step is to estimate the company’s earnings growth during this time period. I do that by figuring out at what rate earnings grew during the last cycle and applying that rate to the next 10 years. This involves calculating the EPS growth rate since 2015, taking into account each year’s EPS growth or decline, and then backing out any share buybacks that occurred over that time period (because reducing shares will increase the EPS due to fewer shares).
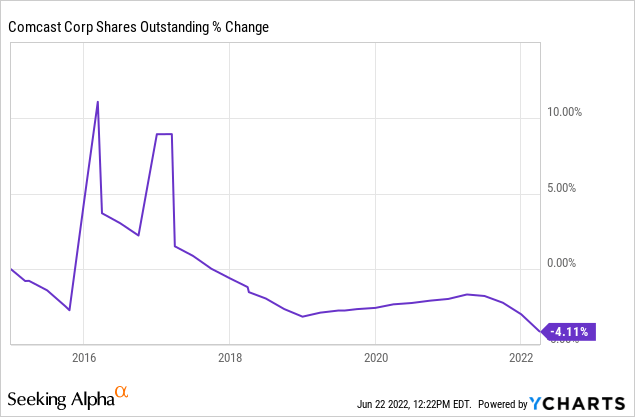
Comcast has only bought back about 4% of the company since 2015, but I will adjust for both these buybacks and 2020’s earnings decline in my earnings growth expectations. After doing that, I estimate an earnings growth rate of about +11.21%. That’s a little more conservative than the FAST Graphs rate of +12.35%.
Next, I’ll apply that growth rate to current earnings, looking forward 10 years in order to get a final 10-year CAGR estimate. The way I think about this is, if I bought Comcast’s whole business for $100, it would pay me back $9.24 plus +11.21% growth the first year, and that amount would grow at +11.21% per year for 10 years after that. I want to know how much money I would have in total at the end of 10 years on my $100 investment, which I calculate to be about $273.54 (including the original $100). When I plug that growth into a CAGR calculator, that translates to a +10.59% 10-year CAGR estimate for the expected business earnings returns.
10-Year, Full-Cycle CAGR Estimate
Potential future returns can come from two main places: market sentiment returns or business earnings returns. If we assume that market sentiment reverts to the mean from the last cycle over the next 10 years for Comcast, it will produce a +5.09% CAGR. If the earnings yield and growth are similar to the last cycle, the company should produce somewhere around a +10.59% 10-year CAGR. If we put the two together, we get an expected 10-year, full-cycle CAGR of +15.68% at today’s price.
My Buy/Sell/Hold range for this category of stocks is: above a 12% CAGR is a Buy, below a 4% expected CAGR is a Sell, and in between 4% and 12% is a Hold. That makes Comcast a “Buy” at today’s price. (I take small, 1% weighted positions when using this strategy.)
An Additional Consideration: Recession P/E
The second consideration with Comcast has to do with downcycles and Comcast stock’s likely decline during a recession. Since I have judged we are currently late in the economic cycle, I prefer to not hold stocks that are likely to fall dramatically during recessions, and I have sold most of the stocks in my portfolio that have a history of deep price or earnings declines during recessions (with a few exceptions), which is what I’ve spent most of my time writing about this year.
For the less-cyclical stocks that I’m currently buying, I require that their forward P/E ratios be lower than previous recession-low monthly average P/E ratios. Below I have illustrated the deeper ones over the past two decades for Comcast.
FAST Graphs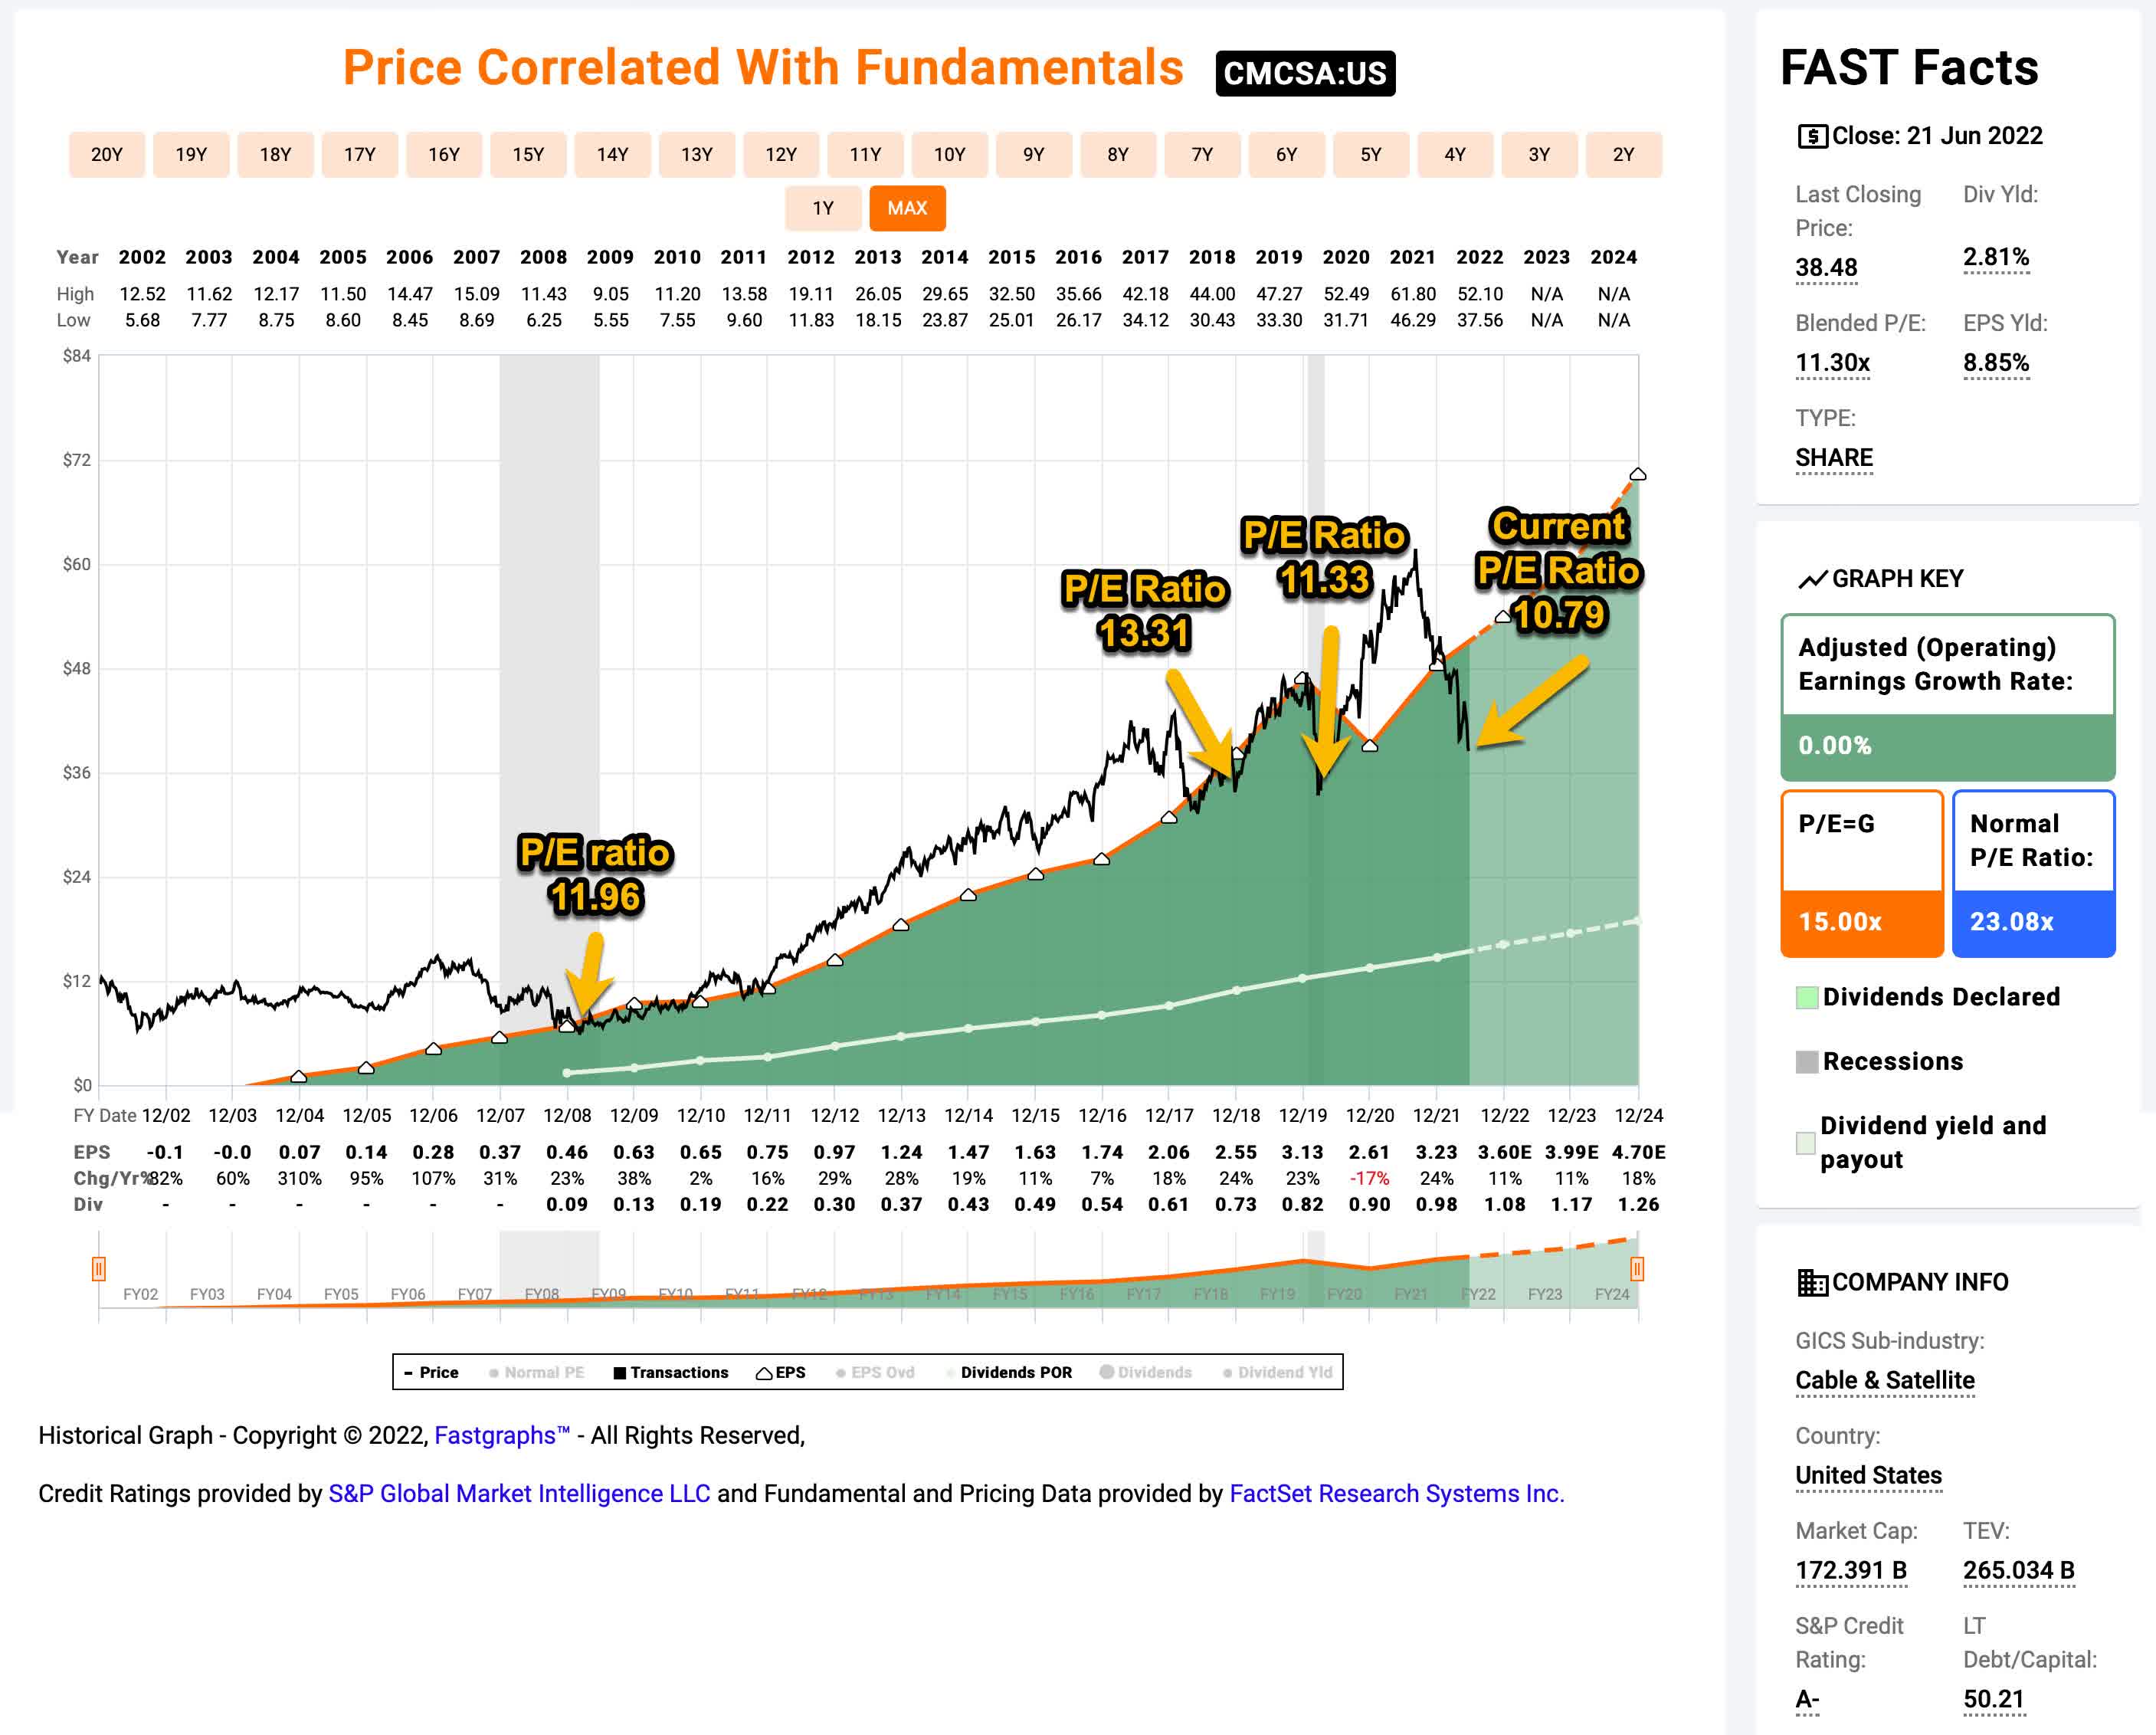
Currently, Comcast’s forward P/E ratio is lower than all of its other trough monthly P/Es. It’s currently even lower than the P/Es experienced during the Great Recession and the COVID crash in March of 2020, so it meets this standard.
So Why Is It Priced This Cheap?
I think there are a couple of reasons why it’s priced so cheap. The first reason is that basically all media stocks have had a tremendous sell-off. As I noted earlier, Disney has sold off twice as much as Comcast, and Netflix (NFLX) has fallen 3x as much. I think Comcast is at least partially being unjustifiably thrown out with stocks like Disney that actually deserved to sell off that much. So, I would describe part of the reason for the sell-off as driven by sentiment and momentum reasons. As a longer-term investor, these don’t concern me.
The more legitimate potential reason for the sell-off is the expectation of cord-cutting by consumers that will hurt Comcast’s cable business, which is its primary business. I think this is a reasonable worry for longer-term investors. However, I think that if this cordcutting trend is slow enough, that Comcast will be able to adapt over time.
A quick anecdote: I actually was a very early cordcutter. Back before 2009, when I first bought and moved into my house, I lived in apartments. If cable was included, that was fine with me, but I never paid for it directly. When I first moved into my house in January of 2009, my local cable company (not Comcast) offered me a really cheap introductory rate for an internet/cable bundle, and so I signed up. When prices moved up to normal after the first year, I canceled, and paid for some cheap DSL internet via Century Link. I would never pay what they charged for cable (which amazingly still included commercials!). So, for well over a decade we used just basic internet, Netflix and Amazon Prime at my house. And year by year, the selection of streaming content got better. So, I think cable is an extremely poor value, personally.
However, most people are not like me. Even if they don’t want cable, they still need internet and Comcast has that, too, and in many places where people live, there are limited competitors. Sure, now we can get high-speed internet over our phones, but the amount of data most people desire is going to exceed what they can cheaply get through their mobile phone service. It’s much better, especially if you work from home as many people do now, to have a dependable high-speed land-line connection. We had a new company start-up in our town so I now have fiber from a cable competitor, but I still know many, many people who do not have that option and their cable company still has the upper hand if they like to watch television (particularly sports), which many people do.
My point here is that we don’t know how fast the cord-cutting will happen or what the ultimate effect will be on Comcast, but if you think, as I do, it will be a relatively slow process and that Comcast will have time to adjust and grow their other businesses in the meantime, then a stock trading at a 10-11 P/E, when the market average is 50% higher than that, is a decent bet to make.
Additionally, the reopening of the economy post-COVID should help Comcast’s parks and entertainment businesses, and they have already shown with Peacock that they had the most rational business plan for streaming, when both Disney and Netflix are struggling to adapt.
Conclusion
There are many stocks in this market that benefitted from stimulus and COVID whose earnings expectations are wildly optimistic over the next 6-9 months. Because Comcast was not treated as a COVID winner, its stock has remained reasonably priced the past couple of years. Unlike Disney, whose earnings still have yet to recover from the downturn, Comcast’s earnings have fully recovered already, and have some reopening catalysts still in front of them. Sure, if we have a recession, Comcast will probably suffer like many other businesses, but I don’t think they will suffer as much because they are already priced for a recession.
All that said, my valuation method is designed for an unconcentrated portfolio, so I do not suggest taking a position bigger than a 1% or 2% portfolio weighting, without performing deeper work.
Be the first to comment