

Marcio Silva/iStock Editorial via Getty Images
Columbia Research Enhanced Core ETF (NYSEARCA:RECS) is an around $31.5 million passively managed fund focused on delivering alpha by selecting the most promising stocks from the Russell 1000 index using a proprietary ranking system. Its methodology mixes size, value, quality, and momentum factors.
Its pivotal advantage is the returns the ETF has delivered over its relatively short history. Though most smart-beta funds I have assessed to date have been rather inconsistent or even utterly lackluster performers compared to the major market barometers, failing to tilt the portfolio towards one factor or another to benefit either from a growth rally or tailwinds of the capital rotation or both at the same time, RECS has surprised me positively.
This is not an all-weather outperformer as the even most sophisticated strategies based on profound, at times peculiar hedge-fund research have rainy days sometimes, but in general, returns RECS delivered over the key periods like one year and YTD are fairly strong.
Alas, the ETF has a few weaknesses that should be considered carefully. They mar the otherwise perfect picture. Our today’s article will be paying due attention to both pros and cons, explaining why RECS is a Hold despite the promising strategy.
Key facts briefly
- RECS was incepted on 25 September 2019.
- The fund’s investment adviser as of the prospectus is Columbia Management Investment Advisers, LLC.
- The expense ratio is 15 bps, substantially below the asset class median, more than adequate for a fund with a sophisticated strategy.
- The standardized yield was ~1.5% as of end-February. Distributions are made annually.
- It has delivered a one-year total return of ~14% vs. the S&P 500 ETF’s (IVV) ~11.5%.
Investment strategy
RECS has a nicely calibrated, cash flows-mindful strategy revolving around scrupulous fundamental analysis.
The Beta Advantage Research Enhanced U.S. Equity Index, which the fund is supposed to track as close as possible, has “a rules-based strategic beta approach” designed to identify names that drag the Russell 1000 index down and remove them to engender higher returns.
As a quick refresher, this bellwether index is tracked by the iShares ETF (IWB); it has a more flexible, less dogmatic methodology than the venerable S&P 500 as candidates for inclusion can be even loss-making, which, in theory, means inherently weaker quality. However, this impacted the RECS portfolio only slightly, if at all: as we will be explaining shortly below, the profitability characteristics of the portfolio are close to excellent.
In the 1000 cohort, managers assign each stock a proprietary rating ranging from 1 (the best) to 5 (the worst). The rating is based on the three variables: quality (namely profits quality), value (assessed using the cash flow yield; it is not clear if sector-specific ratios are used for REITs and financials), and catalyst (measured using price momentum).
Stocks are rated within the respective sector. Those with a score of 1 or 2 can join the index and then end up in the fund’s portfolio, though there are nuances discussed in greater depth on page 4 of the prospectus.
Constituents’ weights are influenced by two variables 1) their market capitalizations in the Russell 1000 index; 2) the sector neutrality principle. Reconstitutions and rebalancing are held biannually, in June and December.
It is said in the prospectus that a portfolio of 325-400 equities is the typical result of the methodology, but that figure might go up or down freely. The current iteration of the fund’s equity basket has 368 stocks.
The overlap between the smart-beta fund and IWB is slightly south of 50%, as of my calculations, which implies the RECS holdings occupy around half of the bellwether ETF portfolio.
Seemingly, nothing too complicated, though with a reasonable degree of sophistication. The golden mean? Perhaps. Anyway, it has allowed this investment vehicle to deliver rather decent returns since its inception.
The table below that illustrates the total returns over the September 2019 – March 2022 period speaks for itself. RECS not only managed to best IWB but also delivered though marginally (just a few bps) but still better Sharpe and Sortino ratios than the bellwether fund. So during the domination of three major market narratives (first, it was the trade war, then the coronavirus crisis, after that, the early post-pandemic economic revival when the status of growth stocks has withered), the fund’s strategy marginally outperformed the parent index, despite lagging a bit in 2020 (~15.4% vs. ~20.8%) and thanks to grossly successful 2021 (~33.2% vs. ~26.3%).
Created by the author using data from Portfolio Visualizer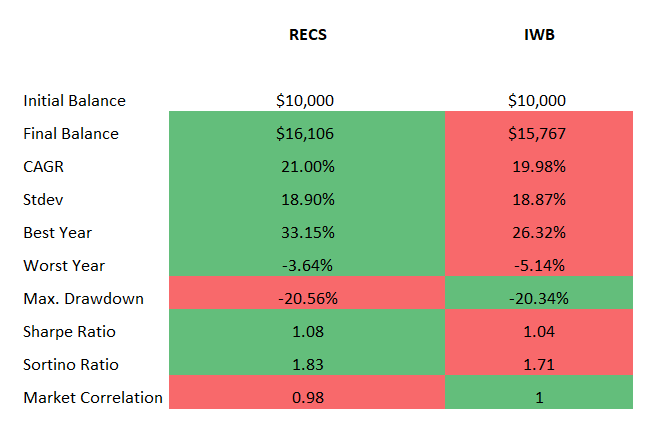
This year, while the growth stocks were hit hard amid the bear party, RECS has been chugging along, being ahead of IWB all the time. Rather an encouraging start for the hawkish year.
Seeking Alpha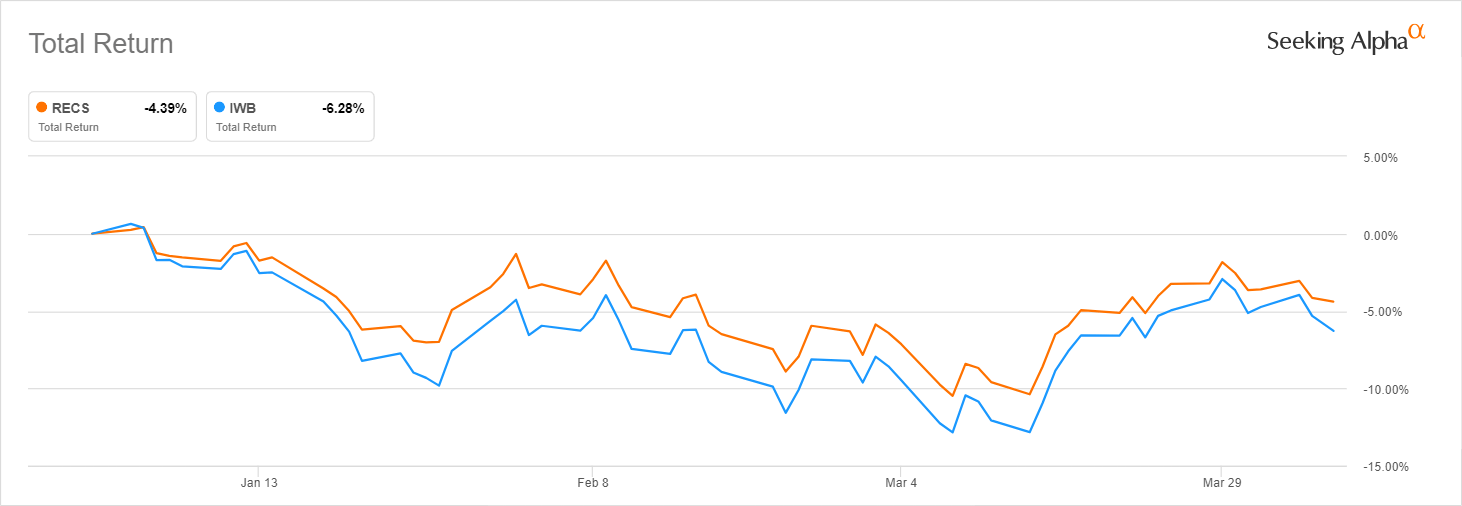
Please note that the price returns are way softer since the ETF made a sizeable short- and long-term gains distribution; the chart below shows the one-year performance.
Seeking Alpha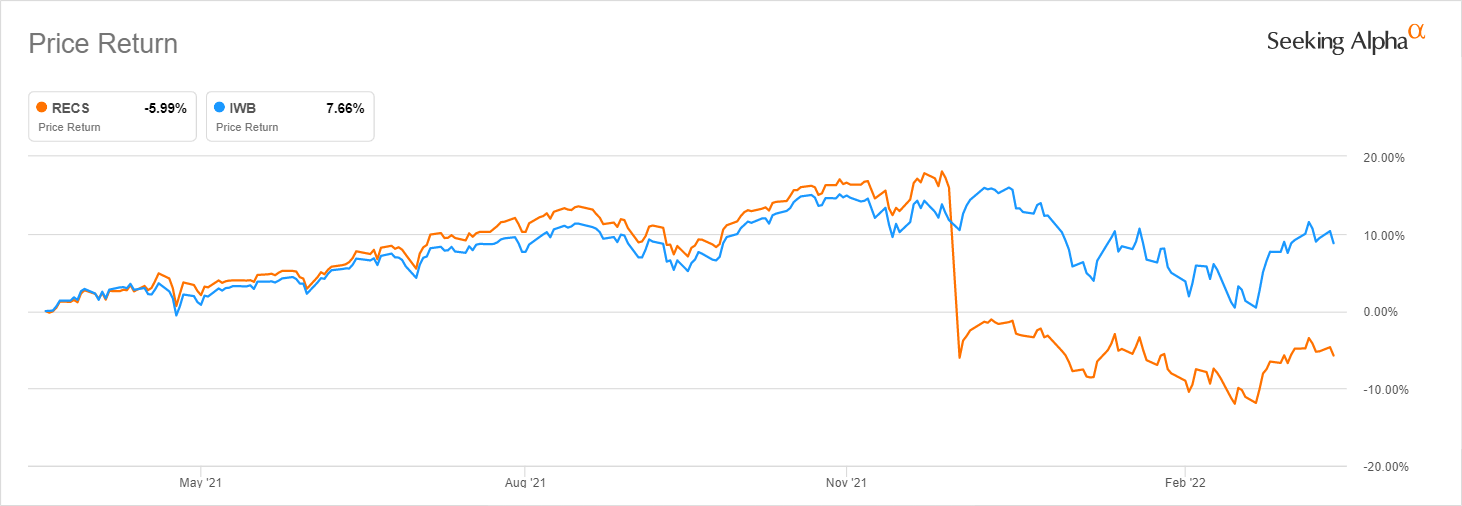
Current holdings. Quant insights
As of April 1, the fund had Apple (AAPL), Microsoft (MSFT), and McDonald’s (MCD) in the top trio, with weights of 8.6%, 7.3%, and 3%, respectively. Overall, the portfolio is dominated by mega- and large-caps, with only ~5.7% allocated to the mid-cap universe.
I have used the Quant data downloaded from the screener to take a closer look at the portfolio from a different angle, paying due attention to factors. The following conclusions can be drawn:
- Most of the holdings are overvalued, with ~56% of the portfolio having Valuation grades of D+ or worse. I highlight it as a risk, though I have become more optimistic about expensive stocks after the sell-off in growth names earlier this year.
- Growth stocks can be found, though their weight is just below 20%, more or less in line with most bellwether funds.
- Quality is solid. Over 95% of the stocks have at least B- Profitability grade. The A (+/-) names have ~86%.
- The fund has less than 1% allocated to unprofitable companies, mostly biotechs. Cash-burning firms (outside the financial sector) have even less, around 0.3%. Again, they are mostly biotechnology players, like Seagen (SGEN) and Natera (NTRA).
The scatter plot below is supposed to give a bit more color. It combines the cash flow and EBITDA margins. Financials, as well as a few outliers with negative figures, were removed, so the chart covers ~84.4% of the portfolio.
Created by the author using the data from the fund and Seeking Alpha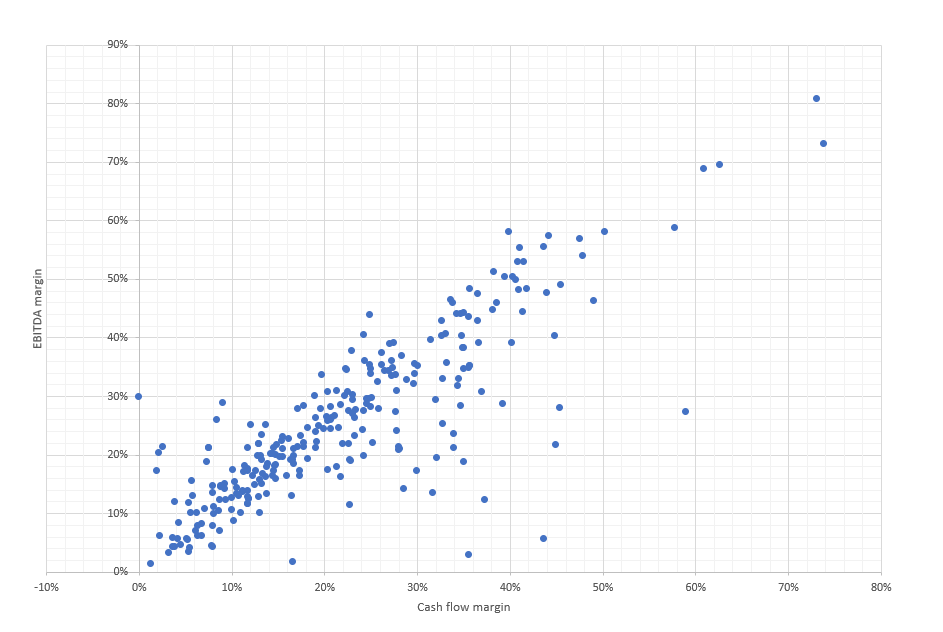
As it can be seen clearly, most of the players have robust margins, which indicates that the fund’s exposure to the quality factor should shore up its returns going forward.
Reasons for skepticism
AUM and liquidity (which directly impacts an ability to build/trim a position quickly and at the desired price) are essential considerations for an ETF investor. They are not to be ignored, regardless of a strategy’s merits.
Unfortunately, here is an Achilles’ heel of RECS. We see encouraging one- and six-month AUM trends, with a much softer one-year period; meanwhile, average daily volumes are way behind the class medians.
Seeking Alpha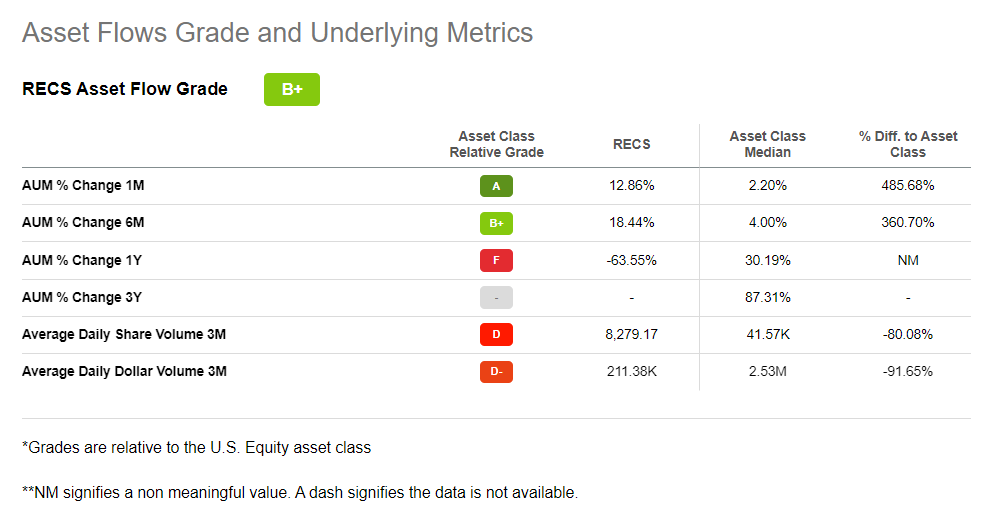
Besides, its website shows the median bid/ask spread of 0.36%; to put things into perspective, IWB has 0.02%.
Another issue is distributions made only annually. That makes the fund a suboptimal play for investors focused on consistent, regular income.
Conclusion
I am of an opinion that RECS should appeal to investors seeking low-cost smart-beta fundamental strategies. Funds that use intricate factors and their combinations rarely outperform the market, but RECS that bets on the best Russell 1000 constituents is a surprising, encouraging exception that managed to outmaneuver the bellwether ETF, though over a relatively short period.
Nevertheless, there are downsides not to be ignored. Small AUM and a rather unsatisfying bid/ask spread are amongst them. If RECS had a larger portfolio and better liquidity, it would almost certainly be a Buy. Alas, it is a Hold for now.
Be the first to comment