

Natural Gas Forecast – Talking Points
- Natural gas’s total loss for March approached 6% following Februarys bullish action
- EIA storage level below its 5-year average, opening price up to demand-side sensitivity
- Price action sees the heating gas between two key moving averages after selling off
Discover what kind of forex trader you are
Natural gas prices struggled in March, dropping nearly 6%. The lackluster performance for the heating gas follows a solid performance in February, when prices rose over 8% from the prior month, as colder-than-average weather swept across the United States. A major US storm system in Texas also helped bolster prices. However, March’s performance pressured prices back within January’s trading range.
Thursday presents a possible opportunity for some directional movement in price, with the US Energy Information Administration’s (EIA) Weekly Natural Gas Storage Report set to cross the wires. According to the DailyFX Economic Calendar, analysts expect a build of 21 billion cubic feet (Bcf) in underground storage for the week ending March 26. Naturally, an inventory build is bearish for prices.
A surprise draw, however, may exert some upside force on prices when considering the current inventory dynamic. While underground storage levels remain within the historical maximum – minimum price range, inventory is below the 5-year average, according to the EIA. The below-average supply level, through supply-demand dynamics, leaves prices potentially more exposed to demand-side factors. The chart below – provided by the EIA – illustrates the storage levels.
EIA UNDERGROUND INVENTORY LEVELS
Sourced from EIA.gov
That said, the latest 8-14 day temperature outlook from the National Weather Service’s (NWS) Climate Prediction Center shows a high probability for below-average temperatures across the Western United States. The forecast also shows a very high probability, over 70%, for colder days in Alaska for the period ranging from April 8 to April 14. Warmer weather in other parts of the US may counteract the demand picture, however.
NOAA 8-14 DAY OUTLOOK TEMPERATURE PROBABILITY
Sourced from noaa.gov
Natural Gas Technical Outlook
March trading has seen natural gas drop below its 100-day Simple Moving Average (SMA), with a subsequent selloff to the supportive 200-day SMA. Moreover, prices pierced below a trendline from the September swing low between those two key SMAs. Overall, price action is now on a more bearish footing given these technical moves.
The 200-day SMA serves as the most pertinent level of support currently. However, a move in either direction may likely see prices stall or pause before continuing. The 38.2% Fibonacci retracement level is on tap for a near-term zone of support. To the downside, the 61.8% Fib may deflect a moderate selloff. A bullish crossover between the MACD and its signal line appears to have had helped guide prices higher earlier this week. A continued move to cross above its center line may further bolster some bullish energy.
Natural Gas Daily Chart
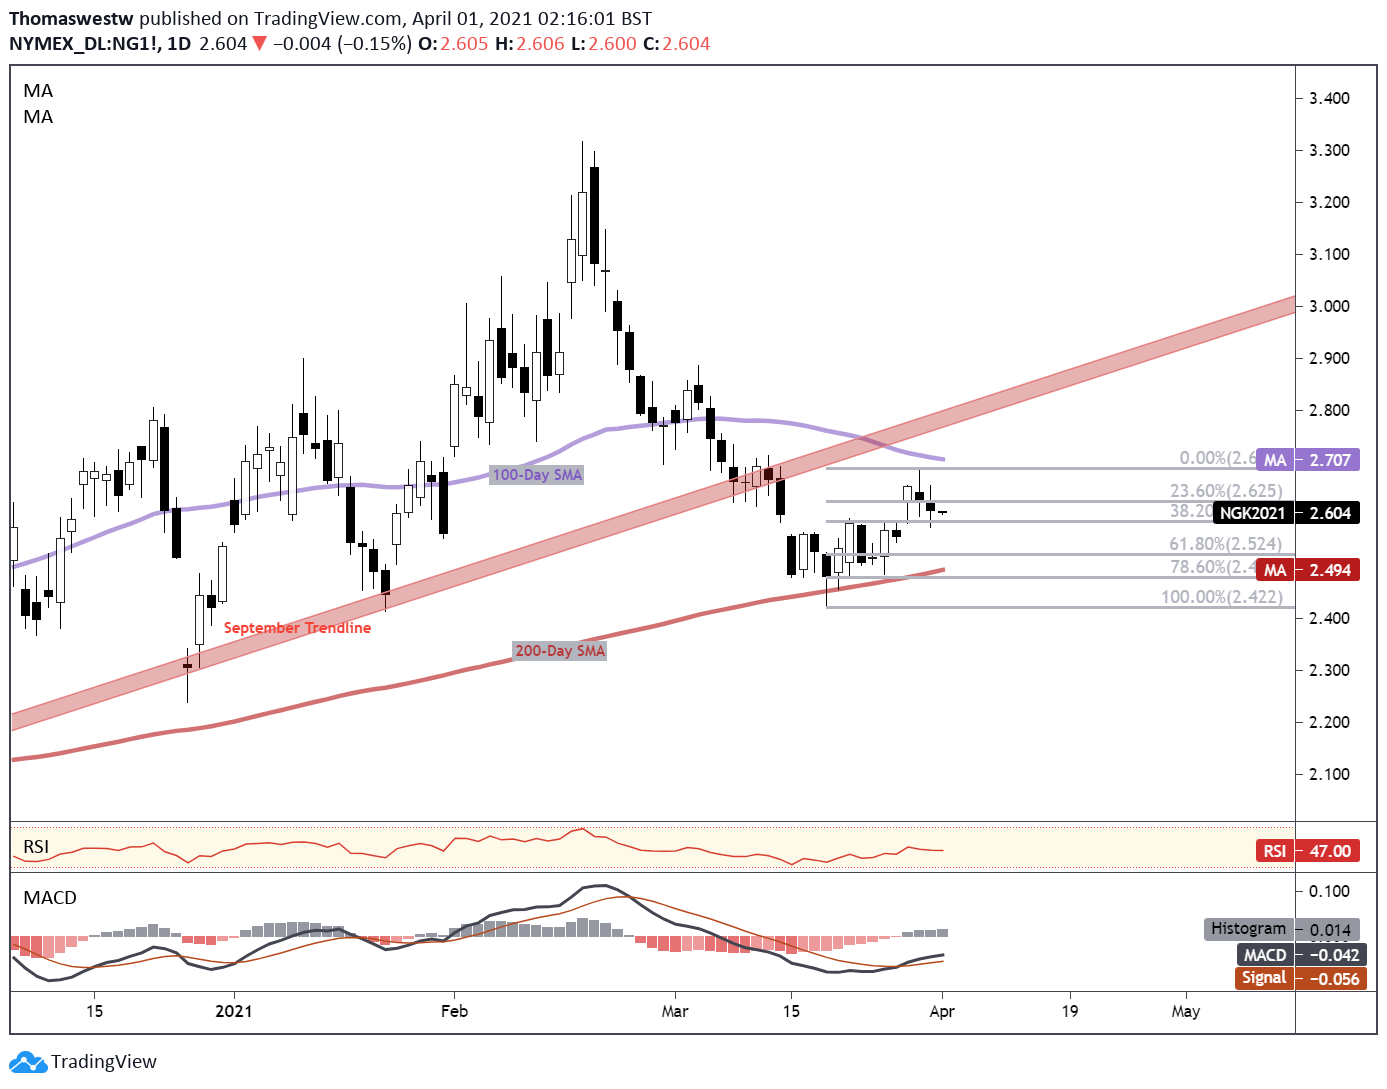
Chart created with TradingView
Natural Gas TRADING RESOURCES
— Written by Thomas Westwater, Analyst for DailyFX.com
To contact Thomas, use the comments section below or @FxWestwateron Twitter
Be the first to comment