

Scott Olson/Getty Images News
Introduction
Chicago-based CME Group (NASDAQ:CME) has become a holding of my dividend growth portfolio this year. It’s a stock I’m very passionate about because the company has a very interesting business model based on providing the world’s most traded futures and because the company is doing a tremendous job turning growth into high shareholder value. I’m currently down 7% as I averaged down this year. On the one hand, that’s not perfect. On the other hand, I’m glad I can continue to average down as the valuation has become even more attractive. Hence, in this article, I will reiterate my call to buy CME dividends and break down the company’s 2Q22 earnings release, which proves why I’m so eager about making CME a bigger holding in my portfolio.
So, without further ado, let’s look at the details.
What Makes CME Special
One of the things that attracted me to CME is the fact that the money generates way more cash than it needs, yet it’s not a slow-growing stock. That’s far from common among dividend stocks.
Stocks with yields above 3% more often than not tend to come from slow-growing businesses. The same goes for almost all companies that distribute almost all of their free cash flow to investors.
Since 2010, CME has returned 13.6% per year, which is more than decent and higher than the S&P 500 benchmark. The standard deviation during this period was 21%, which is obviously higher than a basket of 500 stocks, but still very reasonable for a financial company that sold off 30% from its all-time high during this period (in 2011).
Portfolio Visualizer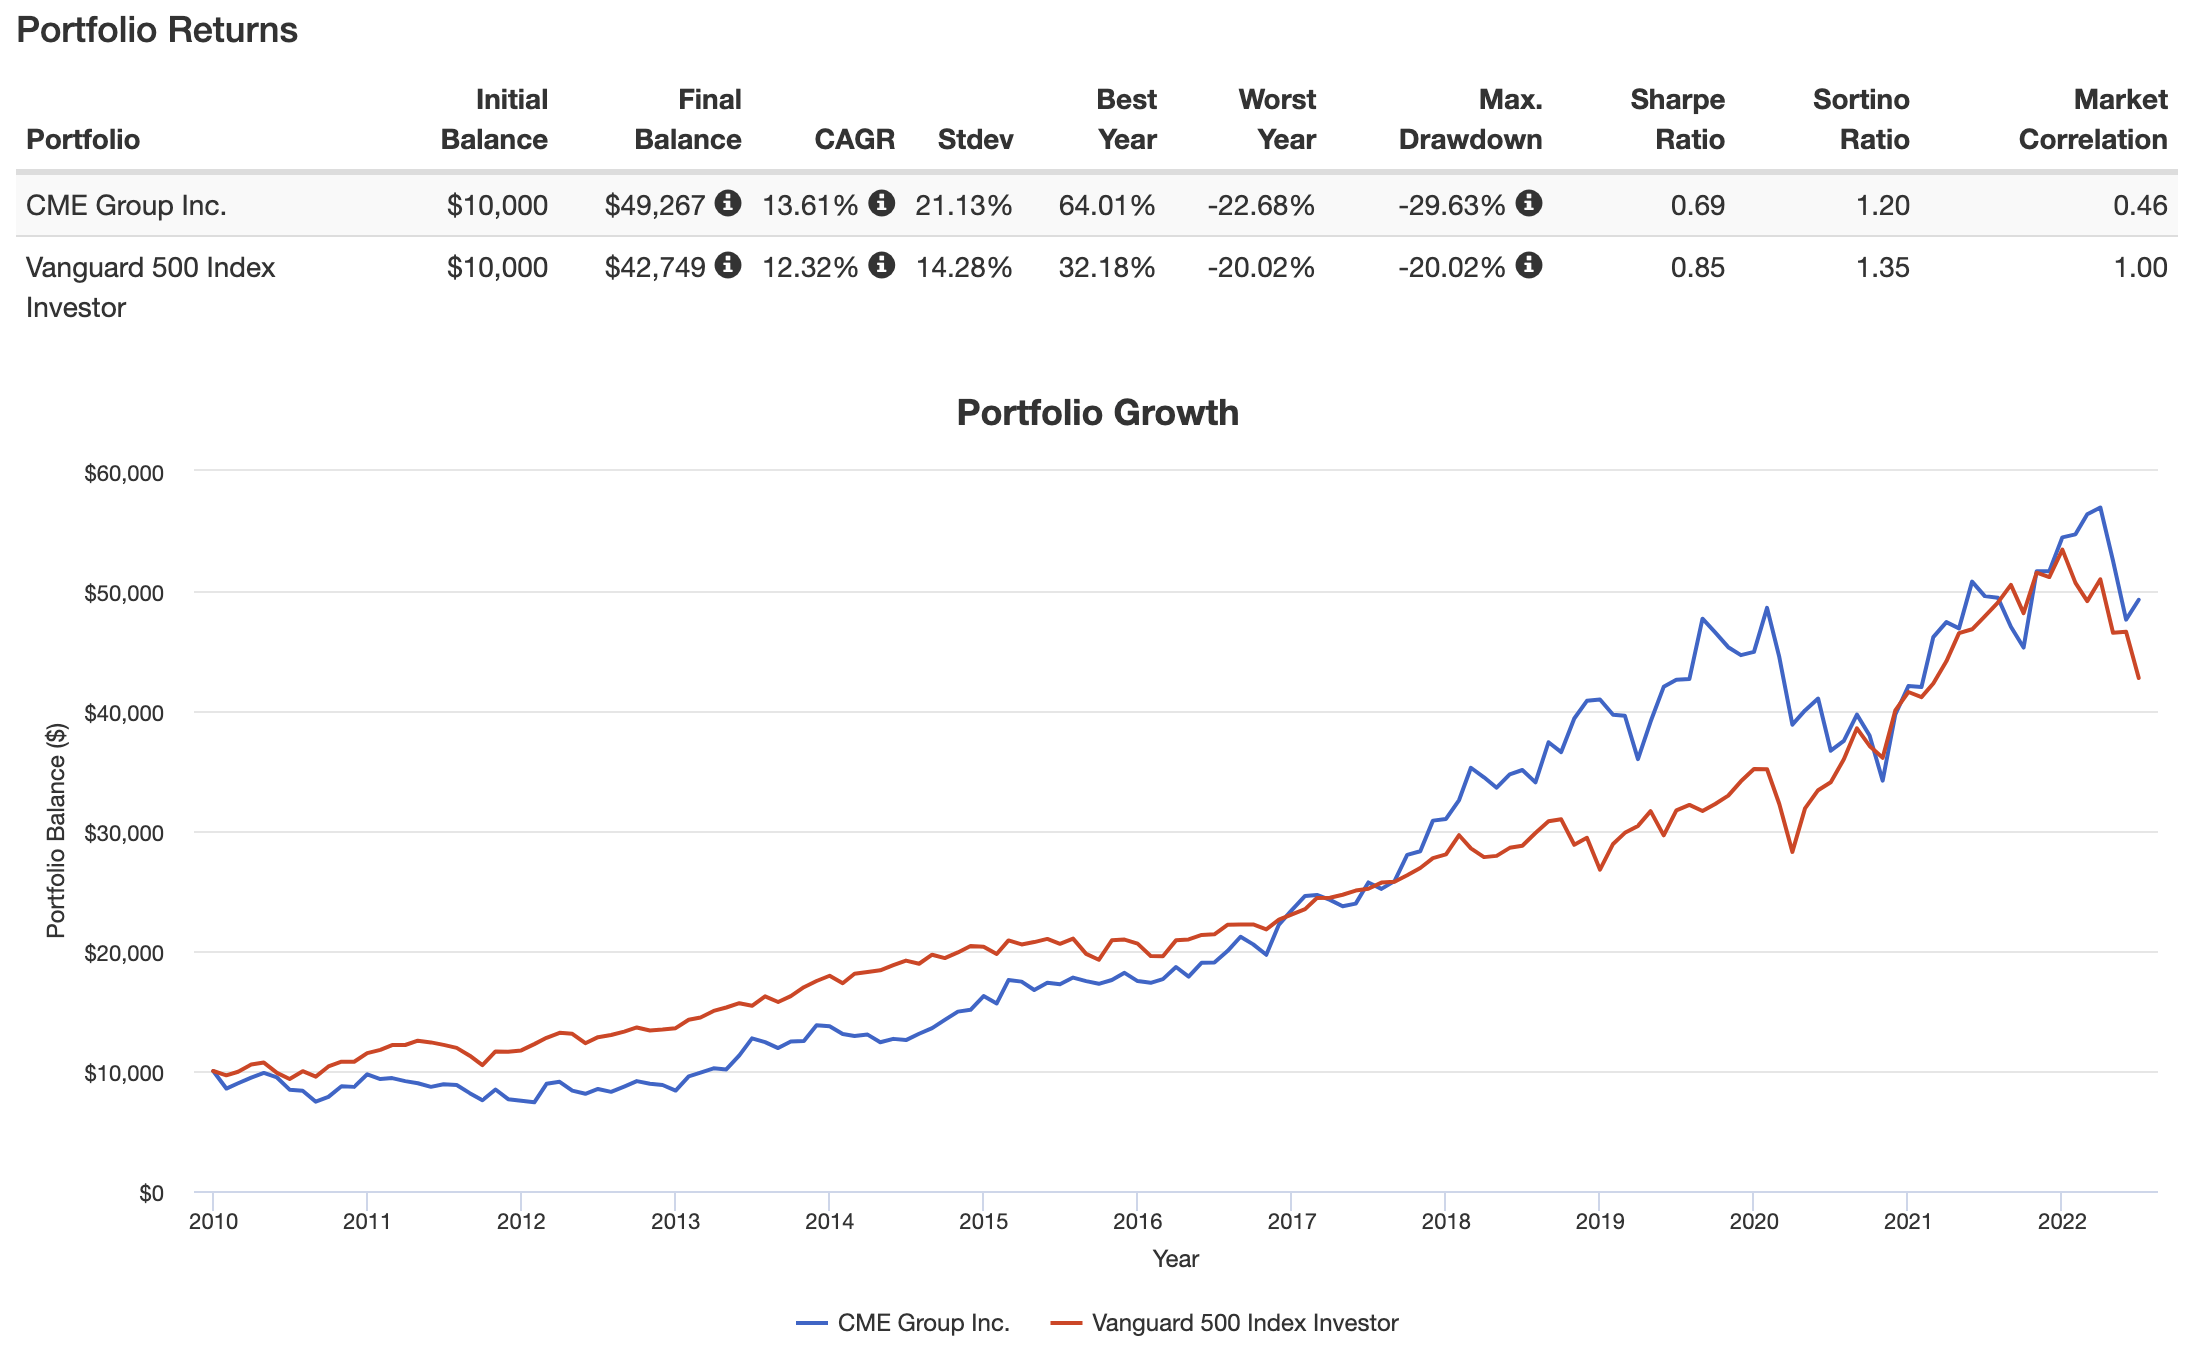
What’s interesting with regard to the Seeking Alpha dividend scorecard for this stock is that it shows a very mixed picture.
Dividend safety is as good as it gets. Dividend consistency looks good. Yet, dividend growth is a C+ and the yield is a mere D+.
Seeking Alpha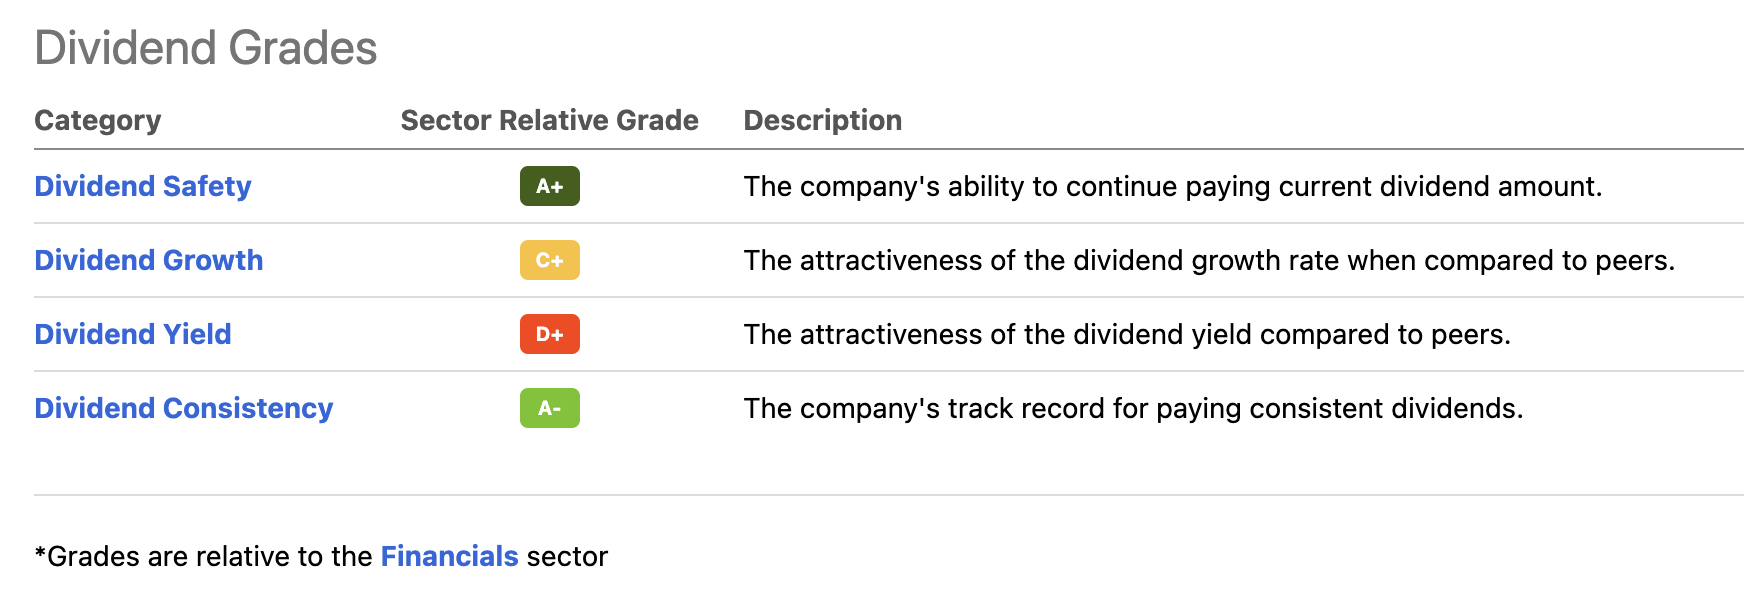
Bear in mind that these grades are based on financial numbers, not someone’s opinion. Moreover, these grades are relative to the financials sector.
In the case of CME, the dividend is $1.00 per quarter. That’s $4.00 per year per share. It translates to a yield of currently 2.0%. It’s higher than the S&P 500, but it’s tough to compare this to a sector that includes a lot of money center banks and regional banks with much higher yields. The Financials ETF (XLF) currently has a 2.0% yield as well.
What matters here is that the CME Group distributes way more money than (currently) a dollar per share per quarter.
In the past, the company has distributed pretty much all of its free cash flow via dividends. Last year, free cash flow was $2.3 billion. Total dividend payments were $2.2 billion. That’s 3.1% of the company’s current $70 billion market cap.
TIKR.com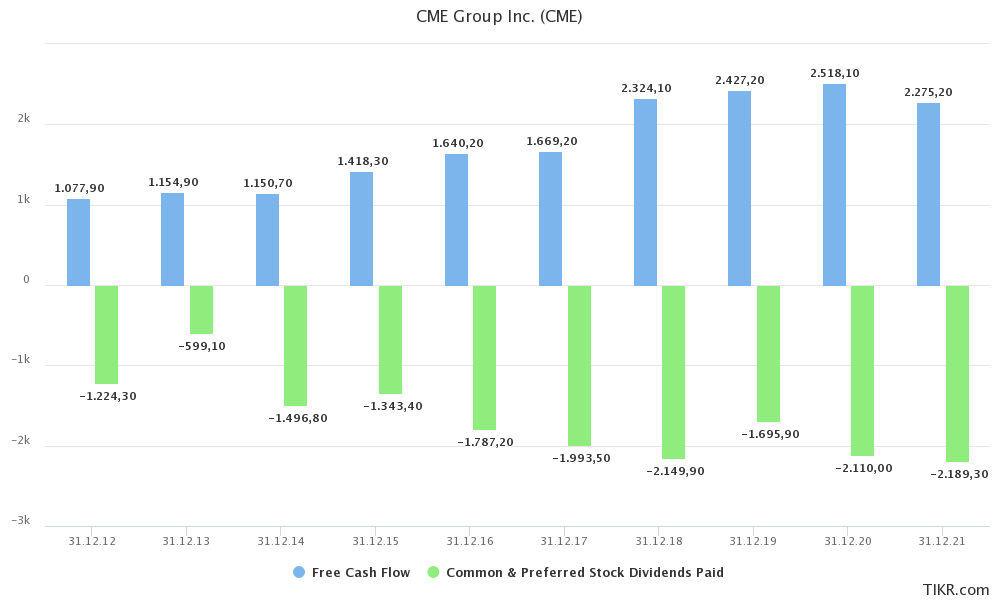
These special dividends are announced and distributed in December of each year.
What this means is that the focus shifts from dividend per share growth to free cash flow growth if we assume that the company will continue its very shareholder-friendly dividend policy.
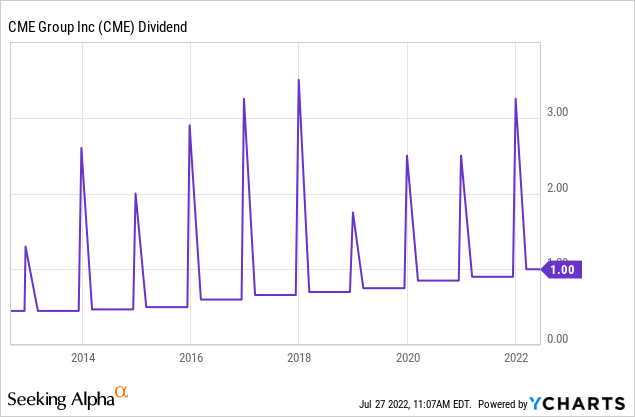
If we ignore the company’s wild spikes caused by the special dividend, we’re dealing with a 10.1% average annual dividend growth over the past 10 years. That’s a more than decent number given its current yield of 2.0%. Then again, please bear in mind that this is the growth rate of the regular quarterly dividend.
The most recent hike was announced on February 3, when management rewarded its owners with an 11.1% hike.
With that said, the only reason why I haven’t discussed the company’s business model in detail is that I’m going to combine that with the just-released earnings.
A Cash-Flow Friendly And “Anti-Cyclical” Business Model
Located in Chicago, the Chicago Mercantile Exchange Group is the world’s largest provider of futures and the largest financial derivatives exchange, in general.
The company generates half of its revenues in equity and interest rate futures and options with the other half divided over forex derivatives, agriculture products like wheat, corn, and soybean futures, as well as WTI crude oil, which is part of energy products, metals like gold, copper, and silver, and market data.
CME Group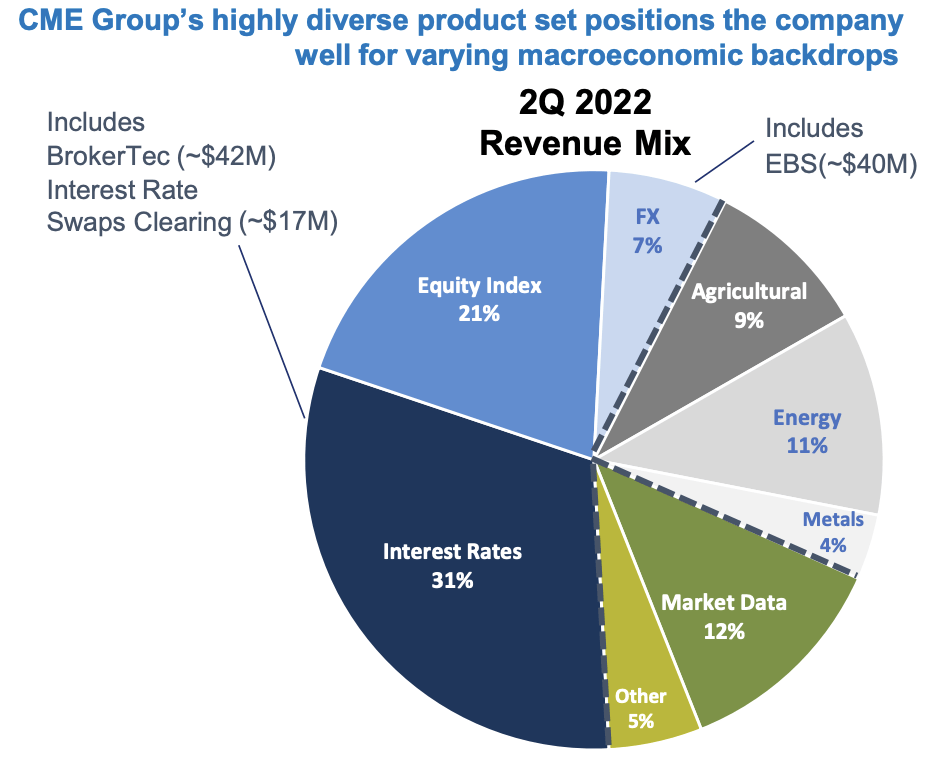
Being a heavyweight in futures and options means that stock market sell-offs are bittersweet. On the one hand, CME almost always sells off along with the market. On the other hand, whenever volatility increases, CME makes more money.
For example, over the past 10 years, there was one year where revenues were down. In 2021, revenues were down as it was impossible to beat the volatile year of 2020. In 2020, the company did $4.9 billion in revenues and more than $2.5 billion in free cash flow. Yes, its stock price sold off, but financials were more than fine.
TIKR.com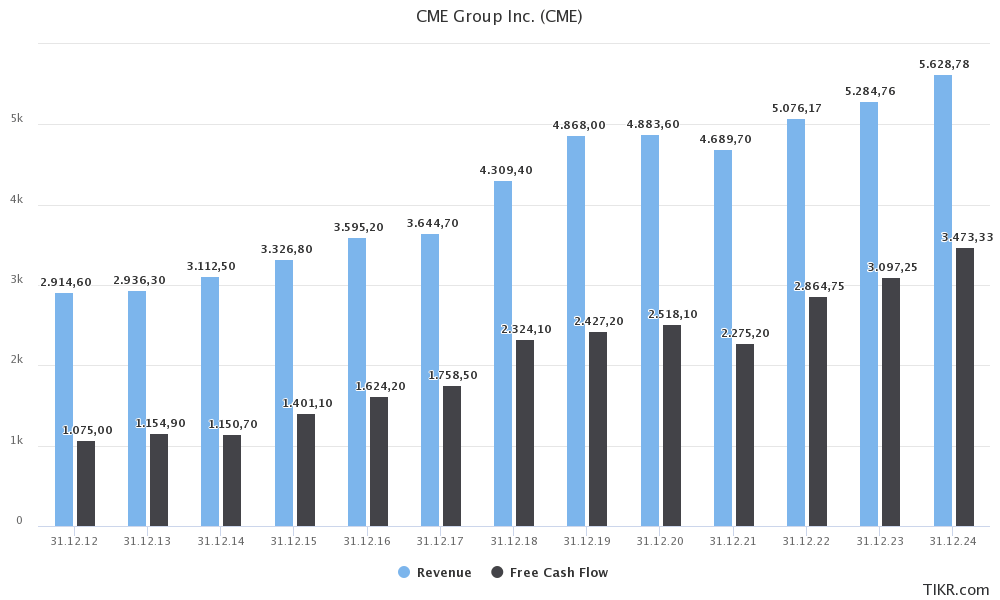
Hence, I’m not worried about bear markets. The biggest risk is a prolonged recession or a depression that causes market participants to reduce overall trading activities.
For now, the company remains in a fantastic position to generate shareholder value. For example, this year, free cash flow is expected to be $2.9 billion. That’s 4.1% of the current market cap, which could mean that total dividends this year are likely to be in the high 3% range.
Moreover, and to get back to the first point I made in this article, CME is a high-yield stock, yet its growth rates aren’t half bad.
Revenue growth has consistently been in the mid-single-digit range. The same goes for EBITDA. Net income growth was higher as net income margins rose from the mid-30% range in 2013 and prior to currently more than 55%.
Seeking Alpha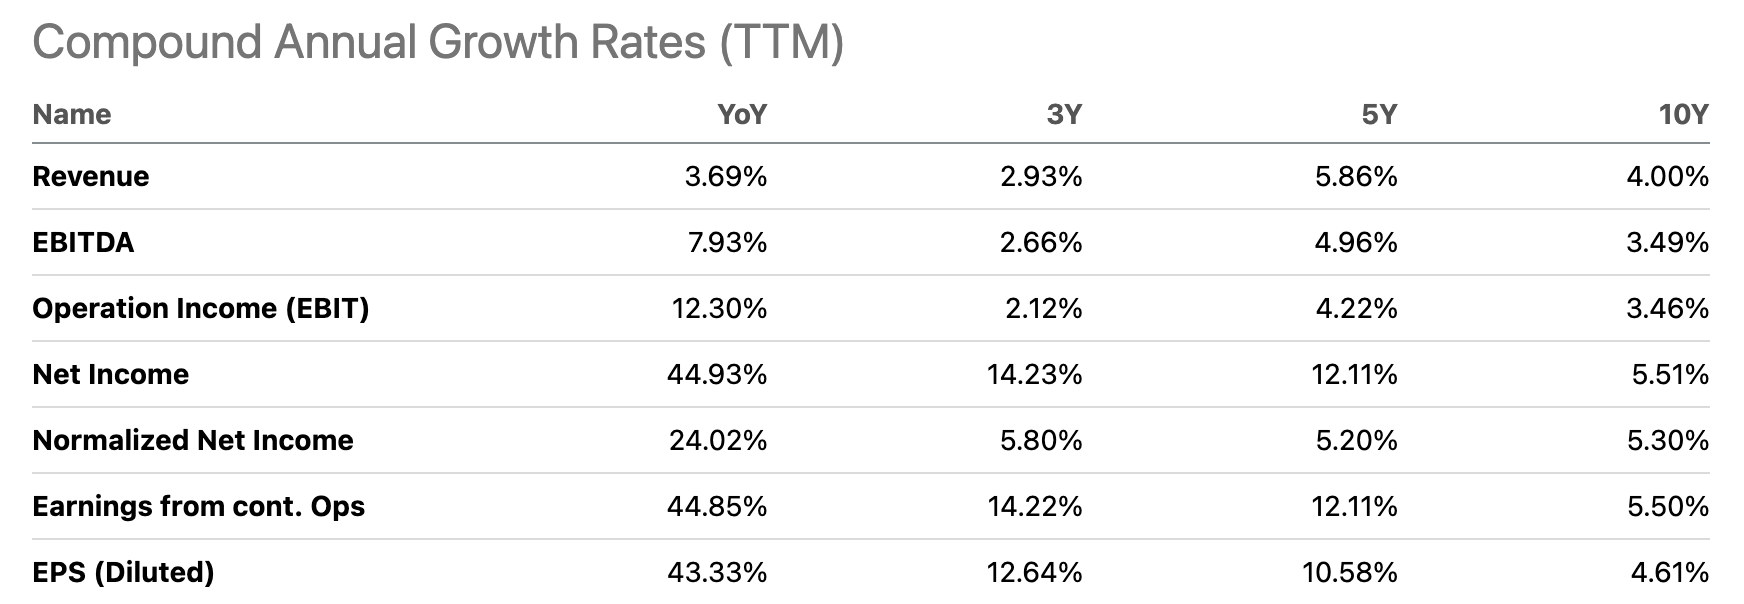
That said, the just-released earnings were good. The company did $1.2 billion in revenue, up 1.7% on a year-on-year basis. While it is $50 million lower than expected, the company beat adjusted EPS by $0.04 as it came in at $1.97, which is up 20% compared to 2Q21.
Average daily volume (“ADV”) rose by 25% to 23.1 million contracts. This is the highest ever 2Q ADV with every month in the quarter representing all-time volume records for that respective month.
While agriculture, energy, and metals have calmed down a bit, the company experienced massive tailwinds from equity volume and hedging needs for interest rates. Also, currency volatility helped FX ADV to make another attempt to 1 million.
CME Group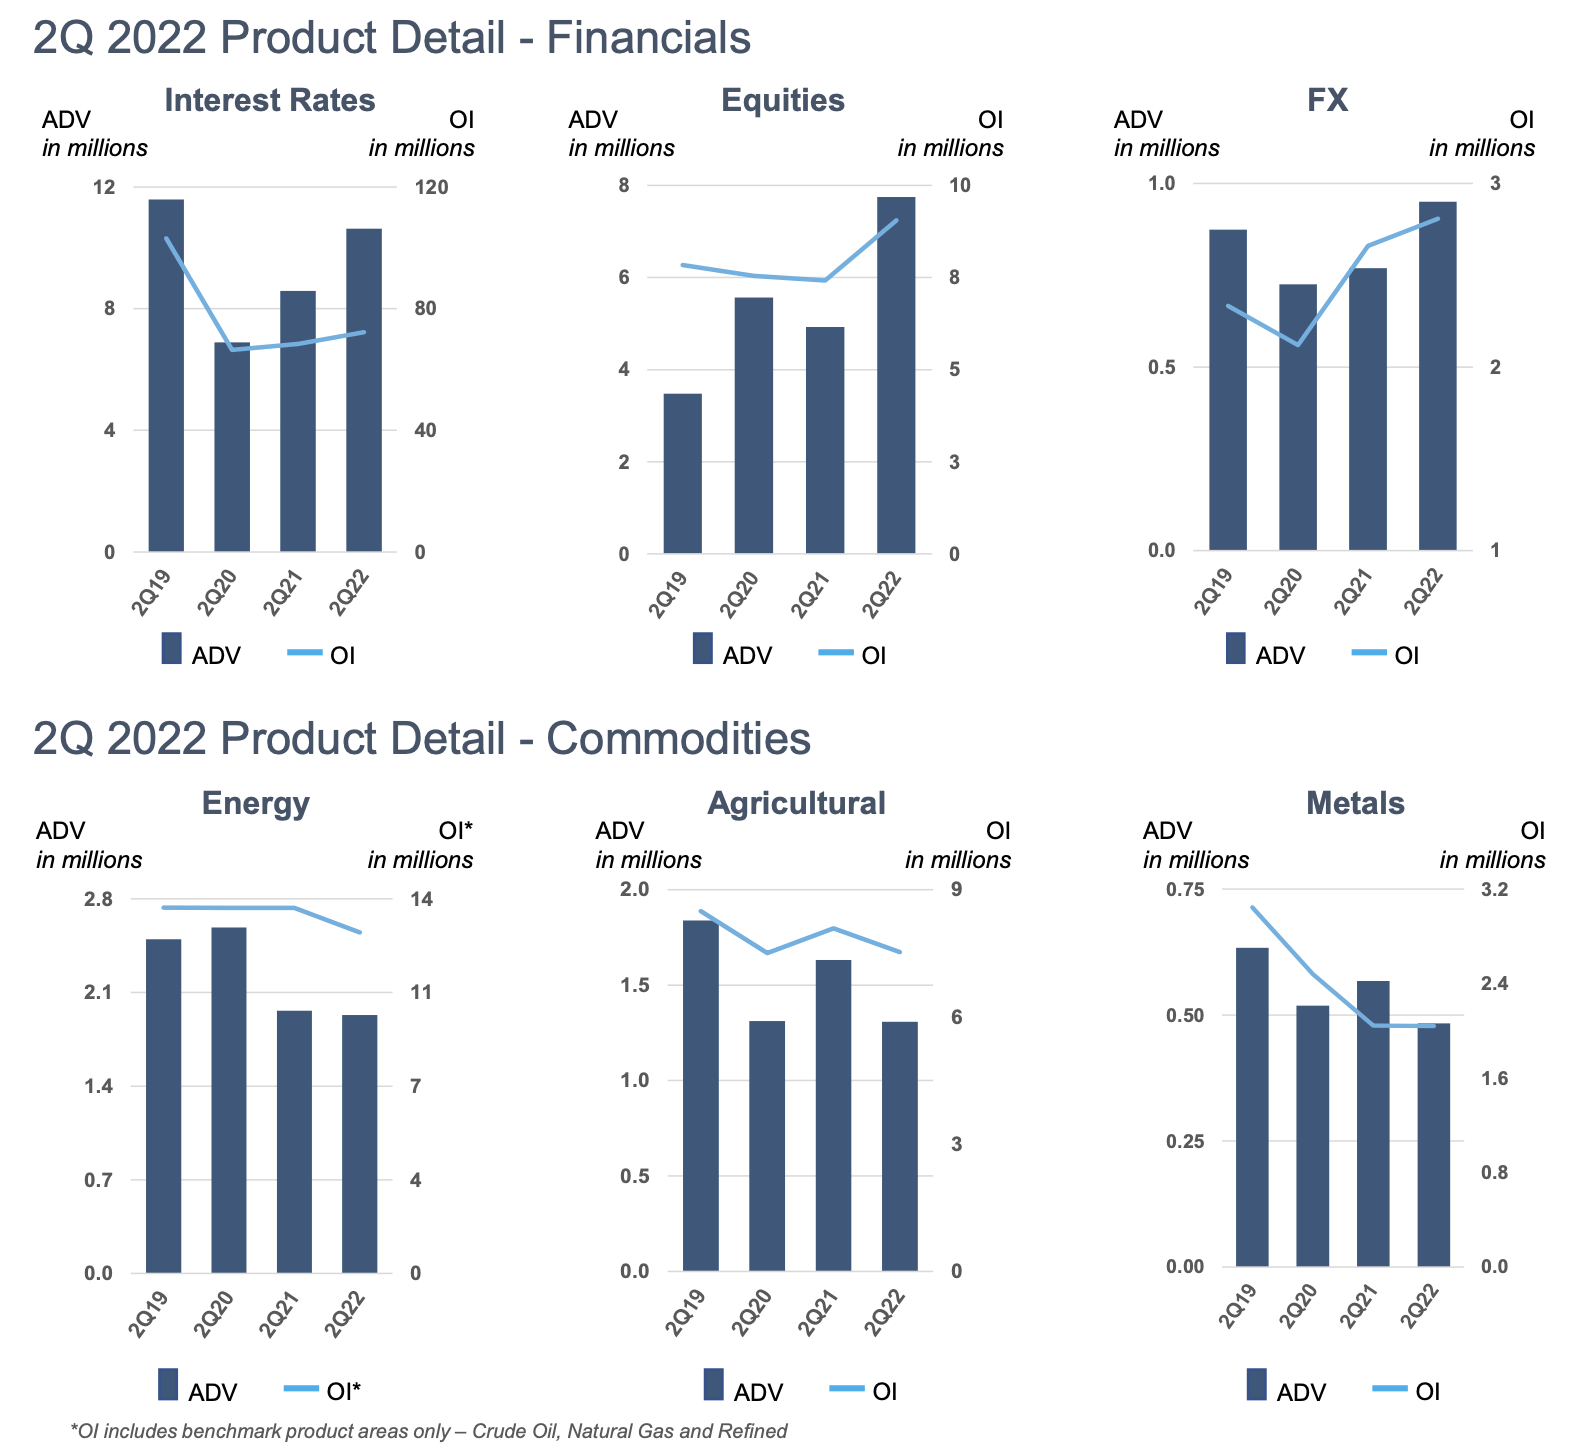
In its rates segment, the company saw huge growth in SOFR futures and options.
SOFR is replacing LIBOR rates. SOFR stands for Secured Overnight Financing Rate. According to JPMorgan:
SOFR is a broad measure of the cost of borrowing cash overnight collateralized by Treasury securities in the overnight Treasury repurchase agreement market.
SOFR is a great example of why CME is so relevant – besides the fact that it owns almost all key futures in commodities, equities, and rates.
Due to an increased SOFR adoption, open interest is now close to 15 million contracts with monthly ADV at 2.5 million.
CME Group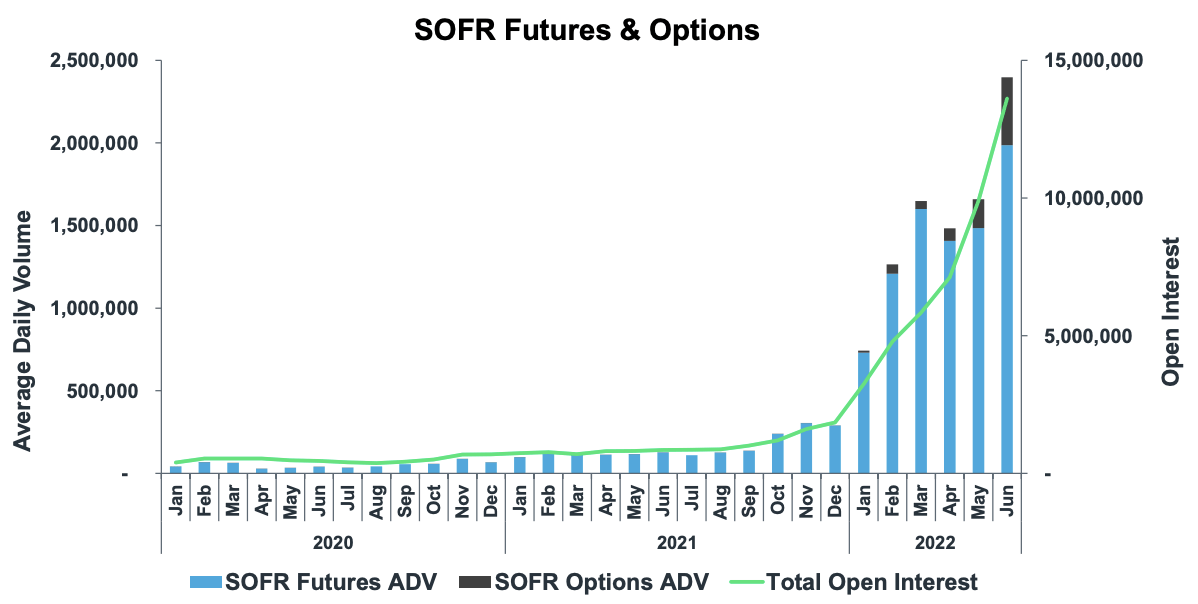
The company will also launch new carbon emission offset contracts, which lets CME benefit from high ESG-related product demand. In 2Q, the company also launched a Canadian wheat contract to diversify its agriculture portfolio with new high-volume opportunities.
So, what about the valuation?
Valuation
CME lost some ground after earnings, dropping more than 3%. I believe this is due to the expectations that volatility will fade. The stock market is rising again, volatility is coming down, and investors are in a good place again.
However, this often occurs after times of high volatility. I’m not worried about this. If anything, it’s a good spot to add exposure as the company’s too cheap.
StockCharts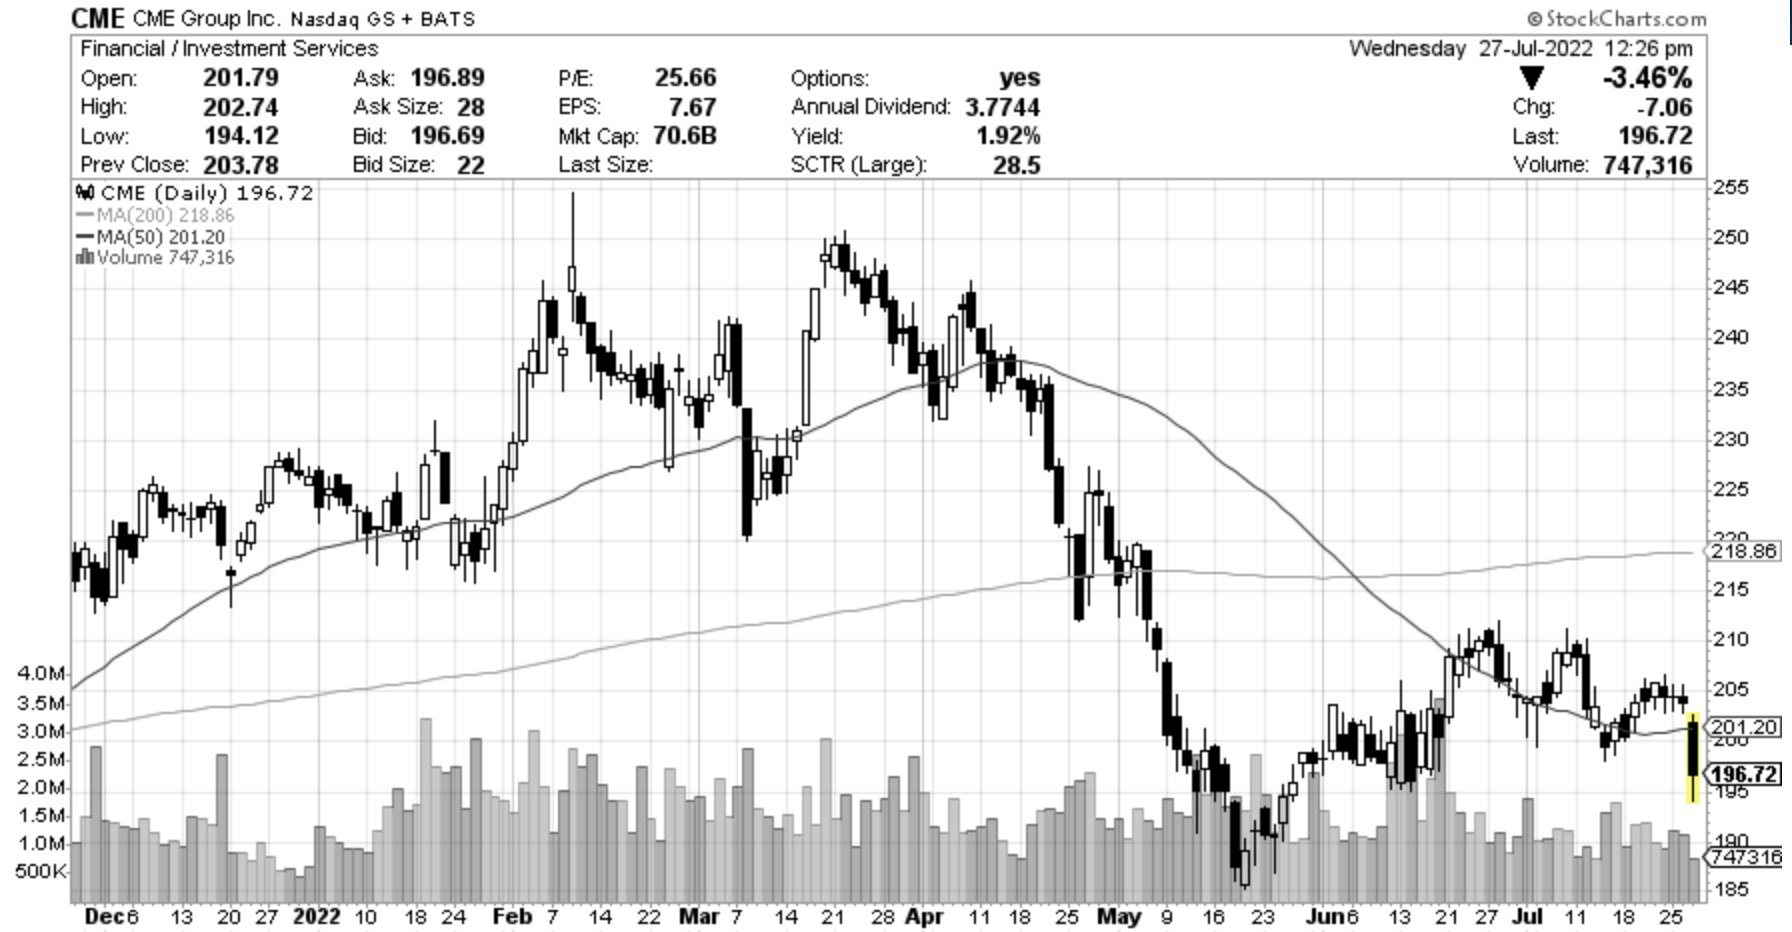
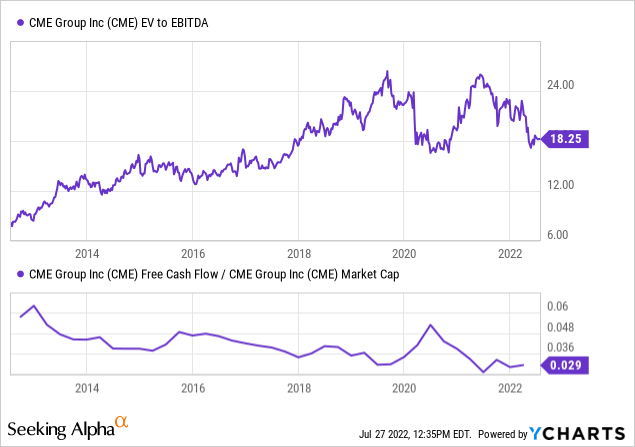
Using the company’s $70 billion market cap and $240 million in 2023 expected net debt (just 0.06x EBITDA) gives CME an enterprise value of $70.2 billion. That’s 19.1x 2023 expected EBITDA of $3.67 billion.
This valuation is close to the lows of the 4-year average. That’s the period when CME started to significantly improve its margins. Moreover, the implied free cash flow yield of 4% is close to the higher bound of the past 4 years, which means investors are not overpaying for free cash flow. That’s key in dividend (growth) investing.
Takeaway
I’ve 2022 stock market weakness to add new companies to my portfolio. One of these companies is CME. This company has a fantastic business model, which allows investors to benefit from long-term growth and high quarterly (and special) dividends.
The owner of the world’s most important agriculture, equity, fixed income, metals, energy, and forex futures and options is having one of its best years ever. Just-released 2Q22 earnings showed sky-high volumes in fixed income (also thanks to SOFR) and equity futures where CME owns the famous E-mini futures.
CME has an implied free cash flow yield of more than 4% thanks to high volatility and a valuation that has become very attractive thanks to this year’s market sell-off.
I will continue to add to my position as there are not a lot of stocks that offer a high yield, decent long-term growth, a healthy balance sheet, and the chance to outperform the market on a long-term basis.
So, long story short, we’re dealing with a stock that offers opportunities for income-seeking investors and dividend-growth-oriented investors like myself.
(Dis)agree? Let me know in the comments!
Be the first to comment