

LumerB
This article was published on Dividend Kings on Tuesday, December 27th.
——————————————————————————–
Dividend growth blue-chips are the best-performing asset in history, delivering 7X more inflation-adjusted wealth over the last 50 years than non-dividend stocks.
Legacy Research
But there is a famous saying on Wall Street that Howard Marks likes to remind us of.
A six foot man can drown in a river that’s just three feet deep…on average.” – Howard Marks
It’s not enough to buy and hold dividend blue-chips and hope things work out well.
JPMorgan Asset Management 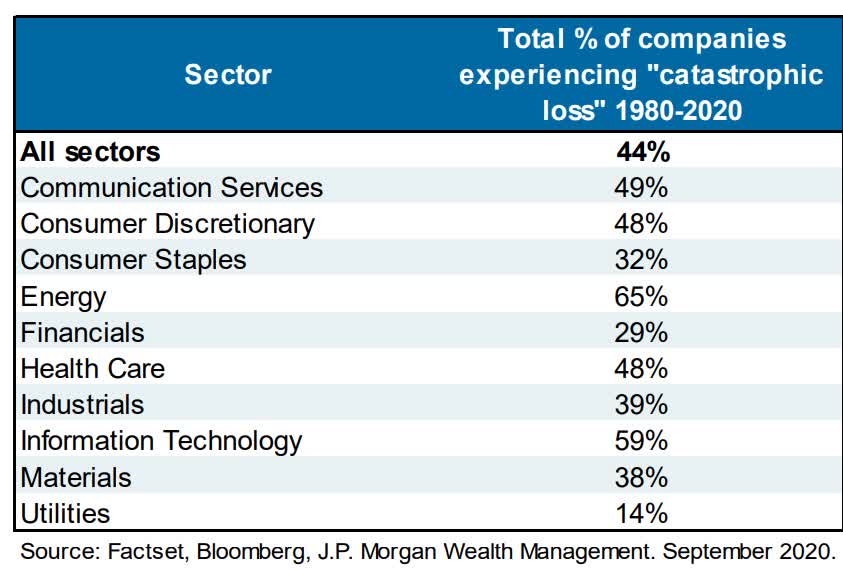
44% of all US stocks don’t just fail; they fail “catastrophically,” meaning they fall 70+% and never recover.
Even the venerable dividend aristocrats have, among their former ranks, catastrophic failures such as General Electric (GE). Heck, Winn-Dixie and Kmart are former aristocrats that went bankrupt. Kmart is perhaps the only dividend aristocrat to go bust twice, including after being bought by Sears, who filed for Ch 11 later.
Our favorite holding period is forever. We are just the opposite of those who hurry to sell and book profits when companies perform well but who tenaciously hang on to businesses that disappoint. Peter Lynch aptly likens such behavior to cutting the flowers and watering the weeds.” – Warren Buffett
Warren Buffett’s favorite holding period might be forever, but that doesn’t make him a “buy and hold forever” investor. Rather, he’s a “buy and hold forever…or until the thesis breaks” style of investor.
Cisco (NASDAQ:CSCO) and Intel (NASDAQ:INTC) are two legendary tech utilities offering attractive yields and have been two of the best-performing stocks in history.
However, one of them is firing on all cylinders, and the other is one I’d personally avoid right now.
Let me show you why Cisco is a high-yield tech utility conservative long-term income investors can trust and why Intel’s 5.6% yield isn’t as attractive as it appears.
Why I Would Avoid Intel Right Now
YieldChart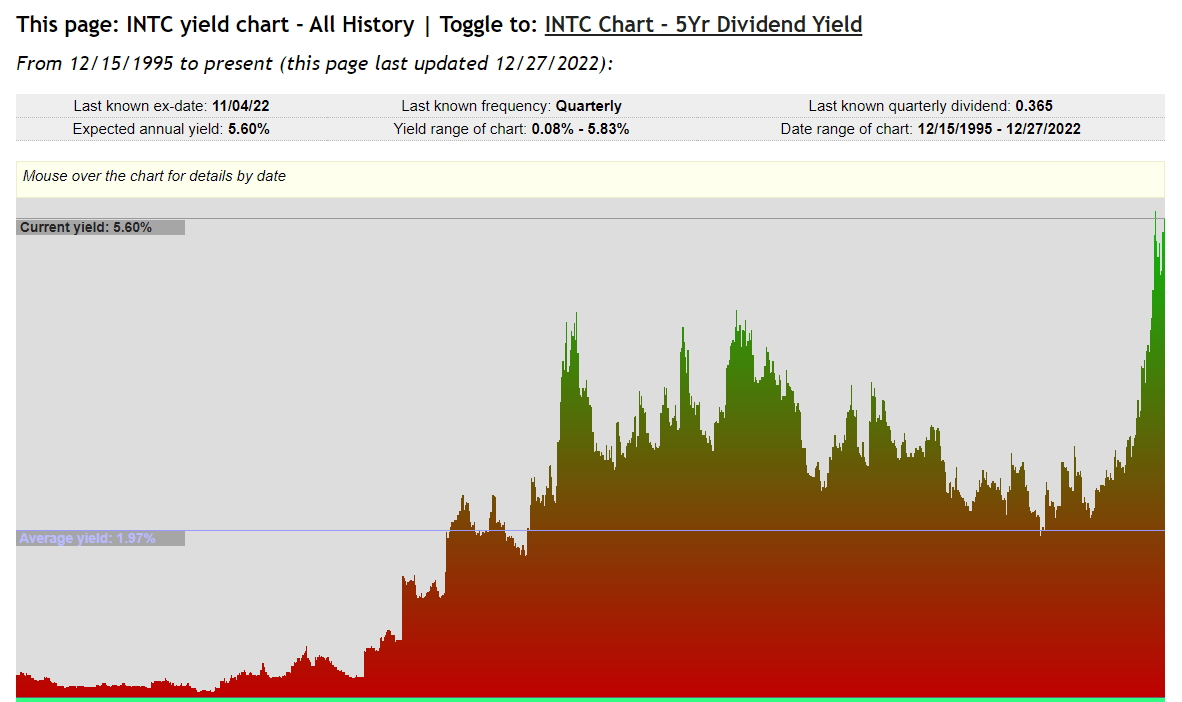
Intel is trading at the highest yield in its history. If the investment thesis were intact, it would literally be the best time in history for income investors to buy it.
However, successful long-term income investing isn’t just about high yield, but SAFE and GROWING high-yield.
Intel’s dividend track record is a very solid one. It’s been growing its dividend for seven consecutive years and hasn’t cut the payout for 23 consecutive years, ever since it began paying a dividend.
Am I warning income investors away from Intel because the dividend is unsafe? Not really.
Intel’s dividend costs $6 billion per year. Does its free cash flow cover that? Not even close.
FactSet Research Terminal 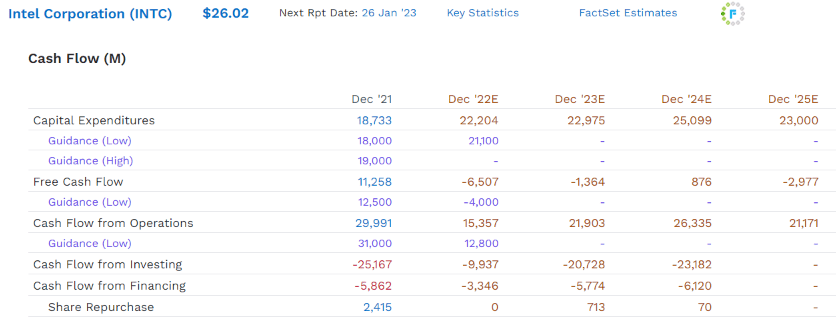
Is Intel a speculative dividend stock because its free cash flow isn’t expected to cover its dividend through at least 2025? I wouldn’t go that far since the reason for that is a CAPEX super-cycle that is a natural part of the semiconductor industry.
There is a reason why credit rating agencies consider 50% FCF payout ratios safe for this industry, slightly below the 60% guideline for most other industries.
Intel is expected to spend $93.3 billion on new chip plans called Fabs through 2025. New fabs can cost $10 to $15 billion each, and that’s why the safety of Intel’s dividend comes down to its balance sheet.
- Intel’s dividend is expected to be frozen in 2023
- and then increase by 1 penny per year in 2024 (less than 1%)
- and possibly remain frozen in 2025
Intel Credit Ratings
| Rating Agency | Credit Rating | 30-Year Default/Bankruptcy Risk | Chance of Losing 100% Of Your Investment 1 In |
| S&P | A+ Negative Outlook | 0.6% | 166.7 |
| Fitch | A+ Negative Outlook | 0.6% | 166.7 |
| Moody’s | A1 (A+ Equivalent) Negative Outlook | 0.6% | 166.7 |
| Consensus | A+ Negative Outlook | 0.60% | 166.7 |
(Sources: S&P, Fitch, Moody’s)
All three major rating agencies have Intel rated as A+ negative outlook, meaning a 33% chance it gets downgraded to A or possibly even A- within two years. But an A-rating is still a strong balance sheet, with plenty of borrowing power to support the 5.6% yielding dividend.
We expect operating results will remain weak over the next year or so and that its technology roadmap may come under pressure or delayed…Near-term negative macroeconomic trends are adding to already challenged business prospects. The negative outlook reflects our expectation for weaker operating performance than we forecast in fiscal 2022 and 2023 due to challenging macroeconomics and the company’s execution misstep with Sapphire Rapids.:” – S&P
Intel has long struggled with falling market share to Advanced Micro Devices (AMD), and its roadmap for chip design has seen numerous setbacks. Now we face a global recession in 2023 that’s expected to slow the chip industry’s and Intel’s growth more than most.
FAST Graphs, FactSet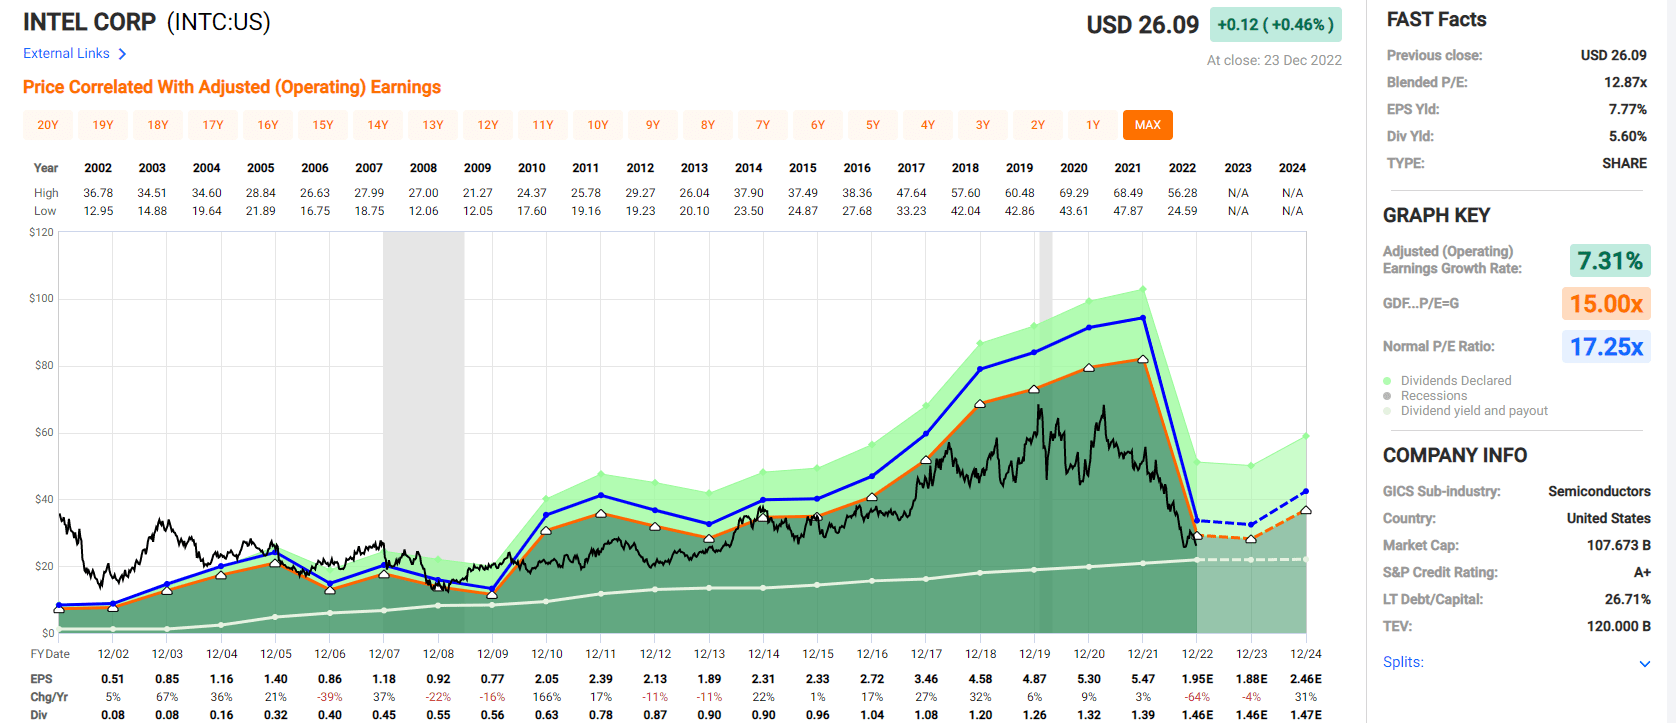
Intel’s missteps and much higher spending are expected to lower EPS by 66% between 2021 and 2023.
The good news is that it’s eventually expected to start growing again unless management keeps botching its chip design roadmap.
We lowered our moat rating for Intel to narrow from wide, as we are no longer certain that the firm can generate excess returns on capital over the next few years…
We believe Intel’s cost advantage has eroded, as it faced significant product delays associated with its various 10-nanometer process technologies. Intel’s x86 rival, AMD, and its foundry partner, Taiwan Semiconductor Manufacturing, or TSMC, have combined to leapfrog Intel in cutting-edge processors.” – Morningstar
Intel’s competitive advantage has been weakening for years as rivals like Taiwan Semi (TSM) outcompete it on R&D effectiveness.
YCharts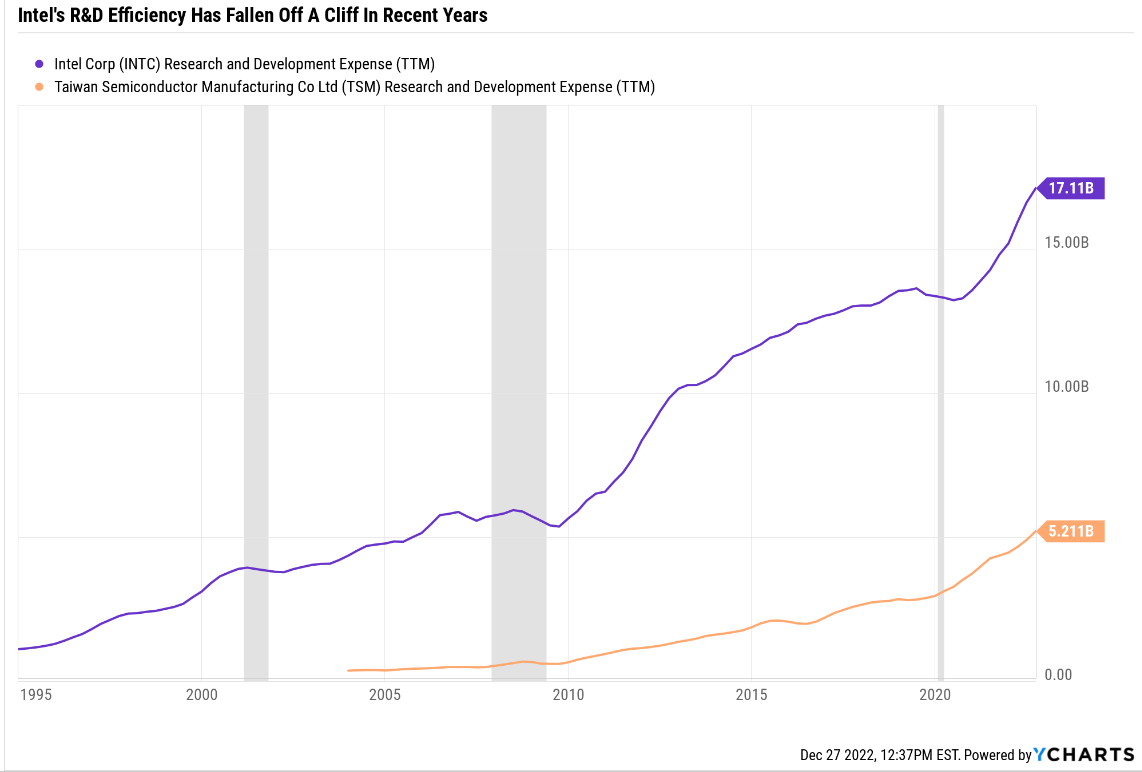
No one spends more on R&D than Intel. In fact, INTC outspends TSMC more than 3X each year in this area.
But while INTC struggles to even perfect its 7nm chips, TSM is just three years away from 2nm chips. In fact, TSM is investing $32 billion into a new fab that it believes will be ready by the end of 2026 to produce 1nm chips.
Now that’s not to say that Intel doesn’t think it can compete with TSMC. In fact, its updated roadmap claims it can beat TSCM to a 2nm chip, with commercial sales in late 2024.
The difference is that when TSMC says it will deliver revolutionary new chip technology, it delivers. Intel has built up an impressive track record of missing deadlines, and its earnings are suffering as a result.
How fast can Intel grow in the future? That’s very tough to say. The best available consensus forecast is currently -1.2% annually through 2024.
FAST Graphs, FactSet
What is Intel historically worth growing at -1.3%? About 11.3X earnings. In other words, it’s crashing stock price has not been a function of irrational market pessimism but collapsing fundamentals.
Might Intel theoretically one day prove a wonderful high-yield investment? Sure, if it can return to 8+% growth as it’s historically delivered for 20 years.
But as things stand now?
Consensus Long-Term Return Potential
| Investment Strategy | Yield | LT Consensus Growth | LT Consensus Total Return Potential | Long-Term Risk-Adjusted Expected Return |
| Intel (Bullish Case) | 5.6% | 8.0% | 13.6% | 9.5% |
| Vanguard Dividend Appreciation ETF | 1.9% | 10.2% | 12.1% | 8.5% |
| Nasdaq | 0.8% | 10.9% | 11.7% | 8.2% |
| Schwab US Dividend Equity ETF | 3.4% | 7.6% | 11.0% | 7.7% |
| Dividend Aristocrats | 1.9% | 8.5% | 10.4% | 7.3% |
| S&P 500 | 1.8% | 8.5% | 10.3% | 7.2% |
| 60/40 Retirement Portfolio | 2.1% | 5.1% | 7.2% | 5.0% |
| Intel (Current Consensus) | 5.6% | -1.2% | 4.4% | 3.1% |
(Source: DK Research Terminal, FactSet, Morningstar, YCharts)
The best current analyst estimates are that Intel offers bond-like future returns, as it spends a fortune on new fabs that thus far haven’t been able to keep up with its rivals.
The bullish case is solid 13% to 14% long-term returns. But unlike many high-yield blue-chips that offer 13% return potential (like MO), Intel doesn’t offer a strong valuation boost.
As we’ve just seen, Intel growing at these rates, is fairly valued and offers an 8% annual return potential for the next two years. It’s also significantly below that of Cisco, which, unlike Intel, has been firing on all cylinders for years.
Why Cisco Is A Dependable High-Yield Tech Utility
Tech utilities like Cisco offer generous, safe, and steadily growing income and solid returns.
Cisco Total Returns Since 2011 (When It Became A Dividend Stock)
Portfolio Visualizer Premium 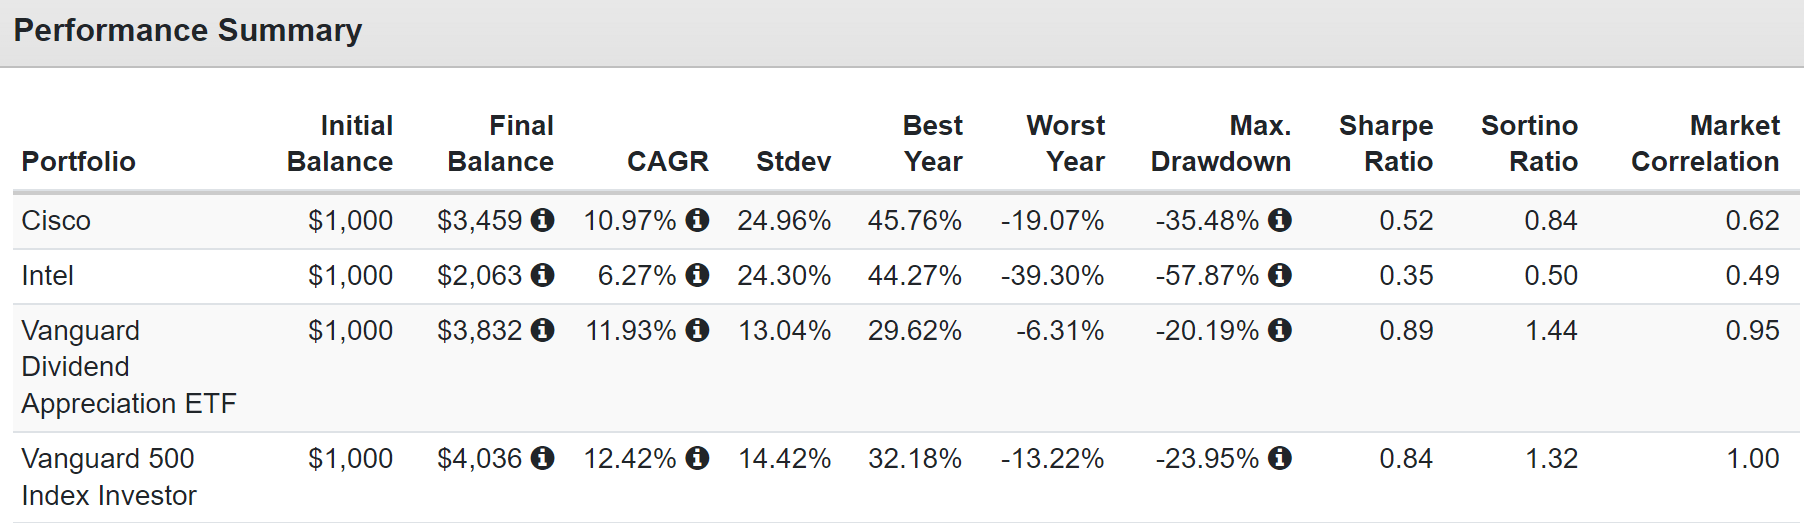
Cisco isn’t a stock you own to beat the S&P or growth stocks; that’s not its job.
Portfolio Visualizer Premium 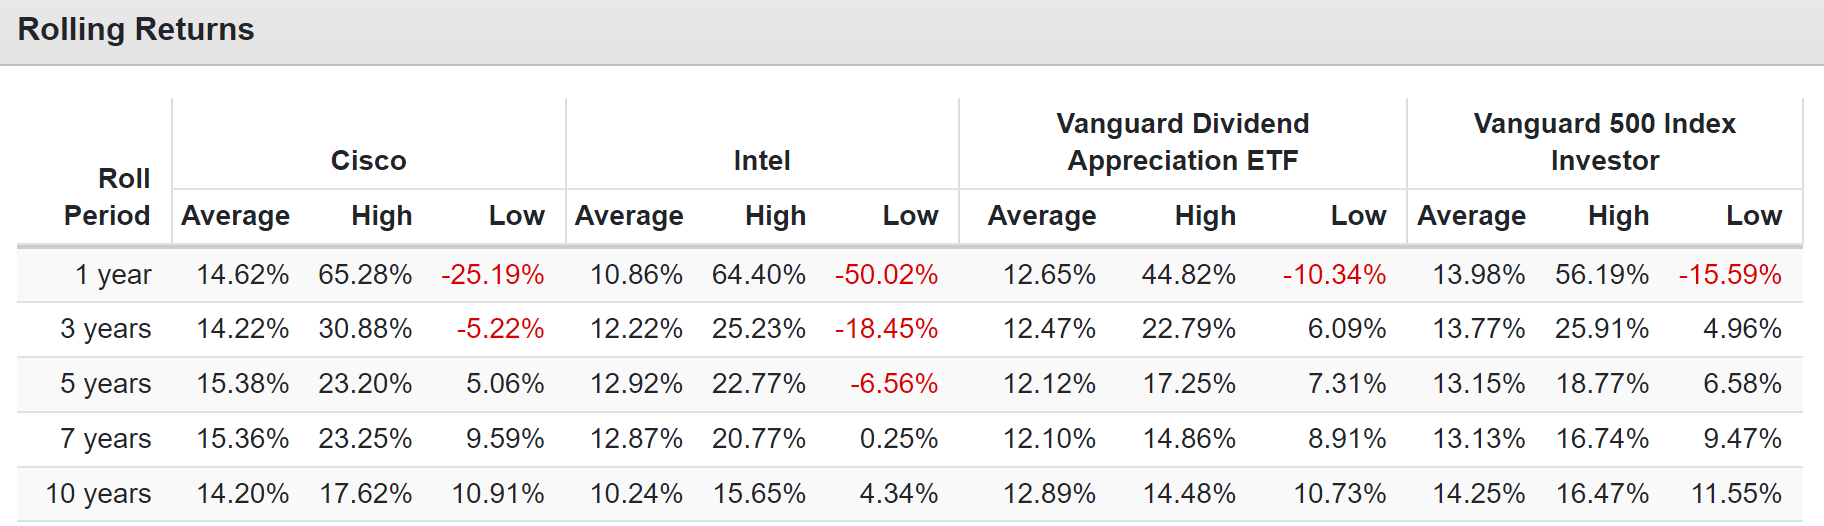
Cisco’s job is to generate market-like returns with far superior yields, and it’s done that job admirably for 11 years, even during one of the strongest bull markets in US history.
The key to Cisco’s success is its diversified “one-stop-shop” experience and growing recurring revenue stream.
We view Cisco Systems as the dominant force in enterprise networking and expect it to retain its strength in both legacy and future networks. Cisco holds leading market shares across switching, routing, and wireless access, with strong complementary positions in security and collaboration. We believe Cisco’s portfolio is positioned appropriately to benefit from trends toward hybrid work and cloud environments. It offers the most comprehensive suite of capabilities across converging networking and security markets, and we deem its intertwined products as sticky and worthy of a wide economic moat.” – Morningstar
Earnings presentation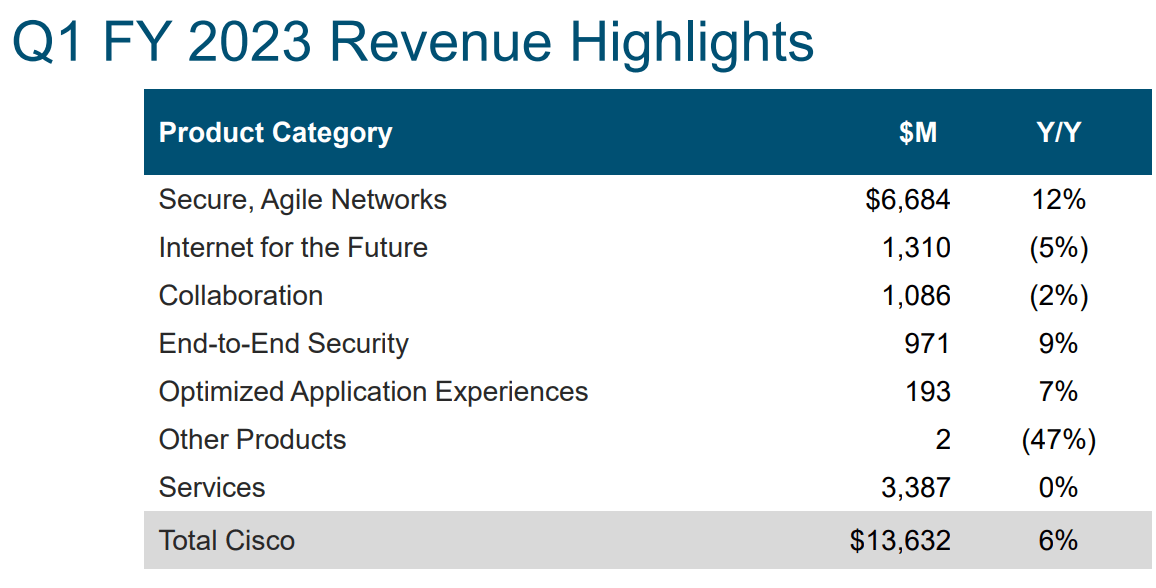
Not all of Cisco’s businesses can grow in all economic conditions; combined, they are still generating solid mid-single-digit growth.
YCharts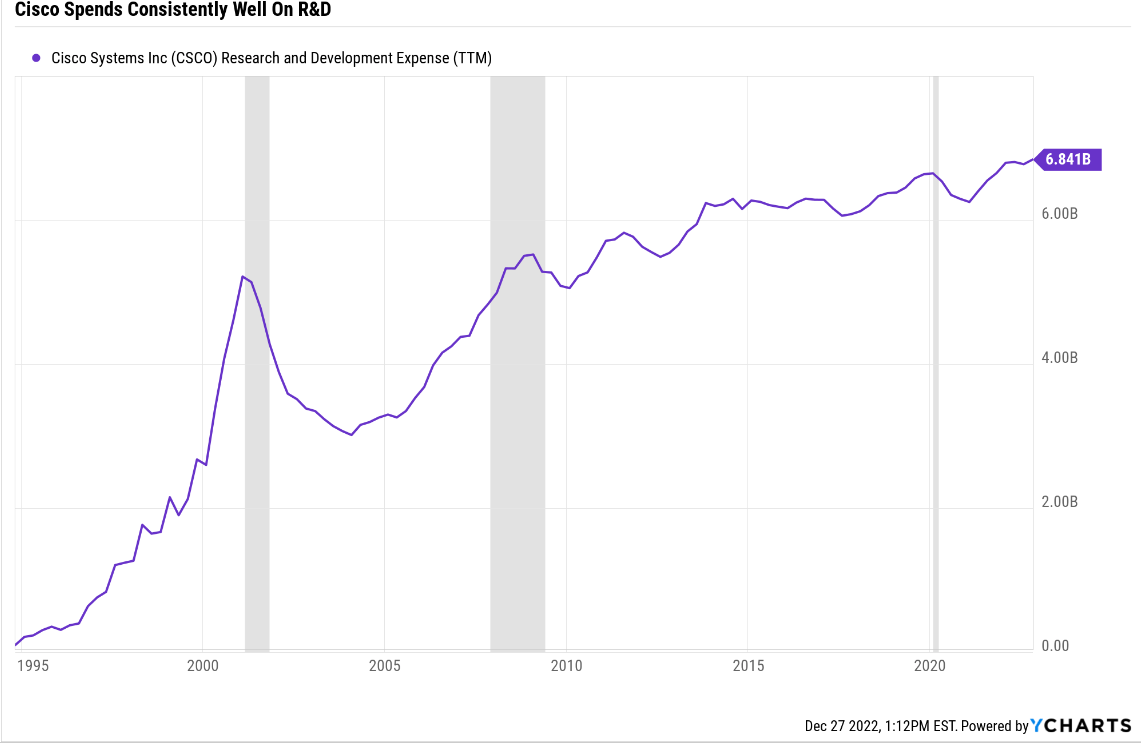
Cisco’s focus on its R&D budget is consistent, focusing on combining data analytics into its enterprise hardware solutions.
Earnings Presentation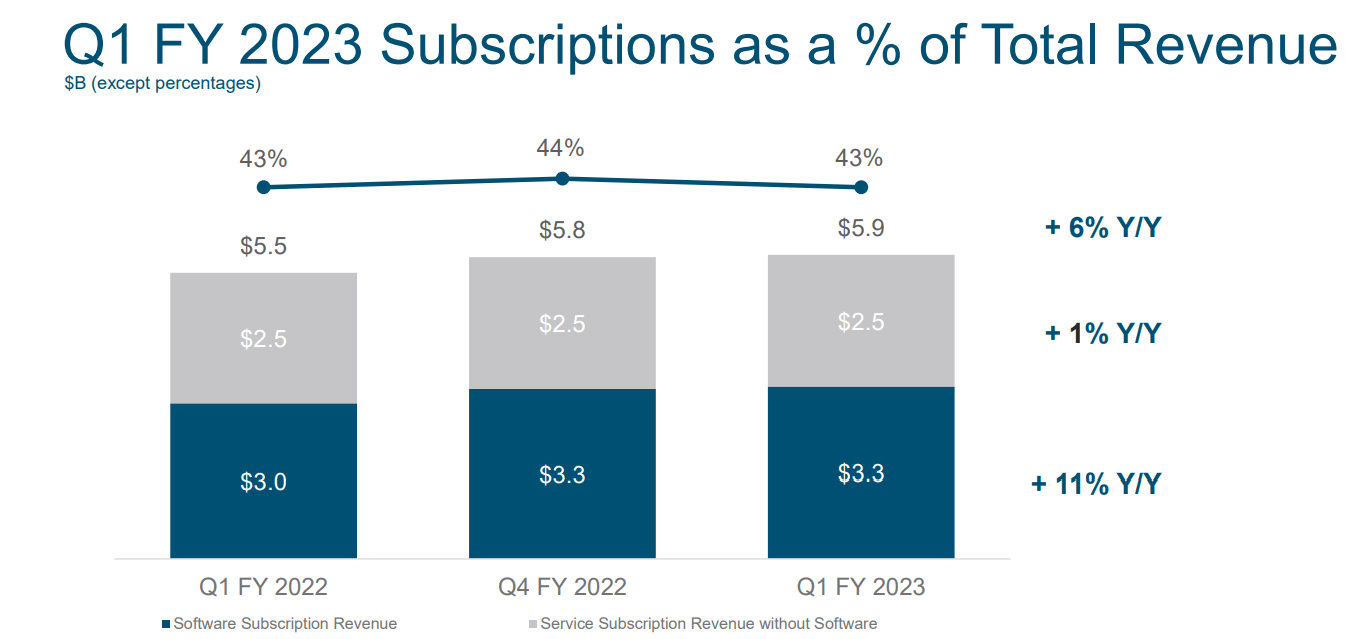
Cisco’s recurring software sales are still growing at 11%, and recurring subscription revenue now makes up 43% of total revenue.
Earnings Presentation
Including hardware subscriptions, subscription revenue is growing at 12%, twice the rate of the overall company. This means that more and more of Cisco’s sales are becoming subscription-based, and economic cyclicality is declining over time.
FactSet Research Terminal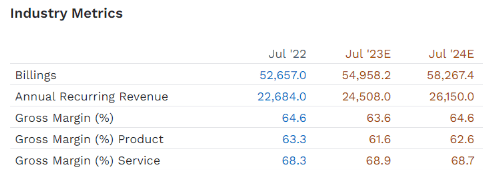
Cisco’s subscription sales are expected to grow at a 7.4% annual rate, even through the global economic slowdown. Its margins are expected to remain intact, despite plenty of competition from rivals like Arista Networks (ANET) or Palo Alto Networks (PANW), and Fortinet (FTNT).
So does that mean that Cisco will grow at double-digits over time once the recession ends? Likely not.
FactSet Research Terminal
Analysts expect about 7% long-term growth from Cisco. Why so much slower than its subscription sales?
FactSet Research Terminal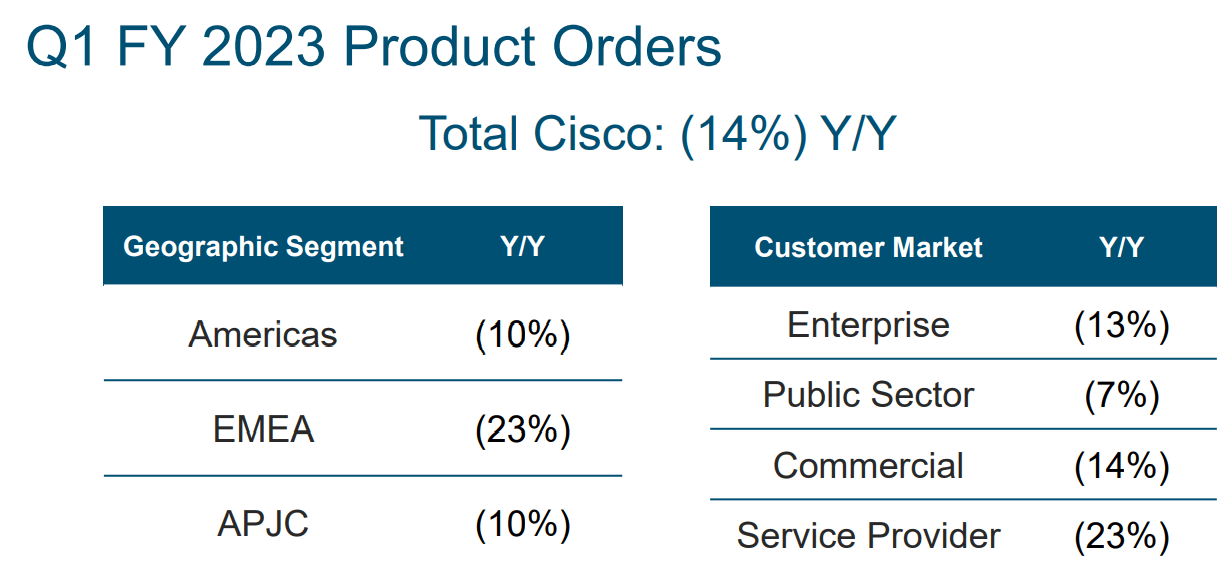
Because Cisco’s legacy hardware business is still cyclical, and the global slowdown is dragging on overall growth.
FactSet Research Terminal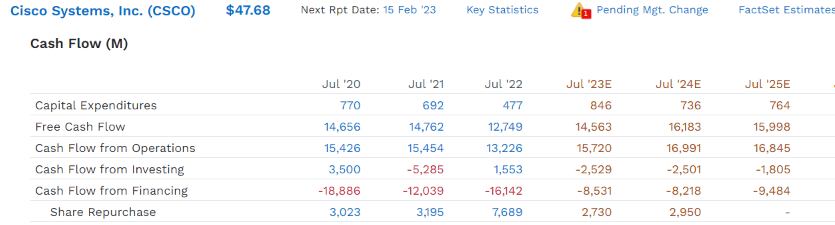
But the good news is that Cisco is a strong free cash flow generator.
- 2022 free cash flow margin 27%
- 2025 free cash flow margin consensus 28%
More than one-fourth of every dollar drops straight to the bottom line, making Cisco’s 3.2% yield so safe.
- $6.25 billion in annual dividend cost
- $8.25 billion in annual retained free cash flow
Cisco’s rivers of recurring free cash flow allow it to keep growing the dividend steadily every year, even in recessions. All while maintaining a rock-solid AA-rated balance sheet according to S&P.
| Credit Rating | 30-Year Bankruptcy Probability |
| AAA | 0.07% |
| AA+ | 0.29% |
| AA | 0.51% |
| AA- | 0.55% (Cisco) |
| A+ | 0.60% |
| A | 0.66% |
| A- | 2.5% |
| BBB+ | 5% |
| BBB | 7.5% |
| BBB- | 11% |
| BB+ | 14% |
| BB | 17% |
| BB- | 21% |
| B+ | 25% |
| B | 37% |
| B- | 45% |
| CCC+ | 52% |
| CCC | 59% |
| CCC- | 65% |
| CC | 70% |
| C | 80% |
| D | 100% |
(Source: S&P)
Cisco has $12 billion more cash than debt and is generating $8 billion annually in retained free cash flow.
FactSet Research Terminal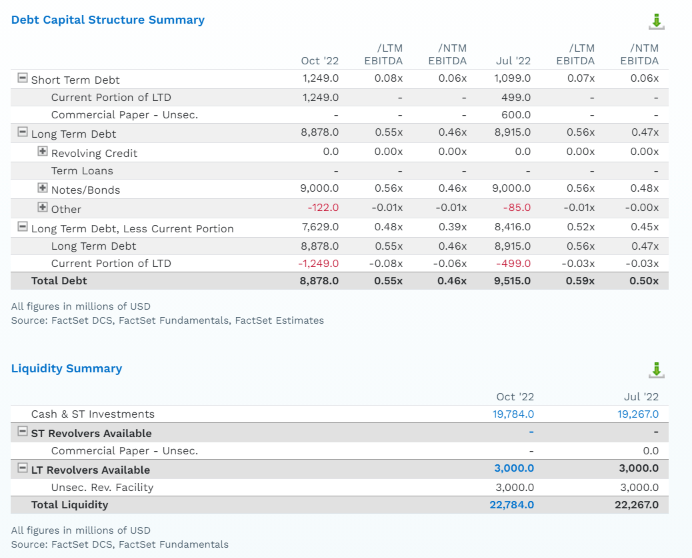
It has access to $23 billion in liquidity right now, more than enough for its frequent tuck-in acquisitions.
And these are just the reasons why Cisco’s 3.2% yield is very safe. There are plenty of reasons to be a long-term investor in Cisco.
Cisco: A Master Of Risk Management
Even Ultra SWAN (sleep-well-at-night) companies have complex risk profiles and here is Cisco’s.
CSCO’s Risk Profile Includes
- Inherent cyclicality of the tech hardware industry (falling with recurring revenue transition)
- Disruption risk (commodity white box solutions are a threat to its high-margin business)
- M&A execution risk (CSCO makes a lot of small bolt-on acquisitions)
- Labor retention risk (tightest job market in over 50 years, and tech is a high-paying industry)
- Cybersecurity risk: hackers and ransomware
- Currency risk: 48% of sales are from outside the US
How do we quantify, monitor, and track such a complex risk profile? By doing what big institutions do.
Long-Term Risk Management Analysis: How Large Institutions Measure Total Risk Management
DK uses S&P Global’s global long-term risk-management ratings for our risk rating.
- S&P has spent over 20 years perfecting their risk model
- which is based on over 30 major risk categories, over 130 subcategories, and 1,000 individual metrics
- 50% of metrics are industry specific
- this risk rating has been included in every credit rating for decades
The DK risk rating is based on the global percentile of how a company’s risk management compares to 8,000 S&P-rated companies covering 90% of the world’s market cap.
CSCO scores 100th Percentile On Global Long-Term Risk Management
S&P’s risk management scores factor in things like:
- supply chain management
- crisis management
- cyber-security
- privacy protection
- efficiency
- R&D efficiency
- innovation management
- labor relations
- talent retention
- worker training/skills improvement
- occupational health & safety
- customer relationship management
- business ethics
- climate strategy adaptation
- sustainable agricultural practices
- corporate governance
- brand management
CSCO’s Long-Term Risk Management Is The 8th Best In The Master List 99th Percentile In The Master List)
| Classification | S&P LT Risk-Management Global Percentile |
Risk-Management Interpretation |
Risk-Management Rating |
| BTI, ILMN, SIEGY, SPGI, WM, CI, CSCO, WMB, SAP, CL | 100 | Exceptional (Top 80 companies in the world) | Very Low Risk |
| Strong ESG Stocks | 86 |
Very Good |
Very Low Risk |
| Foreign Dividend Stocks | 77 |
Good, Bordering On Very Good |
Low Risk |
| Ultra SWANs | 74 | Good | Low Risk |
| Dividend Aristocrats | 67 | Above-Average (Bordering On Good) | Low Risk |
| Low Volatility Stocks | 65 | Above-Average | Low Risk |
| Master List average | 61 | Above-Average | Low Risk |
| Dividend Kings | 60 | Above-Average | Low Risk |
| Hyper-Growth stocks | 59 | Average, Bordering On Above-Average | Medium Risk |
| Dividend Champions | 55 | Average | Medium Risk |
| Monthly Dividend Stocks | 41 | Average | Medium Risk |
(Source: DK Research Terminal)
Cisco is among the 80 companies S&P rates in terms of long-term risk management. If anything can go wrong (and it always will), S&P is most confident that Cisco will be able to adapt and overcome it successfully.
A Wonderful Company At A Good Price
| Metric | Historical Fair Value Multiples (12 years) | 2021 | 2022 | 2023 | 2024 |
12-Month Forward Fair Value |
| 5-Year Average Yield | 2.97% | $49.83 | $51.18 | $51.18 | $52.53 | |
| Earnings | 14.10 | $46.25 | $48.50 | $51.61 | $55.84 | |
| Average | $47.97 | $49.81 | $51.39 | $54.13 | $51.67 | |
| Current Price | $47.61 | |||||
|
Discount To Fair Value |
0.76% | 4.41% | 7.36% | 12.05% | 7.85% | |
| Upside To Fair Value | 0.76% | 4.61% | 7.94% | 13.69% | 11.71% | |
| 2022 EPS | 2023 EPS | 2022 Weighted EPS | 2023 Weighted EPS | 12-Month Forward EPS | 12-Month Average Fair Value Forward PE |
Current Forward PE |
| $3.44 | $3.66 | -$0.07 | $3.73 | $3.66 | 14.1 | 13.0 |
Cisco is historically worth about 14X earnings and today trades at 13X, 9.5X adjusted for cash.
- private equity deals in 2022 averaged 11.3X cash-adjusted earnings
In other words, Cisco is modestly undervalued, even by private equity standards.
This means that, unlike Intel, which offers a rather underwhelming 8% return potential over the next few years, Cisco offers market-beating return potential.
Cisco 2024 Consensus Total Return Potential
(Source: FAST Graphs, FactSet)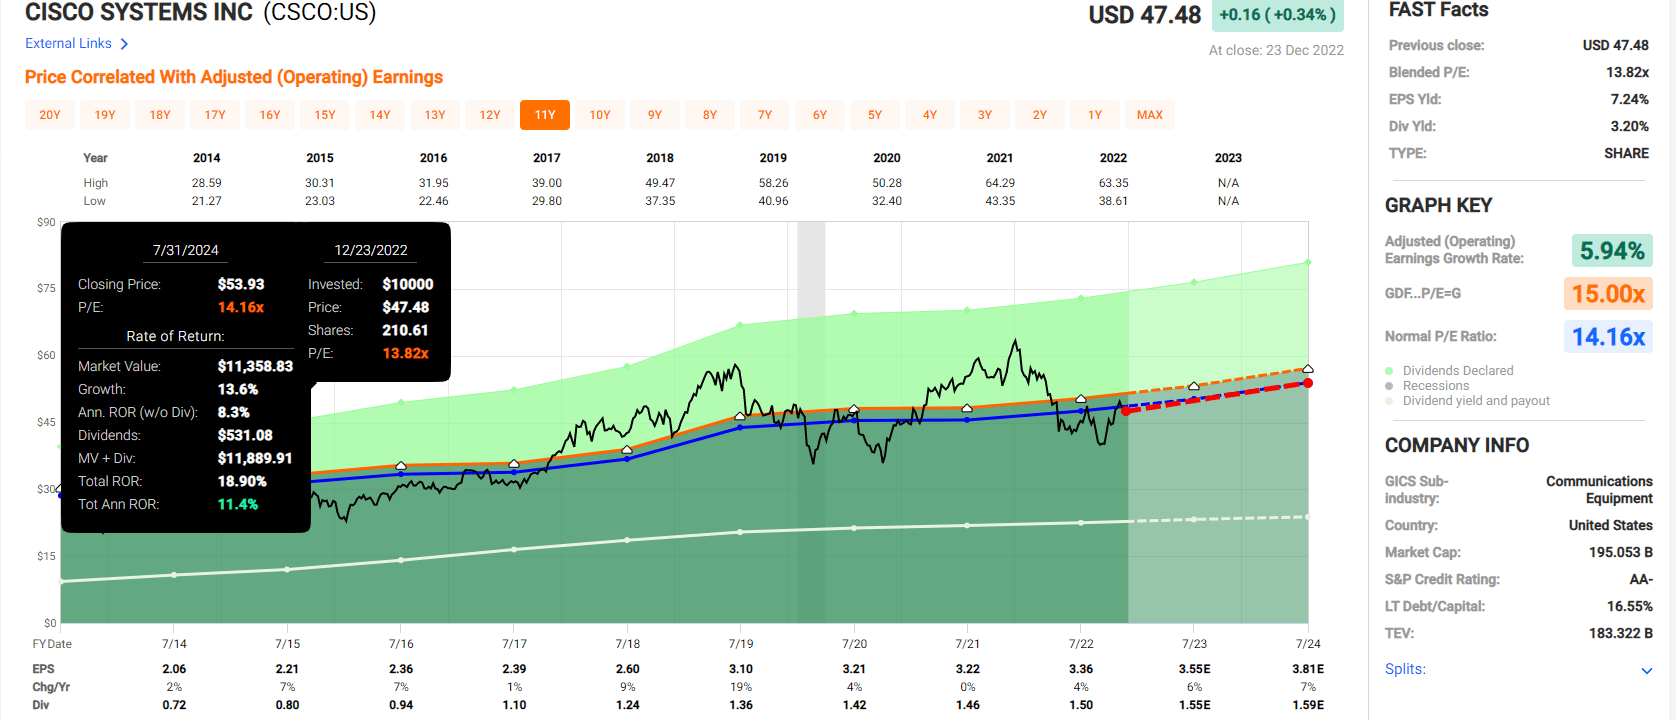
Cisco offers slightly better short-term return potential than the S&P 500 and about 40% more than Intel.
Cisco 2028 Consensus Total Return Potential
(Source: FAST Graphs, FactSet)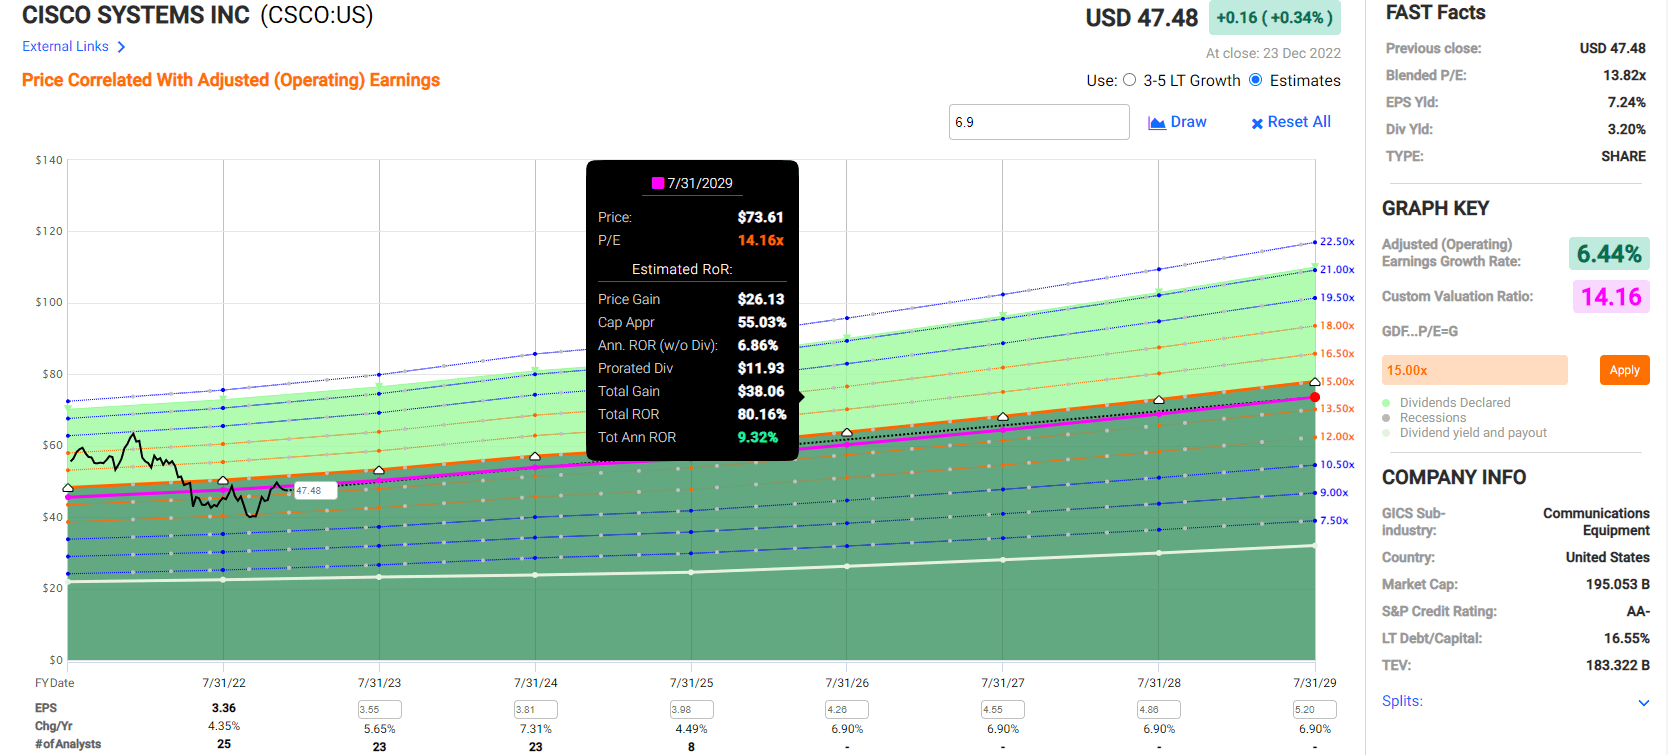
Cisco offers about 80% five-year total return potential, about 60% more than the S&P 500.
Cisco Investment Decision Score
Dividend Kings Automated Investment Decision Tool 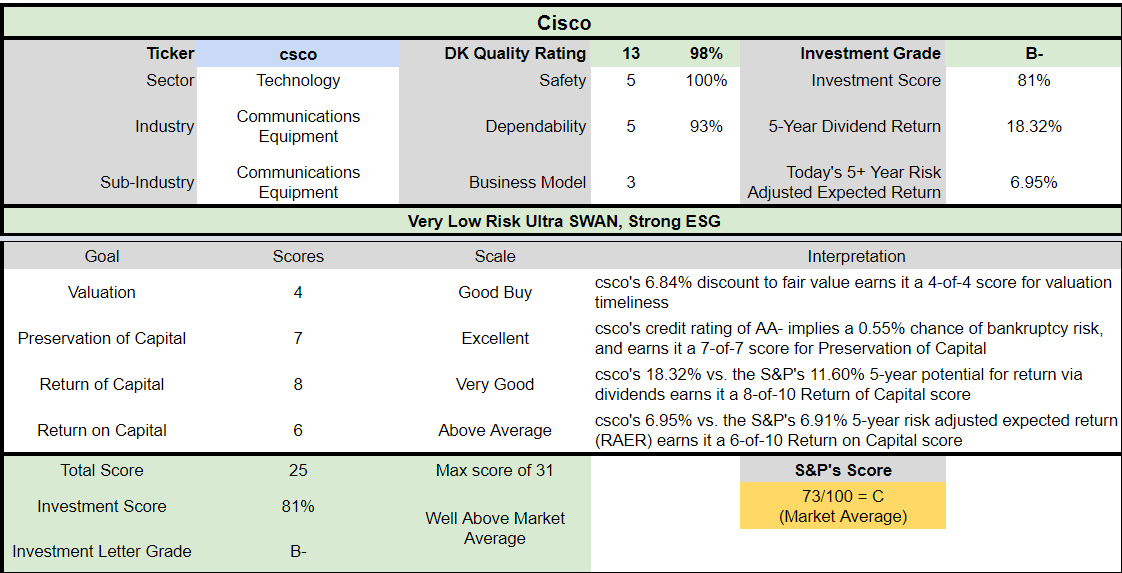
CSCO is a potentially well above-market average, high-yield opportunity for anyone comfortable with its risk profile. Look at how it compares to the S&P 500.
- 7% discount to fair value vs. 1% discount S&P = 6% better valuation
- 3.2% safe yield vs. 1.8% (about 2X higher and much safer)
- approximately 10.1% long-term annual return potential vs. 10.2% CAGR S&P
- equal risk-adjusted expected returns
- 70% higher income potential over five years
Bottom Line: Conservative Income Investors Should Avoid Intel, But Cisco Is A Solid Choice
Let me be clear: I’m NOT calling the bottom in INTC or CSCO (I’m not a market-timer). Nor am I saying Intel might not ultimately succeed in its turnaround.
Ultra SWAN quality does NOT mean “can’t fall hard and fast in a bear market.”
Fundamentals are all that determine safety and quality, and my recommendations.
- over 30+ years, 97% of stock returns are a function of pure fundamentals, not luck
- in the short term; luck is 25X as powerful as fundamentals
- in the long term, fundamentals are 33X as powerful as luck
While I can’t predict the market in the short term, here’s what I can tell you about CSCO and INTC.
Long-Term Consensus Return Potential
| Investment Strategy | Yield | LT Consensus Growth | LT Consensus Total Return Potential | Long-Term Risk-Adjusted Expected Return |
| Intel (Bull Case) | 5.6% | 8.0% | 13.6% | 9.5% |
| Vanguard Dividend Appreciation ETF | 1.9% | 10.2% | 12.1% | 8.5% |
| Nasdaq | 0.8% | 10.9% | 11.7% | 8.2% |
| Schwab US Dividend Equity ETF | 3.4% | 7.6% | 11.0% | 7.7% |
| Dividend Aristocrats | 1.9% | 8.5% | 10.4% | 7.3% |
| S&P 500 | 1.8% | 8.5% | 10.3% | 7.2% |
| Cisco | 3.2% | 6.9% | 10.1% | 7.1% |
| 60/40 Retirement Portfolio | 2.1% | 5.1% | 7.2% | 5.0% |
| Intel (Current Consensus) | 5.6% | -1.2% | 4.4% | 3.1% |
(Source: DK Research Terminal, FactSet, Morningstar, YCharts)
Intel is a great company that spends vast sums of money on R&D and growth. In fact, no one in the industry spends more. But when it comes to delivering on its chip roadmap and returns on that invested capital, it leaves much to be desired.
Intel is potentially turning into the next IBM, a constantly overpromising and underdelivering former innovation legend. One that for the next few years, offers around 8% annual return potential.
Yes, the yield is attractive and likely safe for the foreseeable future. But Cisco is simply a:
- better and more profitable business
- more diversified
- has more stable cash flow thanks to 43% subscription revenue
- superior profitability
- a superior AA-stable credit rating balance sheet
- superior long-term return potential (based on the current consensus growth outlooks)
- 100th percentile long-term risk management
My concern is that Intel might be becoming like IBM. The industry leader in patents and hype but suffering year after year of poor execution and stagnant growth.
If you want exceptional dividend safety and risk management in the top 1% of all companies on earth, in that case, Cisco is a high-yield tech utility that is the superior choice to Intel today.
Be the first to comment