

da-kuk
Investment Summary
With Beyond Air, Inc. (NASDAQ:XAIR) due to report its FY 2022 year numbers on 9th February, we thought it was necessary to gauge how investors are positioning in the stock leading up to the earnings date. Our observations indicate investors are positioned heavily bullish leading into the print, and here I’ll run through our technical findings to support this. Net-net, based on the market generated data, we believe investors are expecting the company to come in with a strong set of results.
I encourage you to read our last 2 publications on XAIR here:
- Beyond Air: Sit Tight, Be Ready For Opportunistic Entry With LungFit PRO Updates
- Beyond Air: Bottom Line Fundamentals Keep Buyers At Bay.
I’ll point out that we are still neutral on XAIR, and here I’m going to retain this position into its earnings, awaiting to see the numbers themselves before acting. However, we’ve got good market-generated data that could be validated should it deliver a strong set of numbers. Hence, we’d encourage investors to take close note of what the market is expecting, should it surprise to the upside. In that vein, we feel the information presented in this report will be of immense benefit to guide positioning pre-and-post XAIR’s numbers.
Note: The key risk investors must realize is that the company comes in with a weak set of earnings. We believe the market is expecting the opposite, but it has been wrong many times before. Investors have positioned with a bullish stance prior to the release, however, there’s scope their estimations could be well off. Investors should realize this prior to making any decisions.
What the market is saying for XAIR before its FY22 earnings
XAIR caught a strong bid at the end of FY 2022 and has curled up off 6-month lows since that point. The 50DMA crossed above the 250DMA in January, and the stock is now setting new weekly highs, backing and filling within the uptrend. The shorter-term MA crossing above the longer-dated average potentially bodes in well for the stock, indicating near-term sentiment has improved. In terms of patterns, we also see a potential cup without handle forming, should this uptrend continue over the coming weeks.
Exhibit 1. XAIR 50DMA/250DMA cross with push off 6-month lows
Data: Updata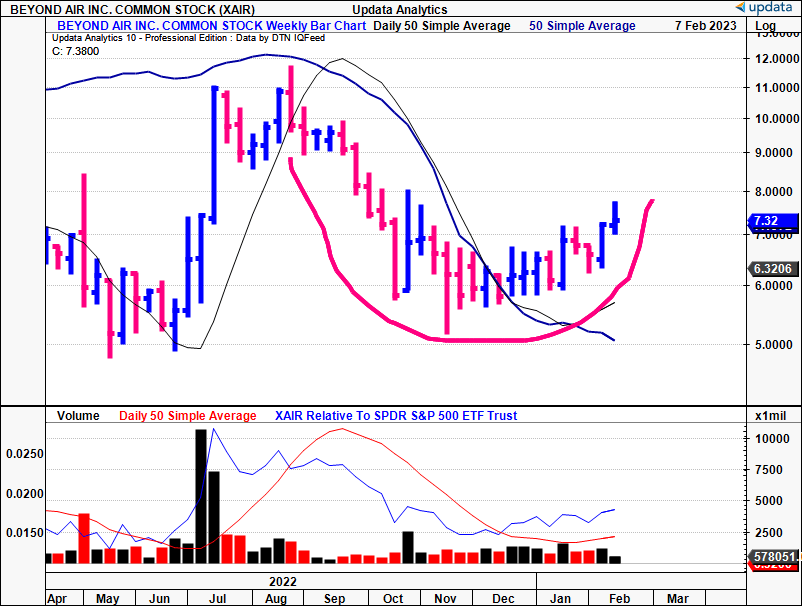
To analyze market expectations over the coming days and weeks, we will use 60-minute and daily time frames, respectively. Looking at where we sit within the trend itself, on the 60-minute chart, the price and lagging line crossed the cloud last week and the stock has rallied off this level, catching a 12.3% bid to the time of writing. We can trade the daily upside targets on our point and figure studies outline later, based on this cloud cross. Support on this chart is at $7.30, so the coming sessions will be critical to hold this.
Exhibit 2. Cloud cross on February 1st on 60 minute cloud chart
Data: Updata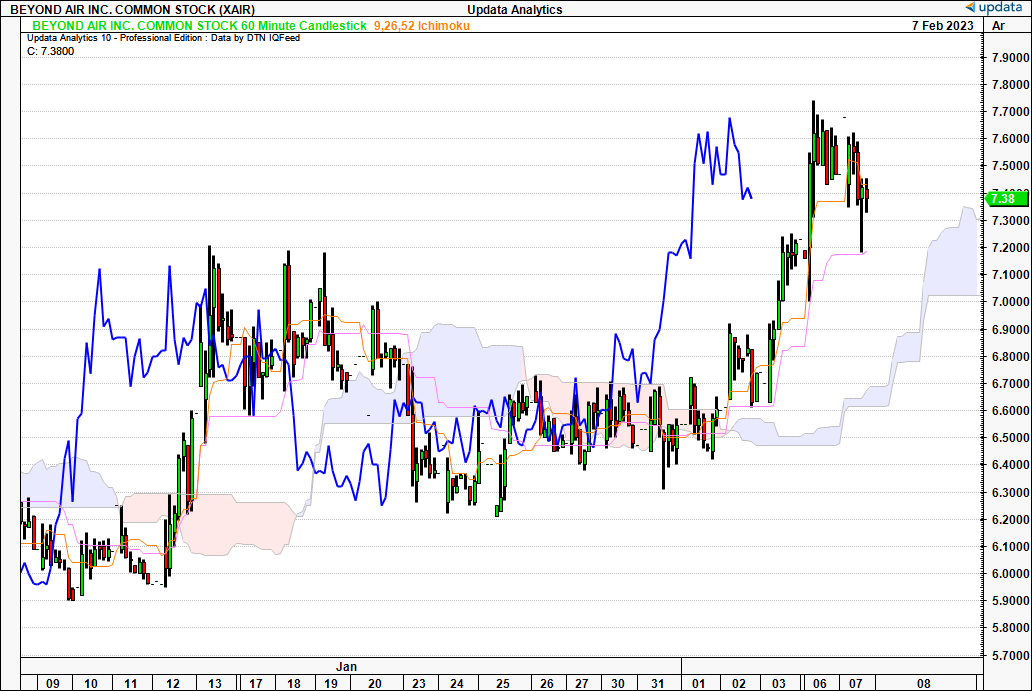
Looking at the daily cloud chart, we’ve got the price line bullish above the cloud, whilst the lagging line has yet to break the cloud top. We need to see the lagging line come up above the cloud in the coming days few days to confirm the bullish trend on this time frame. We are estimating it will get there, provided the earnings report is reasonably strong, and especially if there’s an upside surprise.
Exhibit 3. Daily cloud price line above the cloud, lagging line yet to break the cloud top
Data: Updata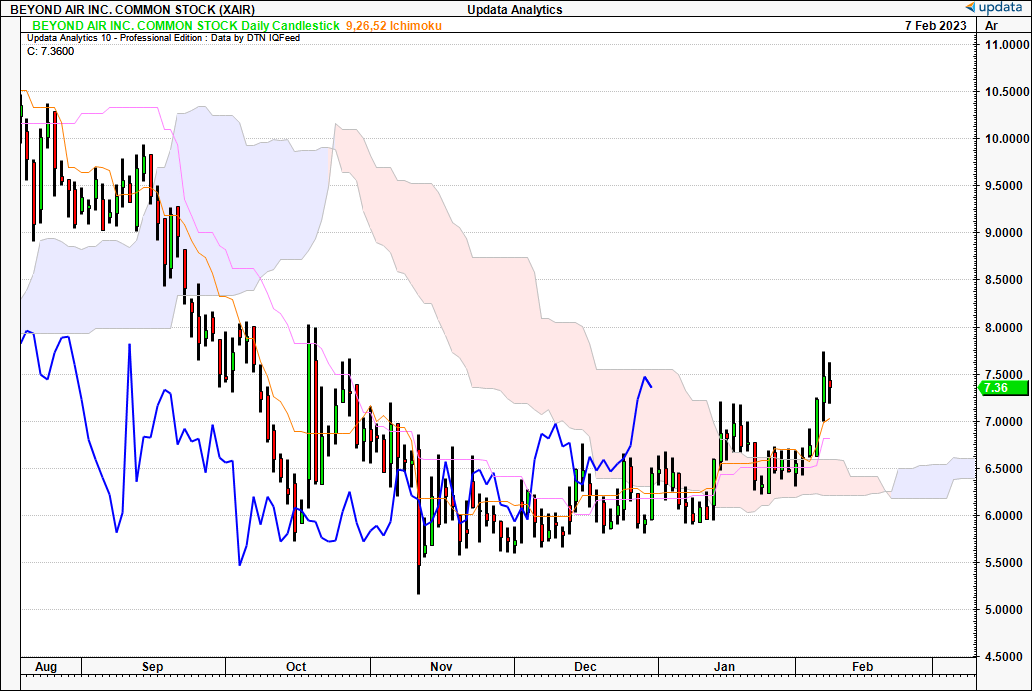
Looking at the options chain, for contracts expiring in February and then out to April, calls are heavily concentrated around $7.50 to $10, respectively. The fact we have high open interest around the $10 mark out to April indicates investors are expecting a price rise to this level on the price ladder. We don’t think this is a hedging process given the skew of demand on calls versus puts.
Exhibit 4. XAIR options chain, contracts for February expiry
Data: Seeking Alpha, XAIR, see: “Options”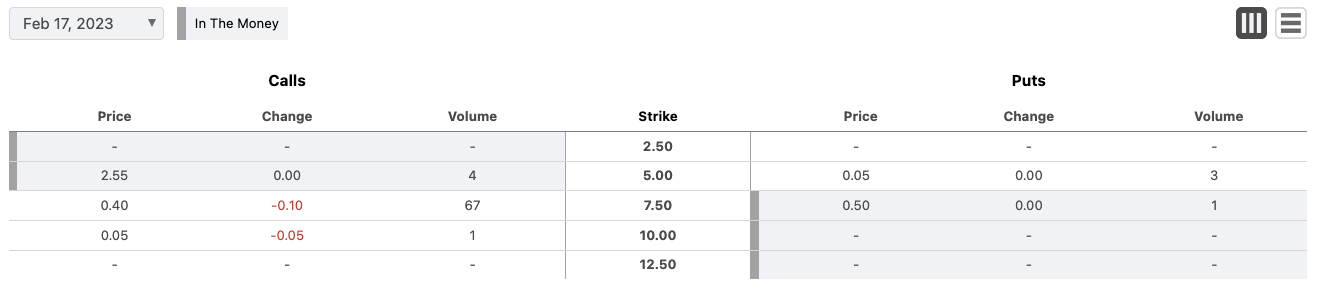
Exhibit 5. XAIR options chain, contracts for April expiry
Data: Seeking Alpha, XAIR, see: “Options”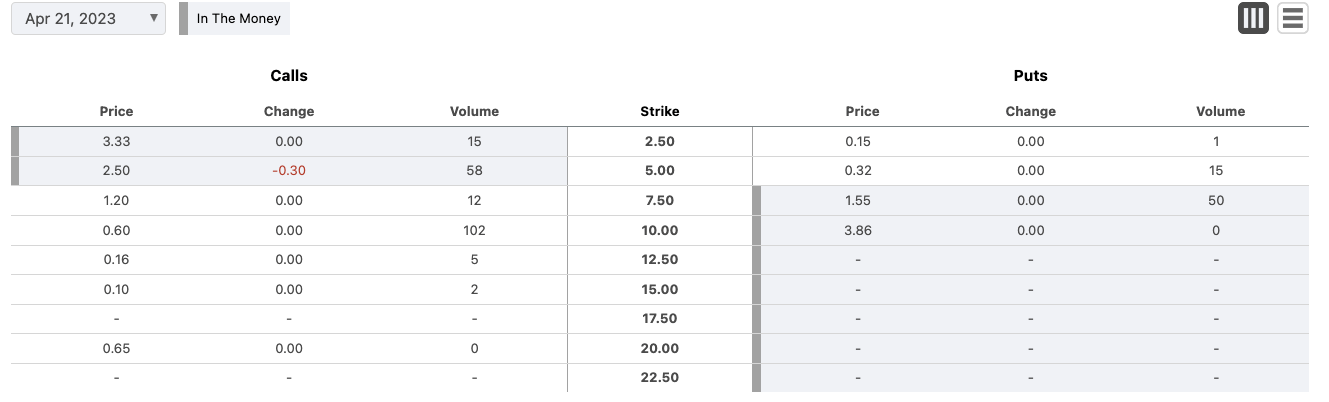
Another point that leads into the market’s positioning has been the spike in inflows exhibited this week. Note, this is the highest amount of equity flows into XAIR over the past 3 months, a further indication investors are anticipating a strong FY22 earnings result from the company.
Exhibit 6. Inflows to XAIR equity leading into FY22 earnings
Data: Updata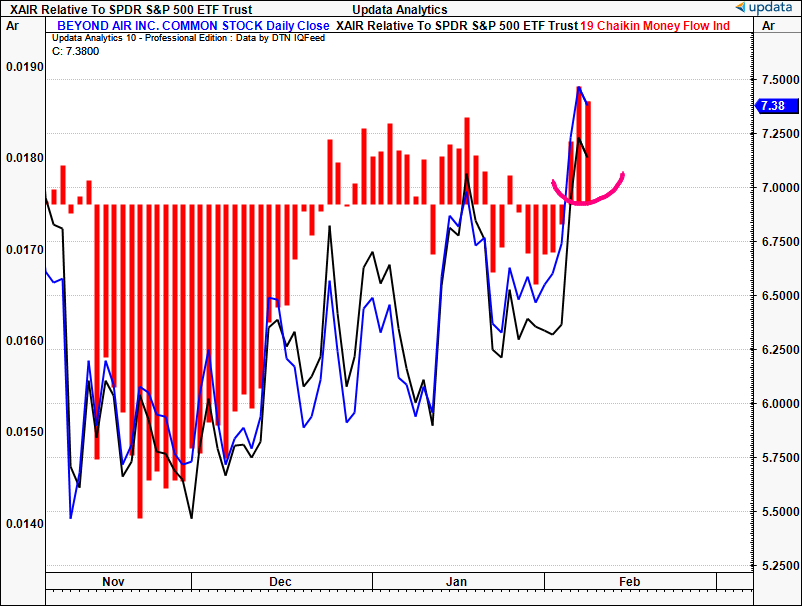
Given these points, the daily and weekly market profiles start to round out the picture. Looking at the days leading into the earnings print, we’d note that value buyers have been active below each point of control (“POC”) and volume has been heavy in the unfair lows along the way. Then, with the thrust off lows rolling into February, demand has been heavy off the previous POC and the price continued to catch a bid to the time of writing. As such, there’s been many time-price opportunities validated over the last 2 weeks.
Exhibit 7. Daily market profile demonstrating buyers active in zones below and above previous POC’s
Data: Updata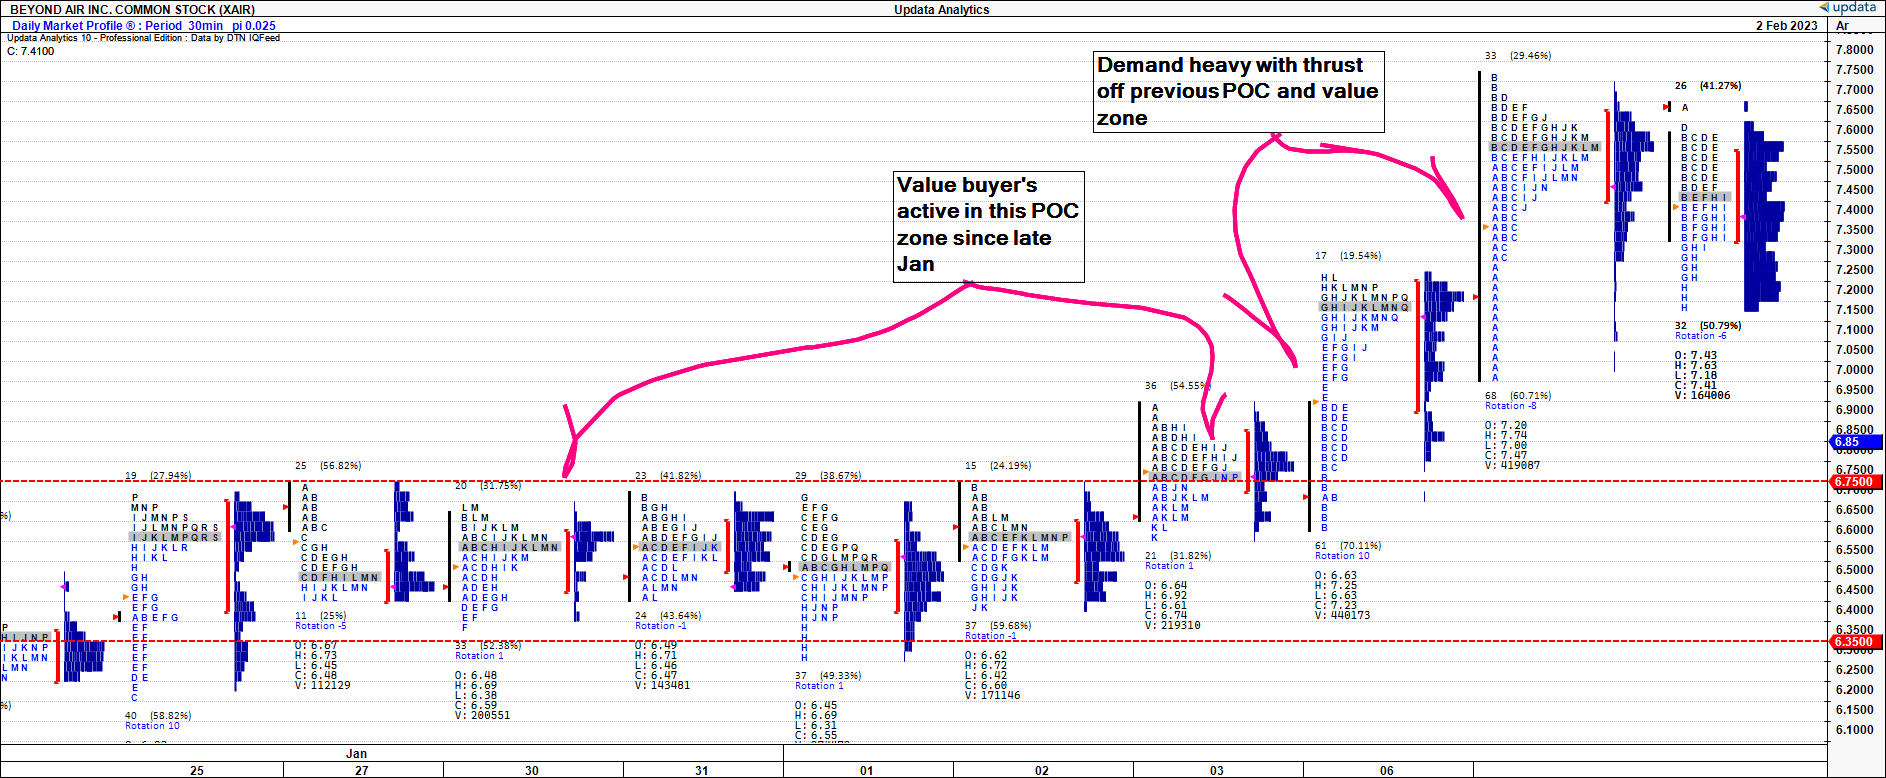
With the weekly profile, the week of January 18th was key, as distribution of demand was heavily skewed below the POC. Demand was there and buyers were heavily active in these zones. Key to the price action was the level of buyers below each POC, as volume distribution indicated smart money heavily active at these points too. The concentrated volume below each POC looks heavily correlated to the upsides.
Inferences that can be made from both the daily and weekly market profiles:
- Accumulation has been strong below each POC, illustrating demand from active players and large accounts entering below the market’s estimate of fair value [the POC].
- Distribution of volume indicating buyers are active at all price ranges on daily, weekly frames.
- Investors comfortable at ~$6.60 last 2 weeks before accepting new POC and wider value zone.
- Many time-price opportunities along the price action from December–date, indicating investors are positioning long leading into XAIR’s FY22 earnings.
Exhibit 8. Weekly market profile, heavy accumulation over last 3-weeks
Data: Updata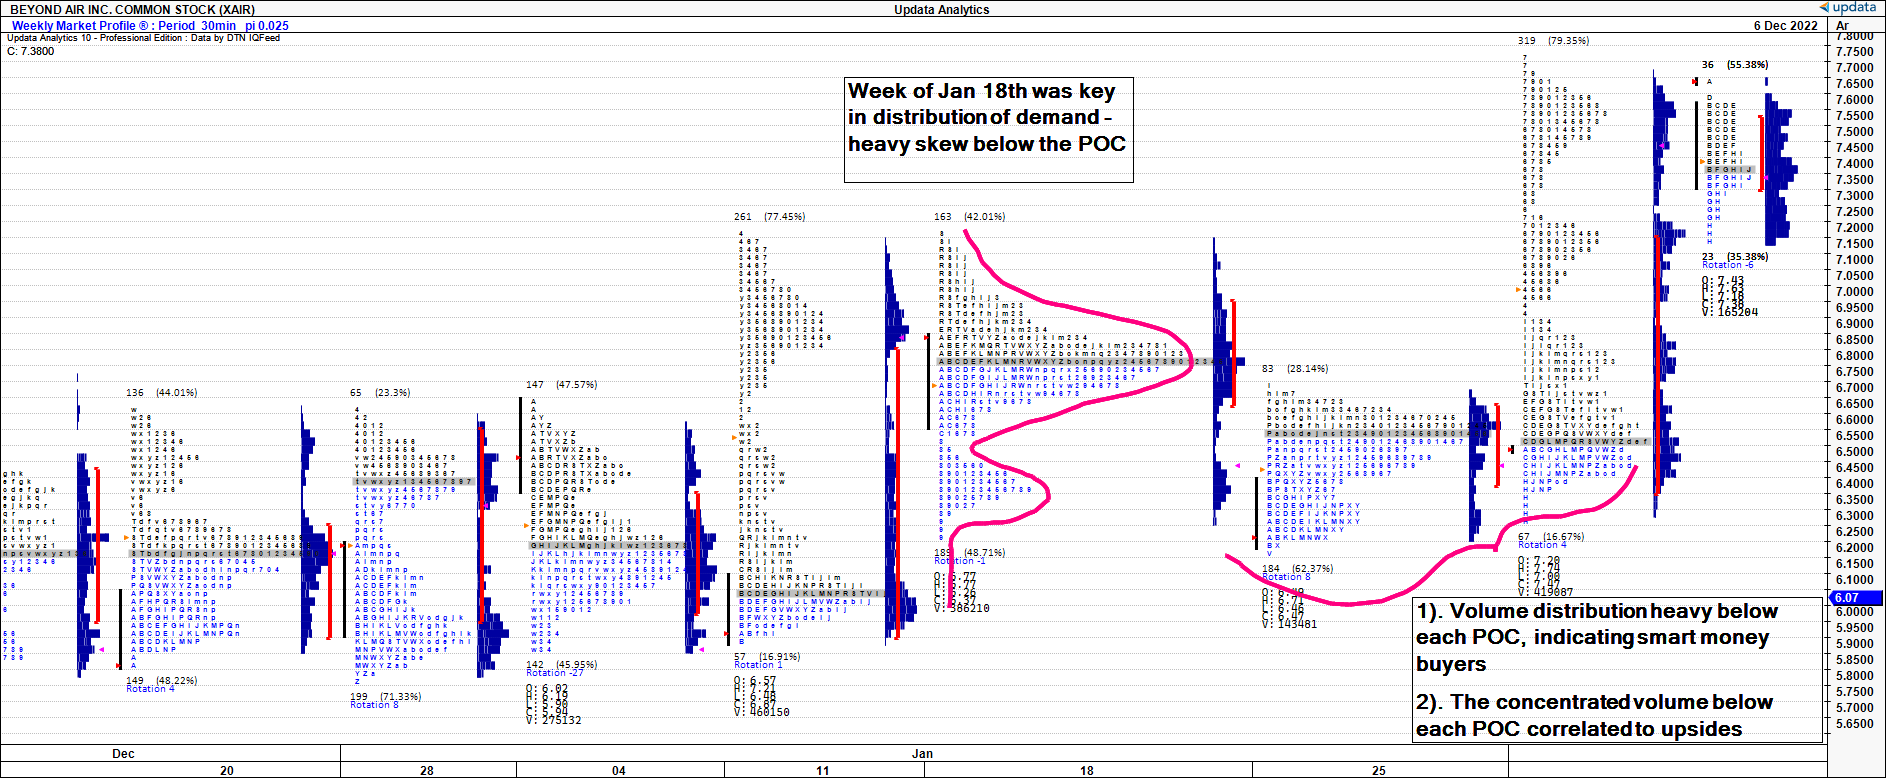
Consequently, we have upsides to $9.50 on the 60-minute time frame. We feel confident in these ranges given that XAIR crossed the cloud [described earlier] in early February and a strong earnings could validate these targets.
Exhibit 9. Upsides to $9.50 on 60-minute chart
Data: Updata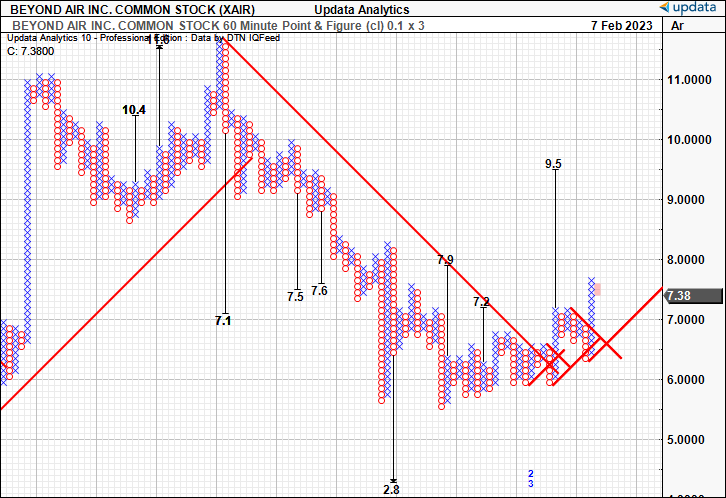
Looking at the daily chart, we’ve upsides to $8.70, adding weight to the targets on the 60-minute frame. Both of these targets are derived on a 0.1×3 box reversal, and, therefore, are sensitive to short-term volatility to gauge changes in trend quite specifically. We are looking to these targets if the company delivers strong numbers in its FY22 report.
Exhibit 10. Upsides to $8.70 on daily chart
Data: Updata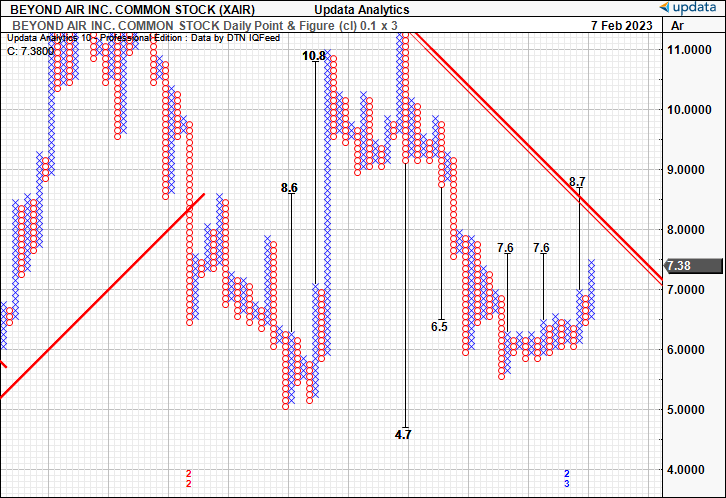
In short
Leading into Beyond Air, Inc.’s FY22 earnings, the investors have a bullish stance, evidenced by the market-generated data. There are multiple data points suggesting they expect a strong earnings result from the company. Whether they are right in their estimations is another thing. We retain a neutral stance until the company posts its numbers, but believe this report will give strong insights as to what to expect should it come in with a strong set of results.
Be the first to comment