

Drew Angerer/Getty Images News
Introduction
Charter Communications Inc. (NASDAQ:CHTR) released its Q4 2022 results two weeks ago (on January 27). CHTR shares fell 4% that day but have since recovered; they are up 18% year-to-date but still down 34% from a year ago:
|
Charter Share Price (Last 1 Year) 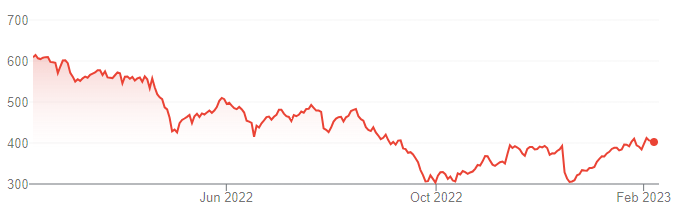 Source: Google Finance (07-Feb-23). |
Compared to the price at which we initiated our Buy rating in January 2020, Charter shares have lost 21%, having first made significant gains that year before falling by 39% since the end of 2020.
Q4 2022 results were stable. Internet net adds were the highest since Q1 last year and Mobile net adds were 55% higher than the quarter before; Internet and Mobile Service revenues together grew 1.6% sequentially. EBITDA growth was positive, but less than our long-term assumption, due to some one-off headwinds that will also impact H1 2023. Management continues to maintain that a slower market, not competition, is the main reason behind Charter’s recent slower growth. Growth may pick up if/when industry gross adds return to normal, Charter’s accelerated build-out starts translating into accelerated passings growth, and/or Fixed Wireless starts to lose share for speed or capacity reasons. These may not happen in the near term. Free Cash Flow has shrunk substantially due to the accelerated CapEx, but still represents a 10% Free Cash Flow Yield excluding the Rural Construction Initiative. Our forecasts indicate a total return of 76% (21.5% annualized) by 2025 year-end. Buy.
Charter Q4 2022 Subscriber Net Adds
In Q4 2022, Charter added 105k Internet subscribers, the highest figure since the slowdown began after Q1 last year:
|
Charter Customer Net Adds by Category (Since Q4 2019) 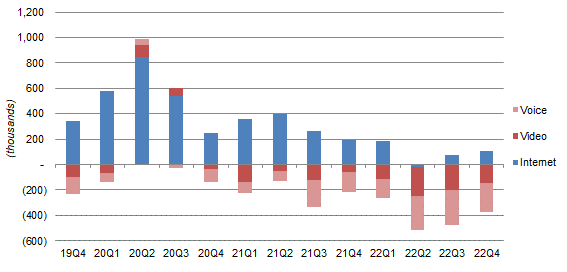 Source: Charter company filings. NB. 2020 figures include customers on COVID-19 support programs, at 119k for Q1 and 270k for Q2. |
Q4 Mobile subscriber net adds were 615k, another new record and 55% higher than the quarter before:
|
Charter Mobile Net Adds (Since Q4 2019) 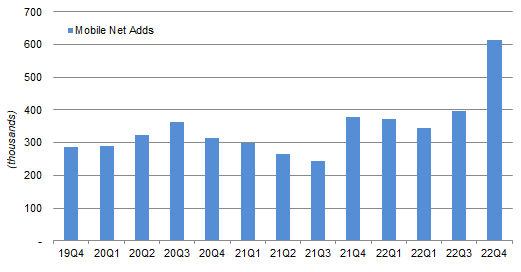 Source: Charter company filings. |
As of Q4, Internet subscribers were up 1.8% year-on-year, and its number of Mobile lines was up 66.2%:
|
Charter Customer Numbers (Q4 2022 vs. Prior Periods) 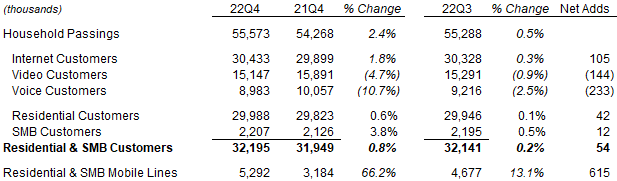 Source: Charter results schedule (Q4 2022). |
The improving subscriber numbers were accompanied by improving financials as well.
Charter Q4 2022 Results Headlines
The table below shows Charter’s Q4 revenue, cost and EBITDA figures, compared to prior periods:
|
Charter Revenues & EBITDA (Q4 2022 vs. Prior Periods) 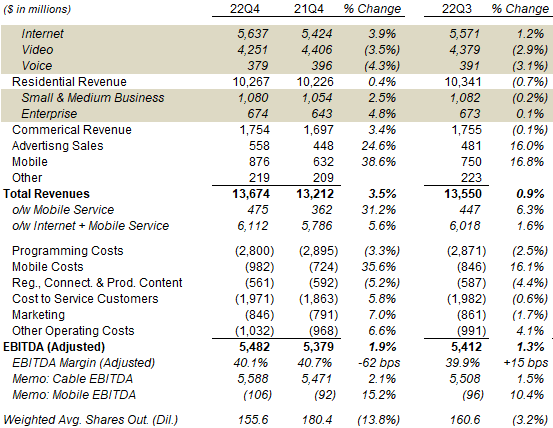 Source: Charter results releases. |
Internet revenues were up 3.9% year-on-year and 1.2% sequentially, the result of both subscriber growth and Average Revenue Per User (“APRU”) increases (which can come from both price increases and upgrades). Charter has “recently” taken “a small increase on Internet” that is “lower than our competitors to maintain competitiveness”.
Mobile revenues were up 38.6% year-on-year and 16.8% sequentially, with more than 50% of the revenues being Service revenues, which were up 31.2% year-on-year and 6.3% sequentially.
Charter’s strategy continues to be value-oriented, prioritizing volume over revenue per user, both to make its business more defensible and to maximise revenue per household by cross-selling Mobile products to existing Internet customers. This has resulted in a smaller growth in Internet revenues than at Comcast (CMCSA), where Broadband revenues were up 5.4% year-on-year (on a subscriber growth of just 0.8%), but a much larger growth in Mobile revenues than Comcast, where Wireless revenues grew “only” 24.5% year-on-year in Q4 (on subscriber growth of “only” 33.5%).
Together, Charter’s Internet and Mobile Service revenues grew 5.6% year-on-year and 1.6% sequentially (which also annualizes to year-on-year growth of around 6%), a solid number in our view.
The legacy Video and Voice businesses each showed a low-single-digit year-on-year decline in revenues. Video is a low-margin business, and Programming Costs fell roughly in line with Video revenues, offsetting most of the impact. Voice is a small business, and part of its decline was due to Charter’s success in selling Mobile products.
Adjusted EBITDA grew 1.9% year-on-year and 1.3% sequentially, less than our long-term assumption of mid-single-digit growth. The growth rates do not reflect structural trends due to a number of one-offs, both positive and negative:
- On the positive side, Advertising sales were much stronger in Q4 2022 than usual because of political advertising spend related to the U.S. mid-term elections.
- On the negative side, several cost lines showed much higher year-on-year growth than usual, because of investments in sales and marketing (including staffing levels and quality), elevated cost inflation, and bad debts normalizing upwards to pre-COVID levels.
Many of the cost headwinds are one-off in nature, as evidenced by their much lower or even negative increases when compared to Q3. However, cost increases are expected to also impact year-on-year growth rates in H1 2023, before moderating in H2. Bad debts also have some way to go before fully returning to pre-COVID levels.
Weak Growth Again Attributed to Slow Market
Management continues to maintain that a slower market, not competition, is the main reason behind Charter’s recent slower growth. As CFO Jessica Fischer said on the earnings call:
“Activity levels remain low. During the quarter, we saw both lower Internet churn and lower Internet connects than in the fourth quarters of 2021, 2020 and 2019. Total churn, voluntary churn and non-pay churn were all lower year-over-year, and we’re at all-time lows for the fourth quarter. Mover churn remains well below pre-pandemic levels …
Gross additions remain down across the footprint by similar amounts in overbuild and non-overbuild areas, similar to what we’ve seen in the past few quarters … We’ve seen a small amount of market share return to mobile-only service over the past several quarters, the reversal of some COVID effects.”
Specifically, on areas with fiber overbuild, Charter tends to see a “small” impact when telco fiber first appears but also continuing growth once the initial period is over. As CEO Chris Winfrey said on the call:
“In areas where we don’t have a gig overlap (with competitor products offering speed of 1 Gbps or more), we are growing and continue to grow despite a low transaction volume marketplace. … Typically in a gig overlap area, you have newly minted overbuild and you have existing overbuild. And (where there is) existing overbuild we’re growing; and (where there is) newly minted, you have a small setback upfront because you have just have a new competitor in the marketplace”
As before, Winfrey did not believe Fixed Wireless took existing Charter customers, though it could have an impact on reducing the flow of new Charter customers, especially from DSL:
“We’ve not seen any demonstrable impact on our churn as it relates to fixed wireless access … it could have had some impact on our gross adds, particularly on adds that we would have pulled from DSL”
Winfrey also stated that price increases have had only “a very limited impact” on churn, and mostly in areas that do not have fiber overbuild:
“When some pricing actions were taken in December, we saw for the first time a very limited impact on our voluntary churn, but not where you would have expected it. It’s actually in our non-gig overlap and in our MDU (Multi-Dwelling Units) footprint where you have higher churn to customers”
On balance we believe at least part of the deceleration in Charter’s broadband net adds is due to unusual, likely temporary, market conditions. Clearly this explanation becomes less credible the longer the slowdown lasts; on the other hand, Charter broadband net adds are showing some sequential improvement.
How Will Things Get Better for Charter?
Charter’s growth will pick up if more of the following happens:
- Broadband wireline industry gross adds return to normal
- Charter’s accelerated build-out starts turning into higher passings growth
- Fixed Wireless starts to lose share for speed or capacity reasons
The improvements may not happen in the near term, though Q4 showed some signs of Fixed Wireless decelerating.
Rival Fixed Wireless Net Adds Slowing
T-Mobile’s Fixed Wireless net adds fell sequentially for the first time in Q4, from 578k to 524k:
|
Wireline & Fixed Wireless Broadband Net Adds – Key Players (Since Q3 2019) 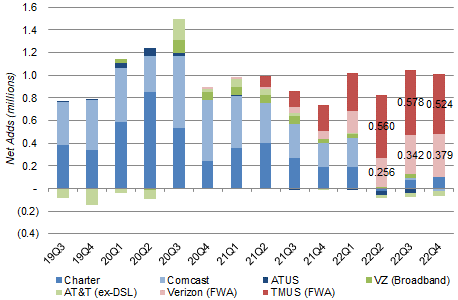 Source: Company filings. NB. Comcast Q1 2022 figure includes one-third benefit from end of COVID free programs. Altice USA (ATUS) has not yet reported Q4 2022 net adds. |
Fixed Wireless net adds at the other main provider, Verizon (VZ), still rose sequentially in Q4, but by a smaller number (37k) than T-Mobile’s decline (54k) and its own net add in Q3 (86k).
T-Mobile observed that churn on its Fixed Wireless product has increased, which they attributed to their customers being newer and containing many who were just trialing the product. What this also means is that some customers who took up Fixed Wireless in 2022 have likely returned to wireline broadband.
Higher CapEx Should Raise Net Adds
Charter’s Line Extension CapEx is expected to be around $4bn annually in 2023-25, compared to around $1.5bn in 2018-21, with the Rural Construction Initiative being the increase while non-rural CapEx stays roughly the same:
|
Charter Line Extension Capital Expenditures (2018-23E) 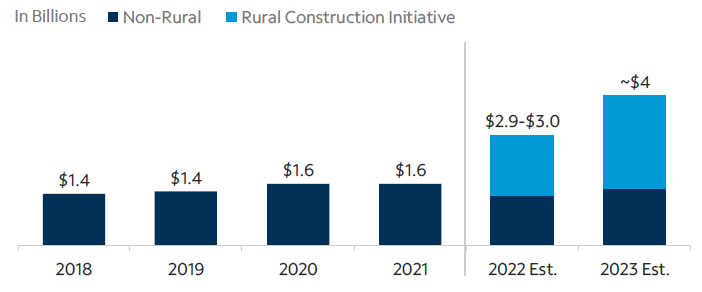 Source: Charter investor day presentation (Dec-22). |
More passings should mean more net adds, as Charter’s penetration on new rural passings after six months continues to be a solid 40%.
The impact was not yet visible in 2022, when passings grew 1.05m, similar to the 1.1-1.15m range in 2019-20, despite “over 200k” of rural passings “constructed” – possibly due to some passings not yet being ready for sale. New rural passings should be much higher in 2023, with “around 300k” to be constructed on subsidized projects alone.
FCF Yield Near 10% Excluding Rural Initiative
Charter generated $5.63bn of Free Cash Flow (“FCF”) in 2022 according to our definition, which deducts non-cash share-based compensation costs, compared to $8.25bn in 2021:
|
Charter EBITDA & Cashflows (2022 vs. Prior Periods) 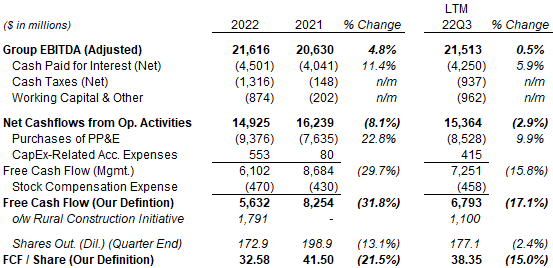 Source: Charter company filings. |
The $2.62bn year-on-year decline was in spite of a $1bn increase in EBITDA, and was due to an $1.27bn increase in total net CapEx (entirely attributable to $1.79bn for the Rural Construction Initiative), a $1.17bn increase in cash taxes (after the past tax losses were used up) and an $0.46bn increase in cash interest expense (as net debt rose in line with EBITDA, while Net Debt / EBITDA rose slightly from 4.4x to 4.5x), offset by higher earnings.
Q4 2022 FCF was $1.03bn in Q4 2022, $1.16bn lower than the prior-year quarter for similar reasons. It was also $372m lower than in Q3 2022, primarily due to CapEx being $401m higher, which included both a $152m increase in Rural Constructive Initiative CapEx as well as a timing impact from equipment inventory arriving early in December:
|
Charter EBITDA & Cashflows (Q4 2022 vs. Prior Periods) 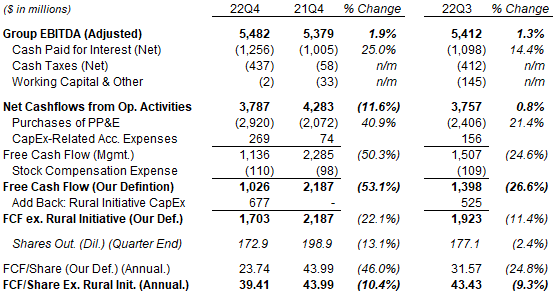 Source: Charter company filings. |
Roughly one-third (around $3bn out of $8.82bn) of Charter’s 2022 CapEx is Line Extension growth CapEx. For Q4, excluding only the $677m Rural Construction Initiative CapEx (out of $2.65bn total CapEx), we arrive at a FCF figure of $1.71bn, which annualizes to $39.41 per share.
With shares at $402.61, excluding the Rural Construction Initiative, Q4 2022 FCF/Share of $39.41 represents an FCF Yield of 9.8%; including the Rural Constructive Initiative, FCF/Share was $23.74 and FCF Yield was 5.9%.
Charter 2023 Expectations
Charter does not provide forward P&L guidance, but management expects to grow both broadband subscribers and EBITDA in 2023:
“I said our goal is to have higher broadband net adds this year, and I think we will.”
Chris Winfrey, Charter CEO
“We don’t give EBITDA guidance, but certainly, we do expect growth in 2023.”
Jessica Fischer, Charter CFO
2023 CapEx guidance remains unchanged, with Line Extension CapEx expected to be around $4bn (compared to around $3bn in 2022) and other CapEx expected to be $6.5-6.8bn (compared to around $6.3bn in 2022). Together these represent a $1.0-1.5bn year-on-year increase in CapEx in 2023.
Charter Return Forecasts
We cut our 2023-25 forecasts, even though 2022 actuals were better than our December forecasts. We now assume the same mid-single-digit group EBITDA growth as before but much higher CapEx from discrete Network Evolution and Line Extension projects. Changes in our assumptions include:
- Cable EBITDA growth to be 2.0% in 2023 (was 4.5%)
- Line Extension CapEx to be $4.0bn in 2024 and 2025 (was $1.6bn)
- Network Evolution CapEx to be $750m in 2023 (was $1bn)
- Interest Expense to be around $400m higher, including $4.6bn in 2023 (was $4.2bn)
|
Charter Cashflow Forecasts (2021-26E) 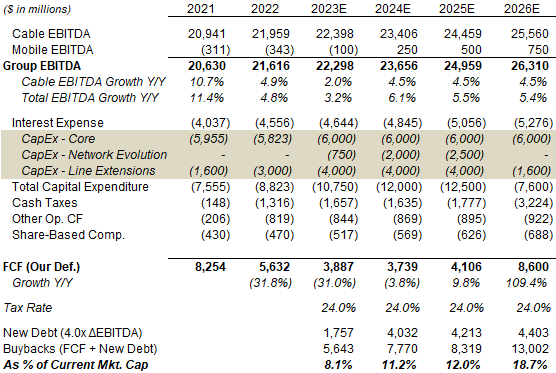 Source: Librarian Capital estimates. NB. CapEx figures are net of accrued expenses related to CapEx. |
For 2025, these assumption changes mean that 2025 FCF is $2.1bn lower, entirely due to $2.4bn of extra Line Extension CapEx (for which we have conservatively assumed no incremental EBITDA); for 2026, our FCF forecast is about $0.4bn lower, entirely due to a higher Interest Expense (as CapEx is expected to have returned to normal by then).
With the lower FCF, we also reduce our assumed share count reductions to 8% in 2023, 10% in 2024-25 and 15% in 2026 (was 15% for all years).
With the assumption changes, our base case now shows a substantial decline in FCF/Share in 2023-24, and a 2025 FCF/Share that is still slightly lower than 2022. However, by 2026, with the discrete projects at an end, we expect FCF/Share to be more than double that of 2022. Our FCF/Share forecasts are now $31.88 for 2025 (48% lower than before) and $78.54 for 2026 (23% lower):
|
Illustrative Charter Return Forecasts 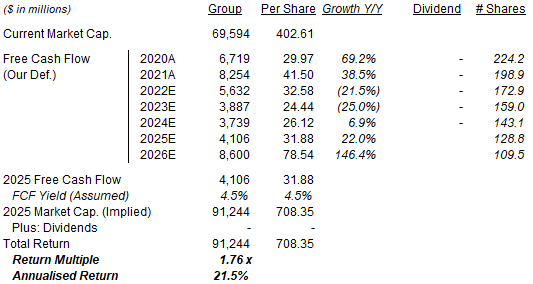 Source: Librarian Capital estimates. |
For our exit assumptions in 2025, because the expected FCF of $4.1bn that year is burdened by $2.5bn of Network Evolution CapEx and $1.4bn of Line Extension CapEx that will disappear in 2026, we assume a lower FCF Yield of 4.5%, equivalent to assuming our previous 6.5% FCF Yield assumptions on a more normalized FCF figure of $5.9bn. This gives us a 2025 year-end price of $708, to which the 2026 FCF/Share figure of nearly $79 represents a 10%+ yield.
With shares at $402.61, we expect an exit price of $708 and a total return of 76% (21.5% annualized) by 2025 year-end.
Is CHTR Stock A Buy? Conclusion
We reiterate our Buy rating on Charter Communications Inc. stock.
Be the first to comment