

Javier Ruiz/iStock via Getty Images
Introduction
Century Aluminum (NASDAQ:CENX) is an aluminum producer with smelters located in the United States and Iceland. The company is based in Chicago, has been incorporated since 1981, and is 42.9% owned by Glencore (OTCPK:GLCNF and OTCPK:GLNCY). The organization’s primary aluminum facilities are in Hawesville and Sebree, Kentucky; Mt. Holly, South Carolina; and Grundartangi, Iceland. Additionally, they own a carbon anode facility in Vlissingen, Netherlands.
For full disclosure, I have owned the company before and may buy it again if conditions improve; at the moment, however, I do not hold it.
CENX’s Wild Ride
Century has had a crazy year. After churning between roughly $12.50 and $15.00 for the better part of 2021 and early 2022, it rallied to around $20.00 in the build-up to Russia’s invasion of Ukraine. Then, in the weeks that followed, aluminum prices spiked from $3,400 to $3,850, and CENX’s ticker surged over $29.00.
Aluminum Price Chart via Trading Economics.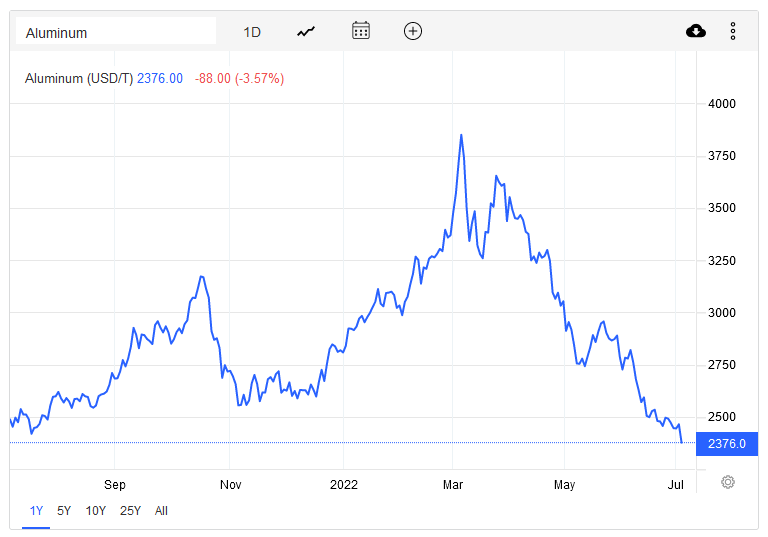
Aluminum has fallen since hitting $3,849 in March, coming all the way down to $2,376. CENX has dropped in sympathy and is currently near its 52-week low at around $6.90. These are levels not seen since 2020 and illustrate how quickly market conditions can change.
Former Investment Thesis and Previous Cycles
In the past, this high beta name was an excellent investment candidate as it had a strong enough balance sheet to weather the downturns. This strength provided investors with a certain degree of safety knowing that solvency risks were low if something unexpected happened. Investors who did well with this stock were those who could stomach buying during selloffs, were patient, and were comfortable knowing it could still fall by more than half in short order.
This said, the investment style was not for everyone. The stock has always had a high beta; even today, for example, the 24-month beta is 1.86 and the 5-year beta is 2.54. Nevertheless, for the right investor, the volatility can be worthwhile or even beneficial over the longer term, because the cyclicality can send the shares to extreme peaks and troughs. Though I was never able to time the top or bottom, the summary below of my personal experience with CENX illustrates the huge swings associated with this stock:
|
Date |
Transaction Type |
Position Size |
Price |
|
March 14, 2012 |
Purchase |
890 |
$8.89 |
|
Oct 8, 2012 |
Purchase |
1100 |
$7.19 |
|
June 24, 2013 |
Purchase |
500 |
$8.77 |
|
Aug 18, 2014 |
Sale |
-490 |
$21.51 |
|
Sept 2, 2014 |
Sale |
-1500 |
$26.23 |
|
Dec 17, 2015 |
Purchase |
2000 |
$3.51 |
|
Jan 12, 2018 |
Sell |
-750 |
$22.25 |
|
Feb 5, 2018 |
Sell |
-750 |
$22.50 |
|
Feb 9, 2022 |
Sell |
-1000 |
$18.39 |
Source: Discount Broker’s Statement.
To make a long story short, in the past, Century has been an excellent investment because of its cyclicality that was backstopped by a strong balance sheet, which reduced the odds of dilution, solvency, and going concern risks.
The Current Cycle and Uncertain Outlook
The current selloff and tendency of lucrative multi-year swings prompts the question, “What are the prospects today?” On the one hand, it is cheap versus where it has traded historically. This table from Seeking Alpha highlights where the stock is trading today compared to its 5-year average and the sector median; in both regards the shares are cheap.
CENX’s valuation table via Seeking Alpha.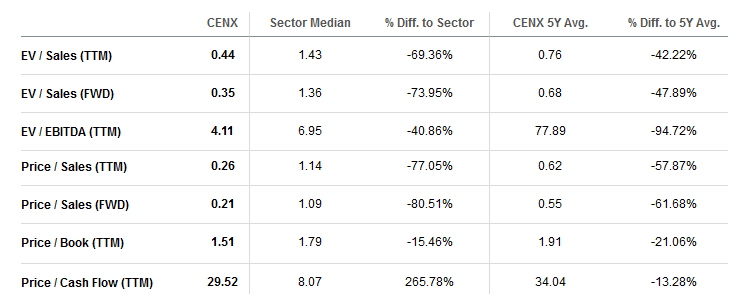
Moreover, the beta associated with the name remains high, and in the future, Century is likely to see major swings based on the price of the underlying commodity. This means investors should be able to ride the stock higher if they have the gumption to pick up shares in a bear market and plug their nose if it falls significantly before rallying.
On the other hand, however, the financial position is much weaker than it has been in prior cycles. The state of the financials means that holding shares is more speculative than in previous periods. The table below illustrates how much the balance sheet has changed over the last decade:
CENX’s balance sheet history by Fintopea.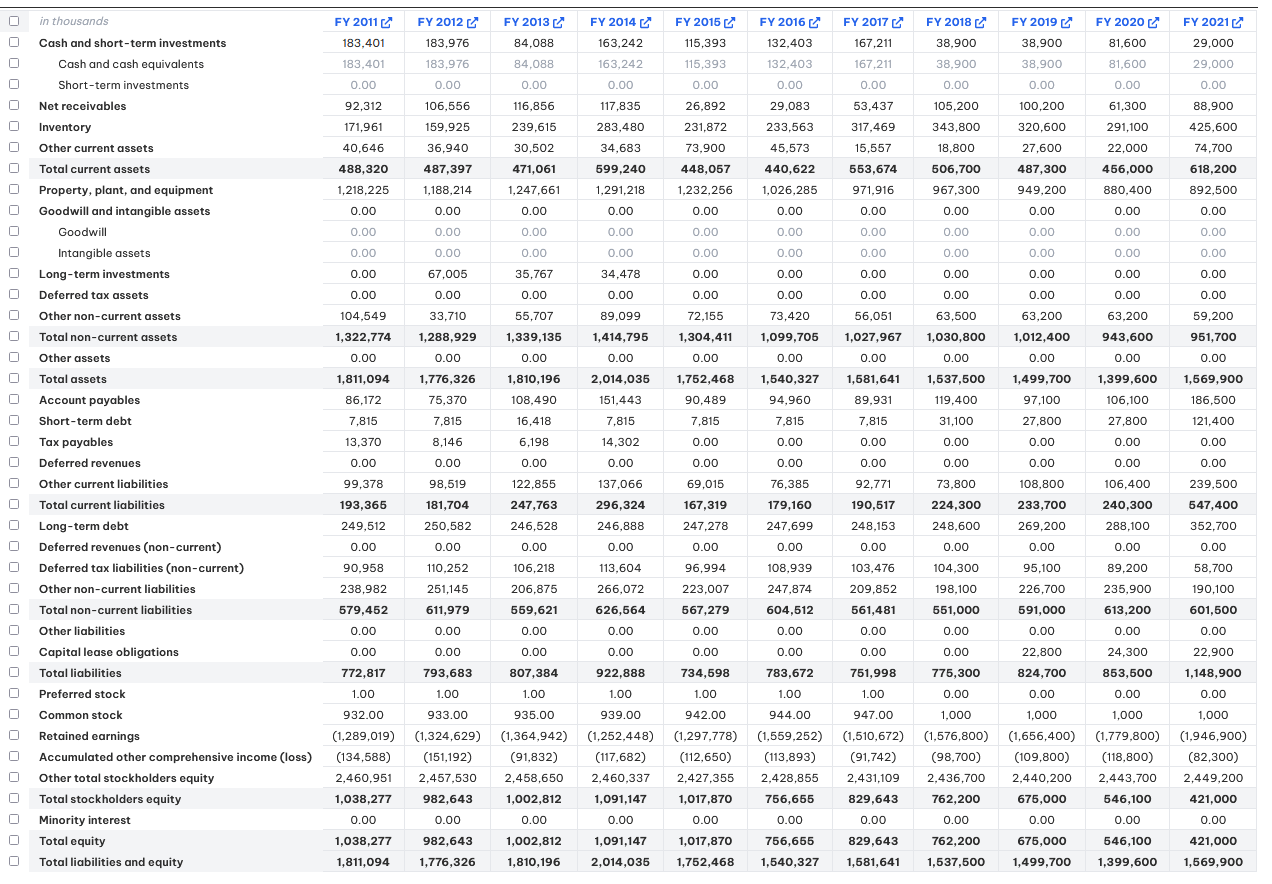
As you can see, cash on hand has declined over 80% in the past decade, while debt has increased 84%. As a result, net debt has grown from $74.3 million to $445.1 million. The current ratio has also narrowed from 2.3 to 1.1, and accounts payable have grown to exceed accounts receivables. The organization’s liability to equity ratio has ballooned from 0.74 to 2.73, and the amount of equity has fallen from $1,038.3 million to $421.0 million. In short, the financial position has weakened significantly.
Conclusion
Taken all together, the combination of low valuations, high beta, and cyclicality suggests investors could do well on the next upcycle. This said, the company’s balance sheet has deteriorated to the point where it no longer provides investors with a margin of safety. Until the finances improve, it is best to remember the saying “buyer beware,” and consider the position more speculative than it has been in the past.
Be the first to comment