

martin-dm/E+ via Getty Images
The Saba Closed-End Funds ETF (BATS:CEFS) invests across a variety of equity and fixed income closed-end funds in a fund-of-funds strategy. If that’s a mouthful, think of CEFS as an “ETF of CEFs” that includes interest rate hedging as part of its strategy. This latter part makes it particularly interesting in the current market environment defined by record inflation and surging rates.
While CEFS has faced its share of volatility this year amid the broader market selloff, the attraction here is that the fund has been able to outperform peers and even the S&P 500 (SPY). The data we’re looking at suggests the team at Saba is doing something right, making CEFS an excellent option for income-focused investors with its +9% yield and monthly distribution. The fund works well providing diversified exposure to CEFs as an important market segment.
What is the CEFS ETF?
An important aspect of the CEFS ETF is that the fund is actively managed which means it’s not intended to track any underlying index and each holding is at the discretion of the portfolio manager. Indeed, active management is a defining feature of the closed-end funds’ universe that sometimes utilize complex investing strategies along with leverage in support of a high-yield strategy.
According to Saba Capital, CEFS seeks to generate high income by investing in closed-end funds trading at a discount to their net asset value. Here, it’s worth referencing that the pricing of closed-end funds often diverges from their underlying NAV because the number of shares is fixed. Closed-end funds can trade at a wide discount or premium to NAV for several reasons, in contrast to ETFs as an open-ended fund structure that has a unit creation and redemption mechanism that keeps its pricing close to parity daily.
source: Saba Capital
The point here is to say that one attraction of the CEFS ETF is that it sort of simplifies the process of investing in closed-end funds through a familiar ETF structure. The fund itself trades at NAV but Saba notes that the aggregate average weighted discount to NAV of CEFS’ portfolio holdings is currently around 13%. The potential that this spread narrows going forward can add an incremental return as part of the bullish thesis for the fund.
The name of the game with closed-end funds and the CEFS ETF comes back to high yield. CEFS currently distributes a regular $0.14 per share dividend every month, a level that has been consistent since 2017, representing a forward yield of 9.2%. This amount has normally been based on a combination of investment income, realized gains, and also a smaller return of capital distribution (ROC). Note the fund also distributed a larger $0.68 year-end dividend in 2021.
Seeking Alpha 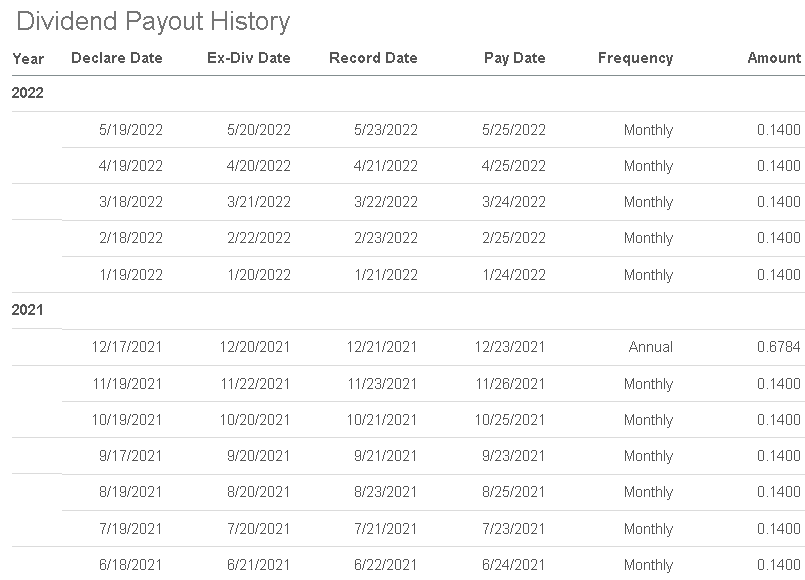
CEFS Portfolio
With a current 75 holdings, approximately two-thirds of the CEFS portfolio is in fixed-income funds with a smaller 33% in equity funds. Within this group, the strategy captures funds focusing on everything from high-yield corporate bonds, municipal bonds, emerging market credit, preferreds, energy sector infrastructure stocks, to large-cap dividend stocks.
Despite this apparent hodge-podge of allocations, a deeper look confirms that there is indeed a characteristic method and investment exposure. What we find is that there is a current tilt towards quality with relatively more conservative closed-end funds amid the ongoing market volatility while also overweight energy-sector equity funds.
source: SABA Capital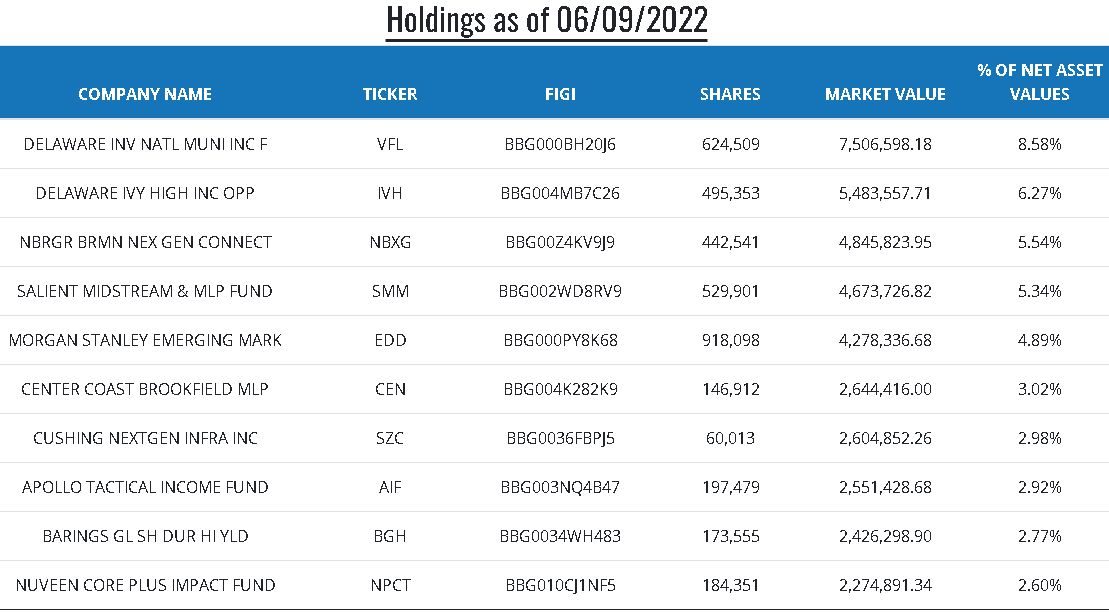
The largest holding with an 8.6% weighting is the Delaware Investments National Municipal Income Fund (VFL). While all fixed-income and bonds have been pressured this year amid climbing rates, “Munis” are expected to be more resilient compared to corporates and high-yield credit. VFL is the top holding in the fund, highlighting the flexibility of the portfolio manager who shifts the portfolio towards quality in the current environment.
Among the top 10 holdings, the Salient Midstream & MLP Fund (SMM) and Center Coast Brookfield MLP (CEN), in particular, have been big winners this year benefiting from the strong momentum in the oil & gas industry and the fund’s bullish positioning on energy.
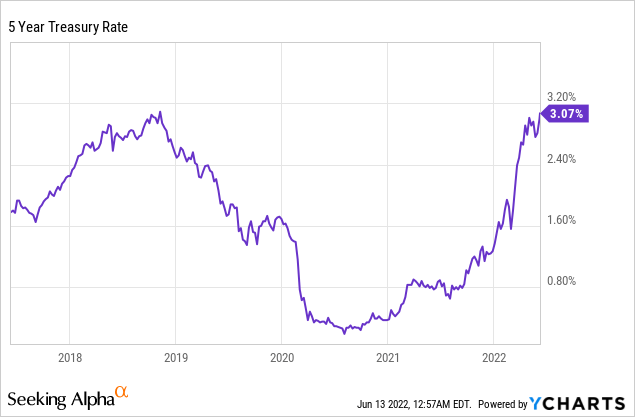
We mentioned interest rate hedging, approximately 21% of the fund’s current notional asset value is tied to a short position on 5 Year Treasury Futures. The idea here is that as interest rates go up, bond prices fall, meaning the short position in Treasuries works as a hedge against the volatility. In essence, considering upwards of 67% of the fund’s exposure is in “long” fixed-income funds, the interest rate hedge has helped net out losses by technically lowering the fund’s effective average duration.
CEFS Performance
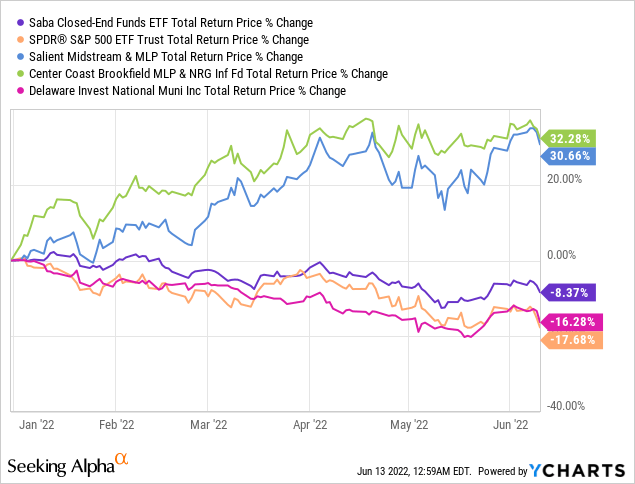
CEFS is currently down 8% in 2022 on a total return basis. Part of the weakness here is the context of the broad market selloff that has also hit closed-end funds which as a group are typically more volatile given the use of leverage by many of the underlying funds in the CEFS portfolio. For closed-end funds, the challenge with leverage is that the downside is accelerated while the higher interest rates also add to borrowing costs further hitting the performance. One theme for closed-end funds in recent months has been generally poor sentiment because of these factors.
That being said, even with CEFS down this year, it’s looking a lot better than the S&P 500 which is in an 18% decline. The fund’s overweight exposure to the energy sector along with the interest rate hedging explain this relative spread. More impressively, we note that CEFS with a 4% decline over the past year has also outperformed the 7% decline in the S&P 500 along with several other “CEF of CEFs” and “ETF of CEFs” over the past year.
The group here includes the Cohen & Steers Closed-End Opportunity Fund (FOF), RiverNorth Opportunities Fund Inc (RIV), Invesco CEF Income Compositive ETF (PCEF), First Trust CEF Income Opportunity ETF (FCEF), and the Amplify High Income ETF (YYY) which are all averaging a 14% decline. Notably, FOF and RIV as closed-end funds are actively managed while PCEF, FCEF, and YYY as ETFs passively track indexes.
source: YCharts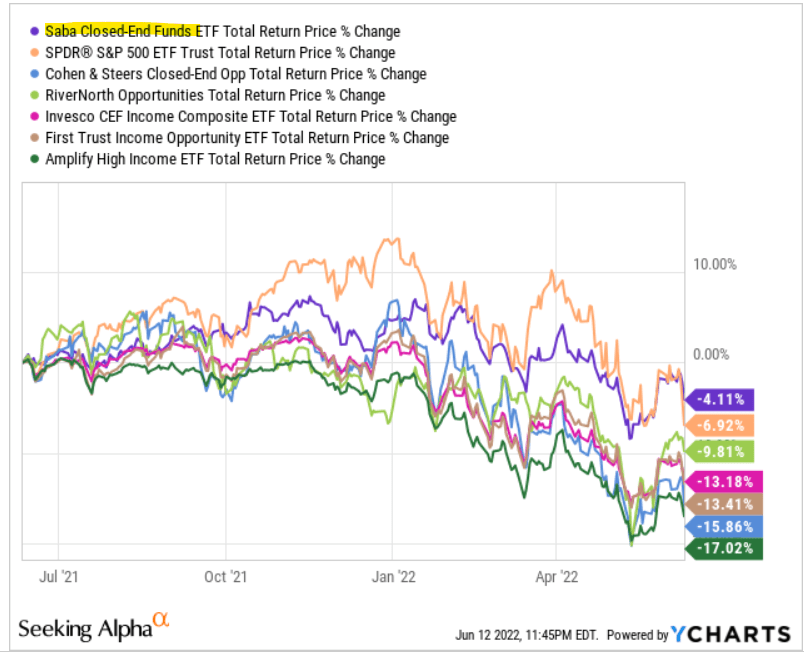
While each of these funds has unique strategies and different exposures, the Saba CEFS ETF stands out with its interest rate hedging which has been key this year as rates have climbed higher. Nevertheless, with data going back to the fund inception date in 2017, CEFS is also the best performing fund in this group over the period with a 47% return.
source: YCharts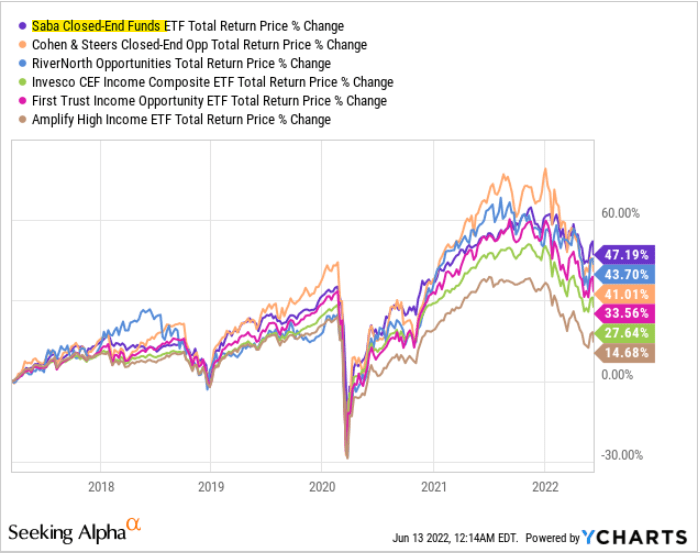
CEFS Price Forecast
The market action has been defined by the persistently elevated inflation forcing the FED to take an ever more hawkish tone towards monetary policy. The expectation is for a string of rate hikes through the rest of this year in an attempt to bring down inflation.
Naturally, the setup has represented a major headwind towards risk assets and bonds alike with significant uncertainties on the strength of the economy. This is on top of the ongoing geopolitical concerns with the Russia-Ukraine crisis, and other challenges like ongoing supply chain disruptions.
For us, the CEFS ETF is a compelling option in this environment given its high-yield income strategy, coupled with energy sector exposure and the interest rate hedging. The bullish case in terms of price appreciation would be some sign that the economy remains resilient while inflation begins to tick lower. In this scenario, we believe many of the beaten-down fixed-income and equity funds within the portfolio can find a bid as rates stabilize. Depending on how the Saba team repositions the portfolio, a more aggressive tilt can help it lead the market to the upside in an eventual rebound.
On the other hand, the main risk to consider would be for a more concerning deterioration in the global macro outlook. Sharply weaker levels of economic activity could result in another leg lower for risk assets and the CEFS ETF would face increased volatility. We’re a bit more optimistic and see improving conditions by year-end as the Fed policy gains traction.
Final Thoughts
While the CEFS ETF doesn’t have the highest yield of any ETF or closed-end fund, we like its balance between income and total return performance. The actively managed strategy keeps it well-positioned to continue outperforming in different market environments. Note that while the expense ratio is listed at 2.9%, this includes the embedded fees from the underlying holdings. The actual management fee from Saba at 1.1% is in line with comparable funds.
Be the first to comment