

shapecharge/iStock via Getty Images
This article was first released to Systematic Income subscribers and free trials on June 11.
Welcome to another installment of our CEF Market Weekly Review where we discuss CEF market activity from both the bottom-up – highlighting individual fund news and events – as well as top-down – providing an overview of the broader market. We also try to provide some historical context as well as the relevant themes that look to be driving markets or that investors ought to be mindful of.
This update covers the period through the second week of June. Be sure to check out our other weekly updates covering the BDC as well as the preferreds/baby bond markets for perspectives across the broader income space.
Market Action
It was a tough week for the CEF space as it was for the broader income space. All sector NAVs were lower though most sectors saw a tightening in discounts.
The reversal of the previous rally pushed CEF returns for June about 2% in the red.
Systematic Income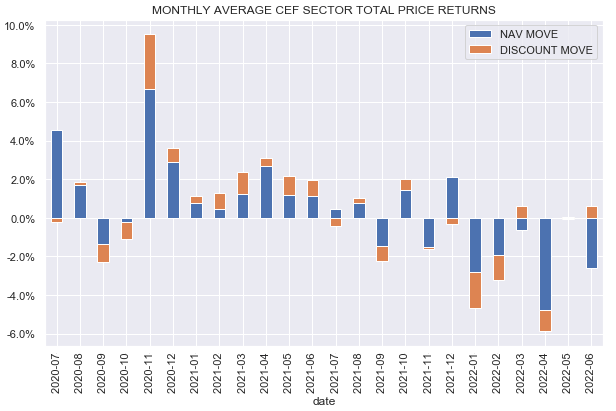
The CEF market reversed about half of its bounce that investors have enjoyed from its May drawdown.
Systematic Income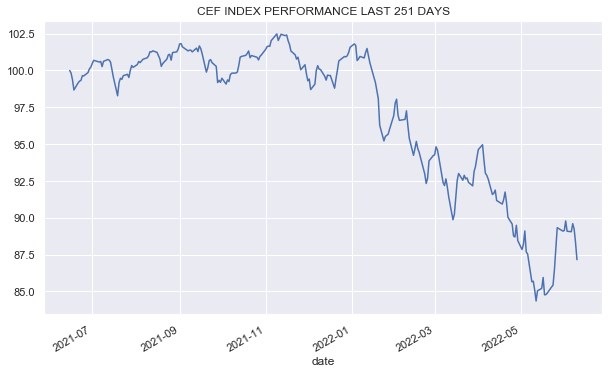
Equity CEF discounts have traded strong and are close to their recent tights while Fixed-Income CEF discounts continue to range trade. This historic divergence between Equity and Fixed Income discounts is unusually large by historic standards (i.e. over the last two decades) and is a reversal of the previous pattern we saw over the past two years.
Systematic Income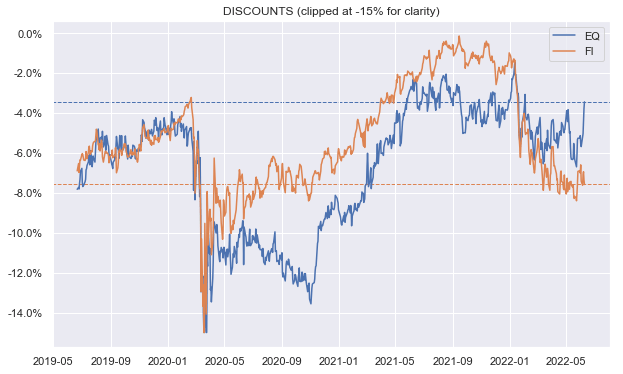
Market Themes
In our experience, the analysis of CEF structure by income investors is often downplayed in comparison to its more glamorous aspects such as yield, discount and manager reputation, to the detriment of better understanding of its forward performance. To illustrate how this can work in practice, let’s take a look at the Nuveen Emerging Markets Debt 2022 Target Term Fund (JEMD). The fund will be transitioning to higher-quality / shorter-duration assets in preparation for its termination later this year.
JEMD has done very well this year despite the volatility across the broader CEF space. It’s down 6.2% in total NAV terms and 4.9% in total price terms this year. By comparison, High Yield CEFs are down 12% in total NAV terms and 18% in total price terms. Even the relatively resilient Loan CEFs are -6% on NAV / -13% on price while higher-quality Muni CEFs are -19% on NAV / -14% on price.
JEMD is a fund we have highlighted a number of times and it is part of the term CEF subset that we focus on specifically. The key benefits of the JEMD fund structure is its relatively low duration which is very common for target term funds as well as the anchoring of its discount due to the expectation of termination / tender offer later on this year.
On the face of it, JEMD was just about the worst fund to hold at the start of the year. It had sizable positions in very difficult parts of the world: Ukraine (war), Lebanon (default), Sri Lanka (default), Turkey (very high inflation due to basket case monetary policy) and others. In addition, it’s fair to say that Nuveen is not an amazing EM bond fund manager as it walked right into a lot of its very difficult positions that went in its face.
However, the fund’s performance has been much more resilient than investors may have predicted. Even the highly respected PIMCO managers had double-digit total NAV return losses year-to-date across their credit funds.
This dynamic highlights the fact that often fund structure and allocation profile is more important than manager quality. This is not to say that manager quality doesn’t matter or that in a supportive market environment a fund like JEMD is going to keep outperforming other credit funds. But rather that investors should focus as much on the fund’s structural features as they often do on its more glamorous aspects like star managers.
Market Commentary
There was a subscriber question about Western Asset Inflation-Linked Income Fund (WIA) planning to distribute around $1 over 2022 – $0.367 is already done. That’s roughly an 8% distribution rate for basically an investment-grade fund. The fund has an ultra high-quality allocation with three-quarters of its portfolio in Treasuries and more than 85% in investment-grade bonds. On the face of it, the fund feels like a slam-dunk – a high single-digit distribution, inflation protection and mostly Treasuries risk.
The reality is a bit different. In terms of yield, TIPS are actually the worst instruments to hold. This is because the way they work is that, say, a nominal Treasury bond is issued at a 3% coupon at the same time that inflation is expected to average around 3%. This is roughly the situation we have at the moment.
What will happen is that the newly issued TIPS coupon will be set at right around zero (the latest 10Y TIPS auction had a coupon of 0.125%), a reflection of the differential between the nominal coupon and the expected inflation rate.
And the way the inflation bit works is that the principal gets adjusted upward based on the move in CPI. So if inflation is 8%, then your coupon in effect increases from 0.125% to 0.135% from the principal multiplier. That’s something but it’s a long way to 8%. What’s worse is that the uplift to the principal is treated as currently taxable income (even though you don’t physically get that principal uplift for 10 years).
Of course, the fund does a lot of tricks like tilting to high coupon TIPS (something credit funds do as well) to drive its income higher however at the end of the day if a fund holds Treasuries you’re going to get Treasury kind of yields – there are lots of ways to obfuscate that fact but economically you can’t change it. The fund’s since-inception NAV CAGR is 3.66%.
The other thing to keep in mind is that TIPS don’t always give you the performance of inflation. For example, inflation has been running around 7-8% year-on-year. What would you guess is the performance of the iShares TIPS Bond ETF year-to-date? Well, it’s 8.5% except with a minus sign in front of it.
Just like nominal Treasuries are a function of nominal Treasury yields (or the other way around if you prefer), TIPS are a function of real yields. 10Y real yields have increased from -0.5% to +0.7% year-to-date and higher yields are bad for bonds and TIPS are bonds. Specifically, they are bonds with a long duration, so they are down. Real yields are much more reasonable now, so we don’t expect TIPS bonds to keep dropping if inflation stays here, but they aren’t the usual slam dunk in a period of high inflation – you need to look at the starting point of real yields too.
The point isn’t that WIA is a bad fund – it’s a fine fund for investors who want to hold mostly TIPS, but they need to understand that its distribution rate has nothing in common with its ability to generate value, nor will it necessarily outperform in a period of rising or high inflation.
Elsewhere, the BNY Mellon Strategic Municipals Fund (LEO) put out a shareholder report. Net income fell for the semi-annual period ending in March though coverage is still around 105%. The fund has more of a revenue / project flavour with a slightly higher-yielding profile – a nice diversifier to the typical muni CEF which tends to have AA-rated GO focus. The fund remains in the Muni Income Portfolio and still remains attractive at a 5.4% current yield / 8.3% discount. Covered yield (i.e. net investment income yield on price) is 0.6% above the sector average.
The Oxford Lane Capital Corp (OXLC) NAV came in at $5.92 in May from $6.47 in April – an 8.5% drop. Our own NAV estimate in the CEF Tool for May was $5.96 which was actually more accurate than we expected but it’s hard to complain. This currently equates to an estimated premium of around 12%, which is high but also in the middle of the range for OXLC.
Systematic Income CEF Tool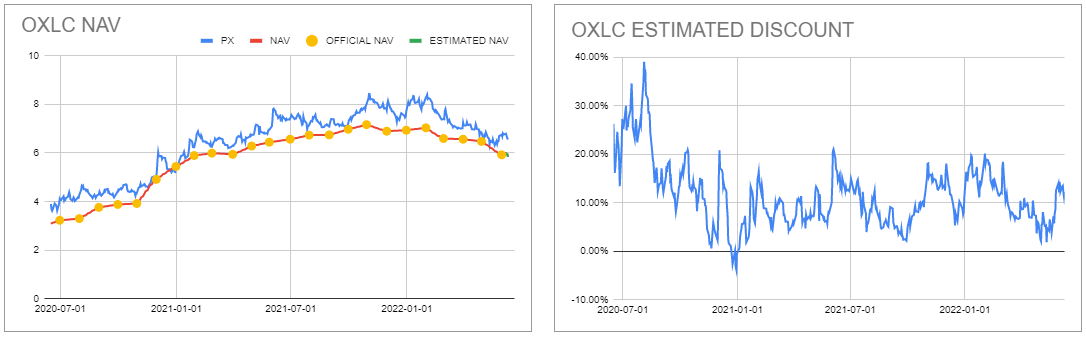
What was also interesting was that the Eagle Point Credit Co (ECC) did not appear to price in the recent weakness in credit spreads or even the drop in the OXLC NAV. ECC fell sharply only on the day its NAV was announced, which was, of course, much lower than its April figure. It’s also important to highlight that investors who rely on something like CEFConnect to make valuation decisions for high-beta funds like OXLC and ECC will invariably go wrong. This is because the CLO Equity CEFs only release monthly NAVs (and even that with a lag), which will misrepresent the valuation available on the site.
ECC at an estimated 11% premium looks expensive, however, its premium often dips into low single digits where it would be a reasonable add for more aggressive investors. Loans are currently trading a few points below par and provide a decent additional source of returns for CLO Equity via the reinvestment option (i.e. reinvesting loan principal repayments into below-par loans). The obvious risk is that default rates are very likely to start going up, if for no other reason that the current default rate is unusually low, and will accelerate in case of a hard landing. We don’t expect default rates to skyrocket, but the trend is worth watching.
Stance And Takeaways
We have been relatively patient in the last couple of weeks and have not chased the recovery in credit assets in the second half of May. As it turned out the rally reversed, much like it did in the previous bounces this year. Instead, we have focused on CEF rotations in our Income Portfolios. Specifically, we shifted from the DoubleLine Income Solutions Fund (DSL) to the PIMCO Dynamic Income Opportunities Fund (PDO) and the Nuveen Preferred & Income Term Fund (JPI).
PDO and DSL have a multi-sector allocation with DSL having more of an Emerging Market corporate debt flavor. Both are trading at roughly the same discount. DSL has held in better than the average multi-sector CEF this year in discount terms, given its wider discount margin of safety.
This now provides a decent opportunity for a reallocation while PDO remains cheap. PIMCO has delivered a higher total NAV return historically than the DoubleLine suite, so they’ve been better able to maneuver through difficult market periods with lower realized / unrealized losses.
JPI (preferreds sector) is more of a term fund play given its decent 2% per annum tailwind. Preferred stock underlying yields of 5-6% is close to their decade-high level. After leverage, JPI has close to an 8% covered yield and the additional 2% tailwind gets you close to 10%, which is hard to beat for a relatively high quality allocation profile.
Be the first to comment