

shapecharge/iStock via Getty Images
This article was first released to Systematic Income subscribers and free trials on Apr. 2
Welcome to another installment of our CEF Market Weekly Review where we discuss CEF market activity from both the bottom-up – highlighting individual fund news and events – as well as top-down – providing an overview of the broader market. We also try to provide some historical context as well as the relevant themes that look to be driving markets or that investors ought to be mindful of.
This update covers the period through the last week of March. Be sure to check out our other weekly updates covering the BDC as well as the preferreds/baby bond markets for perspectives across the broader income space.
Market Action
The CEF market staged an impressive rally this week, driven by both NAV gains as well as discount compression. All sectors ended the week in the green.
Systematic Income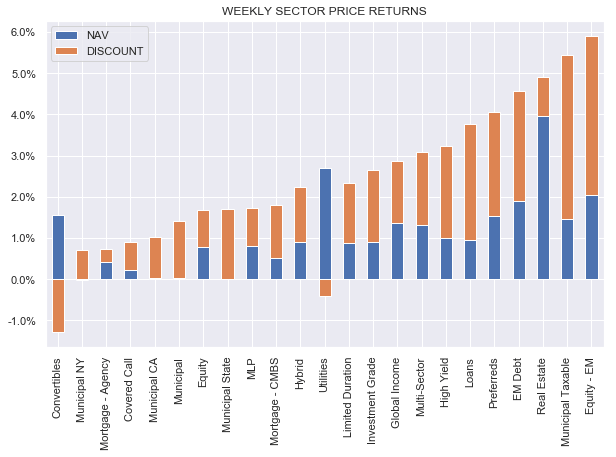
On a monthly basis, March finished pretty flat with discount compression offsetting further NAV weakness.
Systematic Income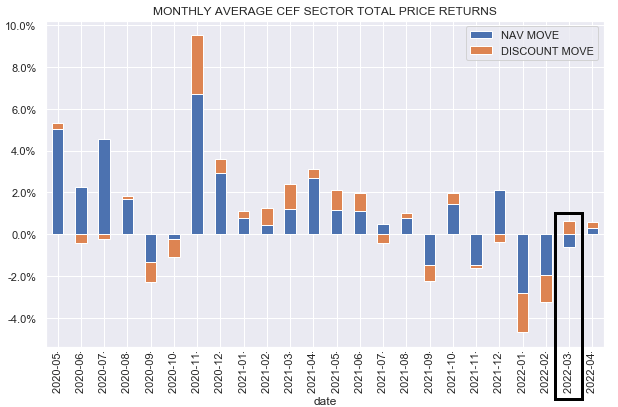
The CEF total return index has moved a touch back above its level a year ago with a 4% gain from the lows last month.
Systematic Income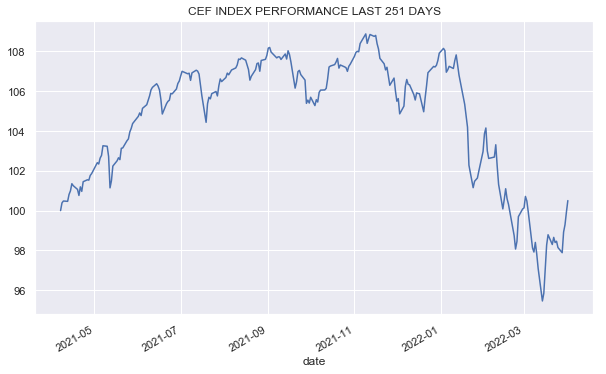
Fixed-income and equity CEF sector discounts bounced about 2% during the week. Fixed-income sectors are in the fair-value longer-term range, while equity sector discounts continue to look expensive.
Systematic Income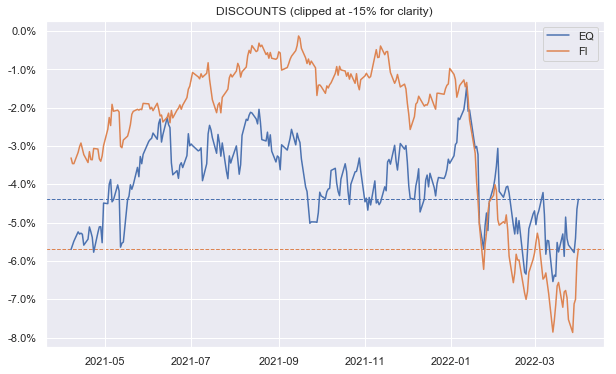
If we look at the path of credit CEF valuations across both credit spreads (x-axis) and discounts (y-axis) we see that March closed with a rally in both credit spreads and discounts relative to February. We also see that valuations remain in the middle range – not as extreme as the 9 months spent in the expensive upper left-hand quadrant featuring both very tight credit spreads and expensive discounts but also not the very cheap numbers we saw in 2020. The best thing we can say about the CEF space at the moment is that, unlike in late 2021, it’s not stupidly expensive.
Systematic Income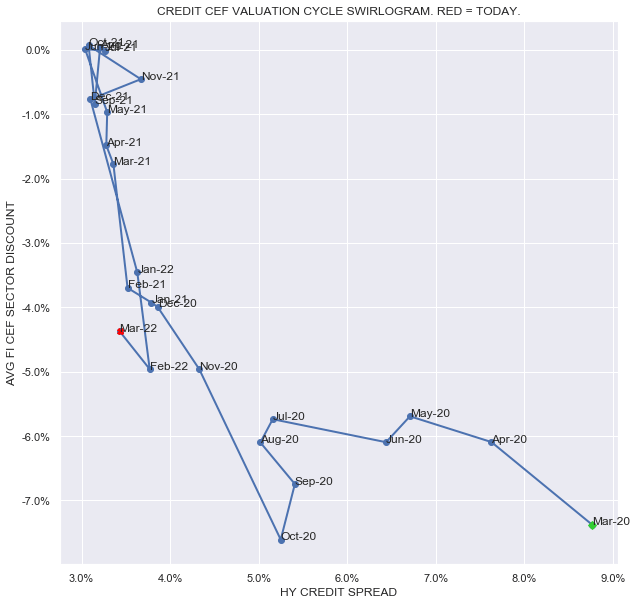
Market Themes
A question we occasionally encounter from readers and subscribers is why CEFs often fail to move in accordance with the intuition that many investors have of financial markets. For example, interest rates across both short and longer-end rates have risen appreciably so far this year as the following chart shows.
Systematic Income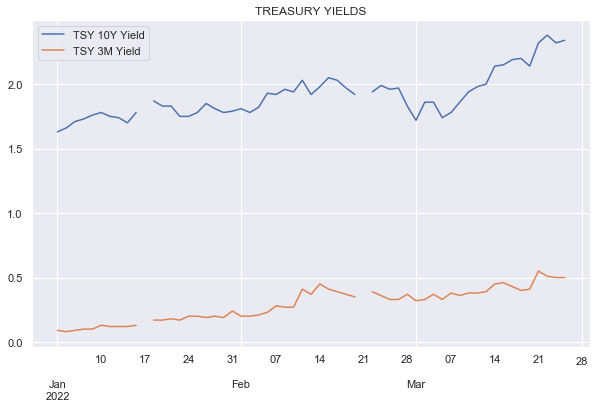
However, since many investors have internalized that “higher rates are good for loan funds”, they are now surprised by the fact that not only are loan CEF total NAV returns (and NAVs) lower for the year but the sector’s total price return is around -4%.
Systematic Income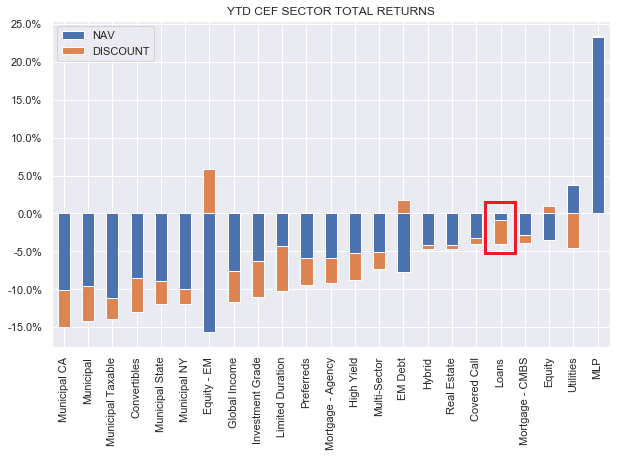
Taking a closer look at the sector, most loan CEF NAVs have moved lower since the start of the year. Only three funds have delivered decidedly positive total NAV returns over this period (i.e. including distributions).
Systematic Income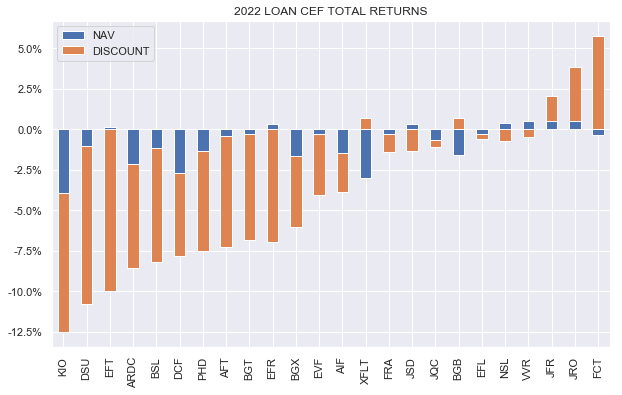
To see why the intuition of “higher rates are good for loan funds” is (as usual) more complicated than many investors (or analysts, for that matter) will admit, it’s worth quickly reviewing some of the key mechanics of loan CEFs .
First, loan CEF prices and NAVs are linked only indirectly which is why CEFs can trade at significant discounts and premiums. During risk-off periods such as the one we have seen year-to-date, discounts typically widen – pushing price returns lower which is what has mostly happened to the loan CEF sector this year. Second, loan prices and loan CEF NAVs are not a direct function of “rates” – a better way to think about loans is as credit-risky instruments that are driven a lot more by credit spreads (i.e. discount margins) rather than “rates”. And because it has been a mostly risk-off period you would expect loan prices to move lower a bit which they have.
It can help to think in terms of two different kinds of duration – interest rate duration and credit duration. Interest rate duration is an asset’s sensitivity to changes in risk-free rates like Treasury yields and its credit duration is its sensitivity to changes in credit spreads (or discount margins for loans).
For example, a 10-year fixed-coupon corporate bond has a high interest rate duration and a high credit duration. A floating-rate loan with a 6-month maturity has a very low interest rate and credit duration. And a floating-rate loan with a 10-year maturity has a low interest rate duration and a high credit duration. Because loans held by CEFs have intermediate credit duration (because they tend to have maturities of 3-5 years) they can be fairly sensitive to changes in overall credit spreads and modestly lower loan CEF NAVs this year have illustrated this dynamic pretty well.
Three, when people talk about “rates” they often fail to make a distinction between short and long-term rates. The rate that matters a lot more for loan CEFs are short-term rates i.e. Libor which is what anchors their coupons so higher Libor (at least above the Libor floor, if there is one) drives a higher loan coupon. And while the Fed has made its first hike and Libor has moved already higher earlier in the year in expectation of a series of hikes this year, this hasn’t yet really translated into higher loan coupons and, hence, higher loan CEF income levels for two reasons.
One is that Libor is set in arrears every 3 months so current loan coupons are predominantly still set off earlier lower Libor levels and will only align with current higher Libor in the next few months. And two, most loans feature Libor floors (typically, set to a level between 0.5-1%) which means that coupons of many loans will not actually reset higher until Libor increases a bit further.
Fourth, nearly all loan CEFs feature leverage financing that is also floating-rate. This means that while they benefit from higher floating-rates on the asset side of the balance sheet, they pay some of that benefit away in the form of higher leverage cost on the liability side of the balance sheet. This is particularly relevant at the start of the hiking cycle because CEF credit facilities, unlike loans, do not have Libor floors and have already started to rise, creating an odd dynamic of loan CEF net income having fallen this year. This should be reversed in the coming weeks and months.
Finally, because loans can be refinanced by issuers, there is a limit as to how high their prices can go. At year end, loan prices were pretty close to par of $100 – when loans trade around par they will struggle to move above par because the issuer can easily refinance the loan i.e. if you buy the loan at $102 the issuer can typically just give you $100 back and get a new loan at a tighter discount margin from someone else (the fact that the loan price traded above par is a signal to the market that it’s willing to earn a lower discount margin than what the loan is currently paying which is a signal to the issuer to go and try to refinance it at a lower discount margin).
The key takeaway here is that “higher rates = higher loan prices” is not a particularly useful guide for investors. Rather, loan CEF income levels will rise eventually and relatively modestly while a recovery in their prices will need to wait for a further recovery in risk sentiment. Overall, the recent push wider in discount margins and the widening of loan CEF discounts makes the sector relatively attractive in our view.
Market Commentary
We highlighted a few CEF insider buys on the service (which are tracked daily). For example, Mario Gabelli has gone to town on (GDL). In credit funds, it was interesting to see buys in the Virtus AllianzGI Convertible & Income Fund II (NCZ) and the Ares Dynamic Credit Allocation Fund (ARDC).
Systematic Income CEF Tool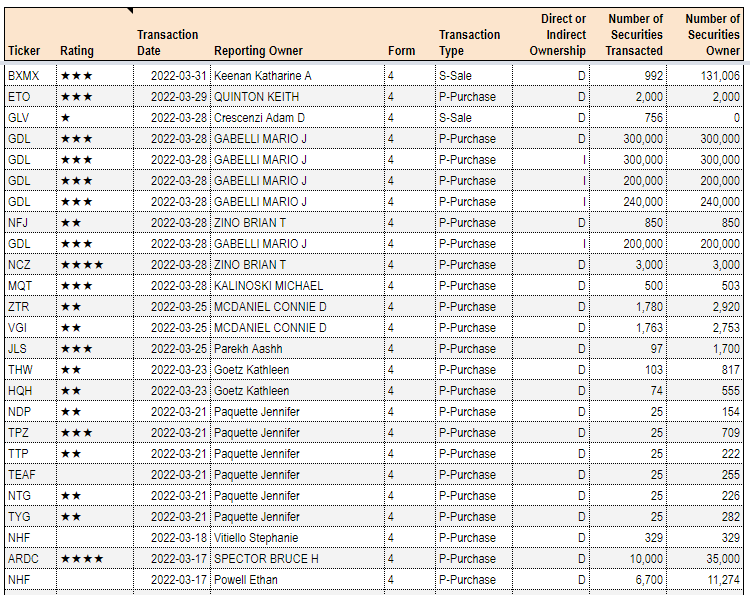
NCZ has been on a wild ride this year given its high-beta profile and growth focus due to its convertible exposure. The fund is down about 10% in total NAV terms over the past year roughly in line with the Converts sector and a bit worse than Multi-sector where we have it now (along with NCV). It’s still a decent way in our view to add a bit of equity flavor into the portfolio without totally giving up on yield (pure convertible and equity CEFs typically have NAV NII yield of around 1% or so and some have negative yields)
A subscriber brought up the Vertical Capital Income Fund (VCIF) – a CEF allocated to non-agency whole loans. There is not a ton of non-agency CEFs outside of (PCM) and (DMO) with a smattering of non-agency allocations in (JLS) and other PIMCO taxable funds. What’s odd is that the fund carries almost no leverage – not clear why they are doing that and whether it’s structural or tactical. It does kind of defeat the purpose of a CEF though. This also likely contributes to the fund’s not super impressive returns of something like 3.2% and 3.9% CAGR over the last 3-5 years in total NAV terms.
The allocation profile of the fund seems to match some of the hybrid mREITs like CIM or NYMT. So, if that’s right, then holding a CIM or NYMT preferred is much more attractive. These preferreds have 1) pretty strong equity / preferred coverage and 2) have delivered something on the order of 2x the historic returns of VCIF (simply by virtue of their prices being pretty resilient and their coupons being relatively high). And keep in mind that while the discount of VCIF is pretty wide – 1) it doesn’t actually fully offset the fund’s management fee and 2) the preferreds have no management fees to take out of their yields – they get common shareholders to pay all their fees.
The John Hancock preferreds CEFs released their shareholder reports. These funds are interesting as they have a different flavor to the rest of the preferreds sector which are mostly focused on investment-grade rated financial issuers. For example, the Preferred Income Fund (HPI) only has 23% in financial preferreds versus 80% for FFC (other sector CEFs have similarly high numbers). Unlike the rest of the sector the JH funds also have allocations to corporate bonds and common stocks. This is one reason why they have held up better than the rest of the sector year-to-date. HPI coverage is about 94% and NII has been pretty steady for about 3 years. This will almost certainly move lower – the fund does have a hedge in place for about 30% of its credit facility so the drag will not be as high as that for the Flaherty funds. These funds are worth a look if you find yourself in an undiversified set of financials-heavy preferreds CEFs. They don’t screen as particularly cheap at the moment but they do often offer relative value opportunities as the three funds have pretty similar allocations.
A subscriber asked if we consider the Cohen & Steers REIT and Preferred Income Fund (RNP) a decent income option. The fund holds roughly half in common stocks and half in preferreds. We’re probably too old school but a fund with a NII price yield of 2.78% doesn’t really feel like an income play. A sub-3% dividend yield is not that far from the dividend yield on stocks. A good thought experiment to do in order to cut through some of the smoke-and-mirrors of heavy-equity allocation funds is whether you would buy a CEF that only held the S&P 500 but had a distribution rate of 10%. We’d expect a long series of glowing reviews of what a terrific income option such a fund was. In our view, wrapping a bunch of stocks in a CEF and paying out 2-3x the underlying income level doesn’t turn a non-income asset into an income asset.
Stance And Takeaways
We made a couple of small portfolio changes in the Muni Income Portfolio – rotating from drier-powder ETF holdings into the Nuveen Municipal Credit Income Fund (NZF). Muni ETFs have typically held up much better than the CEFs due to the lack of discount dynamic and lack of leverage. At the time of the rotation NZF was trading at a very attractive high single-digit discount level (cheaper than the sector average) which has, annoyingly, quickly tightened to a 4% level – now richer than the sector average. NZF is a fund worth watching – its high-yield muni allocation gives it a shorter-duration profile and a higher internal income yield. The fund has outperformed the sector by a massive 1.7% per annum in total NAV terms over the past 5 years but flies somewhat under the radar.
In the last few weeks we marginally increased our CEF allocation in response to a much more attractive valuation environment than the one that prevailed through the second half of last year. Given the recent rally we don’t feel the need to chase CEFs and would rather look to add on further weakness.
Higher interest-rates remain a key risk for the market, particularly if the Fed continues with its incremental single-hike approach through the rest of the year. We continue to like a barbell allocation profile across higher-quality longer-duration sectors which take advantage of the recent back-up in Treasury yields without taking on a significant amount of credit risk along with lower-duration floating-rate sectors like non-agency MBS, ABS and loans.
In the tax-exempt space we like the Nuveen Quality Municipal Income Fund (NAD) and the BNY Mellon Strategic Municipals (LEO). In the credit space, we continue to like the Apollo Tactical Income Fund (AIF), trading at a 7% current yield and a 9.6% discount.
Be the first to comment