

Darren415
This article was first released to Systematic Income subscribers and free trials on Aug. 13.
Welcome to another installment of our CEF Market Weekly Review where we discuss CEF market activity from both the bottom-up – highlighting individual fund news and events – as well as top-down – providing an overview of the broader market. We also try to provide some historical context as well as the relevant themes that look to be driving markets or that investors ought to be mindful of.
This update covers the period through the second week of August. Be sure to check out our other weekly updates covering the BDC as well as the preferreds/baby bond markets for perspectives across the broader income space.
Market Action
All CEF sectors were up on the week with strong gains across both NAVs and discounts.
Most sectors remain more than 10% down on the year with the worst performers being EM, convertible and Muni sectors.
Systematic Income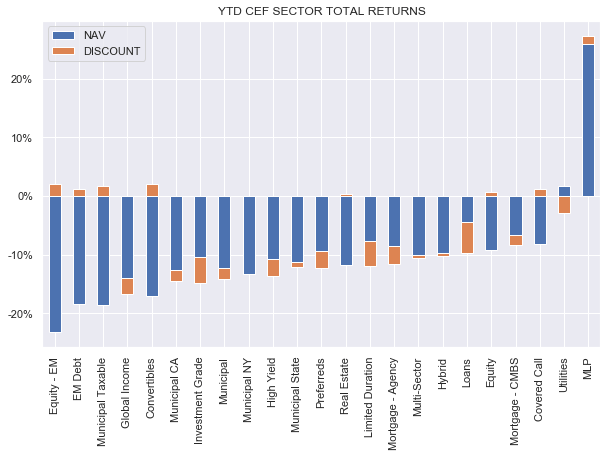
The CEF market has clawed back more than half of its drop year-to-date.
Systematic Income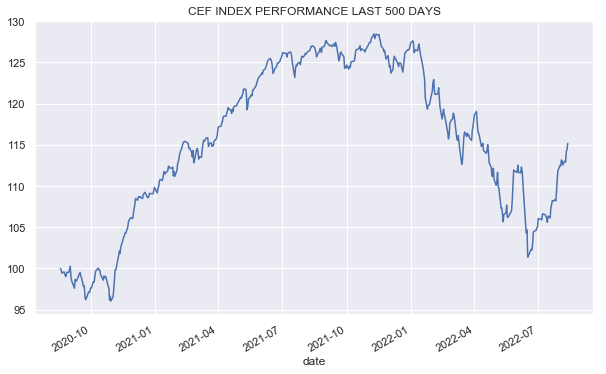
The average CEF sector discount has nearly reached its pre-COVID level. Given the trend in leading indicators, we view the market as somewhat expensive at the moment.
Systematic Income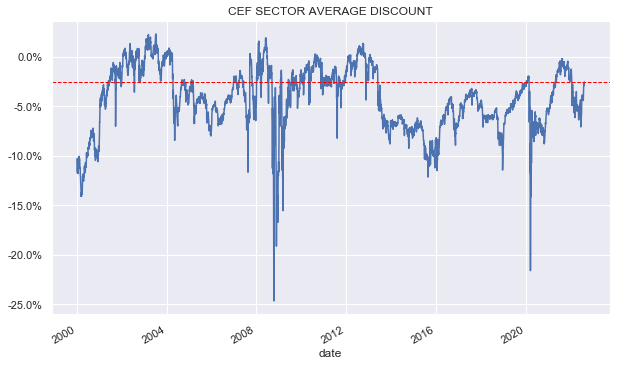
Market Themes
We had a very topical discussion on the service comparing closed-end fund and open-end fund yields. At the heart of it lies the question why is that a highly-leveraged CEF Nuveen Municipal Credit Income Fund (NZF) has a yield of 5.1% while the unleveraged SPDR Nuveen Bloomberg High Yield Municipal Bond ETF (HYMB) has a yield of 4.6%. Both funds can be described as high-yield municipal bond funds, so why does the additional leverage of NZF generate only 0.5% of extra yield? After all, the 41% of NZF leverage means the fund holds $169 for every $100 of assets that ORNAX holds but passes on only 113% of the HYMB yield.
To gauge the difference in CEF vs. OEF yields, we need to first make sure we are doing an apples-to-apples comparison. Specifically, although the two funds can arguably be called high-yield municipal bond funds, their allocations with respect to credit rating and duration are different. Plus, their distribution yields are not necessarily reflective of their actual weighted-average yield-to-worst which is what we are really after.
So, rather than go top down by looking at the actual features of the two funds, let’s go bottom up instead by bootstrapping the yields of these two types of funds. We start with a yield-to-worst of 4.5%, which is what we get from the BlackRock High Yield Municipal Fund (MAYHX). The reason we use this fund is because BlackRock (BLK) is one of the few managers who actually disclose the yield-to-worst of their funds. This 4.5% number is below the 4.95% yield of the S&P Municipal Bond High Yield Index because “High Yield” Muni bond funds often have a big chunk of investment-grade bonds. We also use a 0.6% management fee as that is the sweet spot of the CEF market. Finally, we use a 2% leverage cost, which corresponds to both the number disclosed by Nuveen funds and is roughly in line with the SIFMA + (0.3-0.6%) leverage cost range of Muni CEFs. SIFMA itself will tend to run at roughly 2/3 x short-term rates as it’s a tax-free interest rate.
Using these figures, we get the following picture. In the current environment, a HY Muni CEF will be able to generate something like a 5.2% yield while an open-end fund will be able to generate a yield closer to 3.9%. In short, the CEF can drive a 1.3% higher-yield or one that is about a third higher.
Systematic Income CEF Tool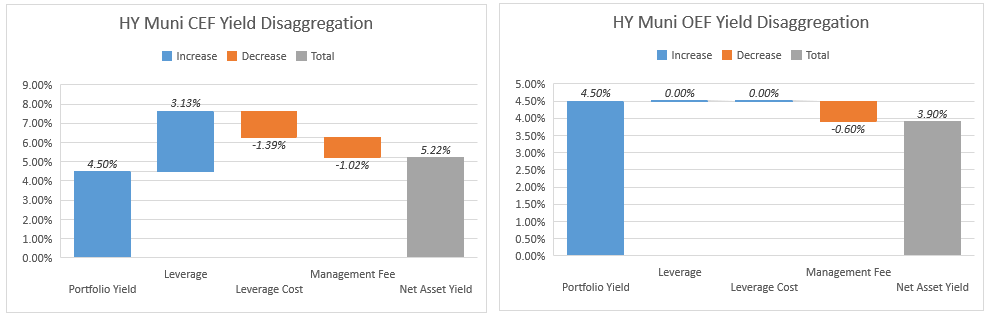
Now, let’s take a look at what happens when short-term rates are at the Fed’s consensus Fed Funds peak of 3.75%. At that point, the CEF will only be able to drive a 0.7% higher fee for the simple reason that its leverage cost will increase.
Systematic Income CEF Tool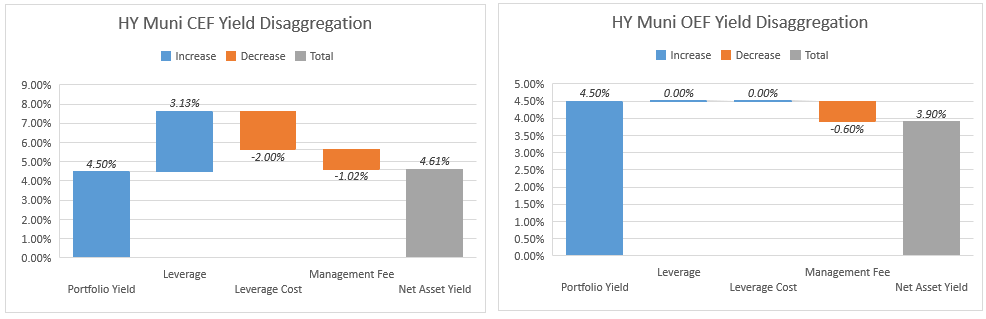
Now imagine we keep Fed Funds at their peak but have longer-term rates fall by 1% from their current levels with high-yield muni bond yields falling to 3.5% from 4.5% today. At that point, the two funds will generate pretty much the same yield of 2.9%. From an income perspective, this scenario makes holding CEFs fairly unappealing as they would generate no additional yield for investors over open-end funds despite having much higher leverage.
Systematic Income CEF Tool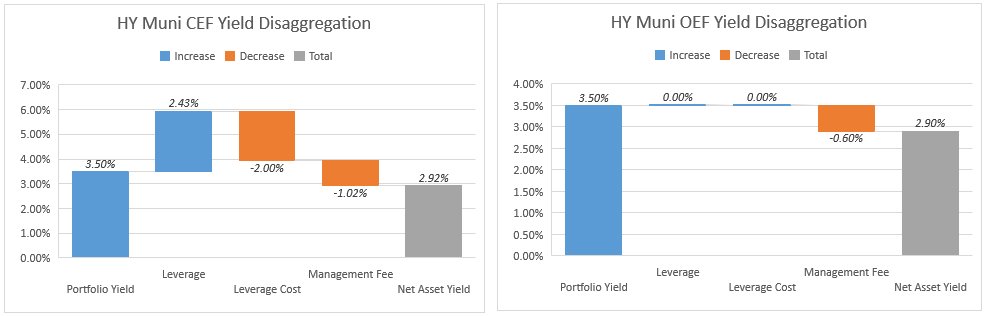
Note that we are not looking at the impact of discounts which can allow CEFs to further magnify the level of yield they can generate over and above that of open-end funds which don’t tend to trade at discounts (certainly not mutual funds).
All in all, this example reiterates our long-standing point that CEFs are much more attractive versus open-end funds when underlying yields are high, leverage costs are low and discounts are wide. Once these metrics become unfavorable as they easily could over the next year, investors will need to think hard about whether they want to continue holding CEFs for very little additional yield or whether they should consider rotating into open-end funds.
Clearly, the lesson of 2021 was that open-end funds held in much better than CEFs and investors with open-end fund positions were able to rotate them into CEFs to generate a significant amount of alpha in their portfolios.
Market Commentary
There were a number of distribution increases in floating-rate CEFs. CLO debt and equity fund EIC increased the distribution by 12% from $0.125 to $0.14. The cross-credit fund ARDC also increased its distribution by 5%. The multi-sector fund WDI increased the distribution earlier in the month by 4% – the second increase this year. We continue holding WDI and ARDC in our Income Portfolios.
The distributions of funds with floating-rate exposure should keep moving higher over the rest of the year as little of the recent rise in short-term rates actually made it into the fund income figures. To use an illustrative example, a fund with 3-month LIBOR accrual periods matching calendar quarters (to keep things simple) accrued its Q2 cashflows at a LIBOR of about 1%. Today LIBOR is 2.9% – quite a bit higher. This gap will take some time to show up in income figures.
Abrdn is acquiring 4 Delaware CEFs, contingent on shareholder approval. IVH will merge into ACP, DEX and DDF into AGD and MGU into ASGI. The two credit funds IVH and ACP are interesting. The annual performance differential over the last 5 years in total NAV terms between the two funds is 4.2% with ACP at -1.7% and IVH at 2.5%. ACP is the worst-performing HY CEF in the sector by a country mile – it’s the only one that has a negative 5Y total NAV return. The fact that ACP trades at a premium of 13% (due to its over-inflated yield of 13.9%) – a valuation that is 16% higher than the average HY CEF – just goes to show how silly the CEF market can be.
The two Virtus convertible/HY funds NCZ and NCV are getting a new sub-adviser. AllianzGI is out due to a previous settlement with the SEC which doesn’t allow it to continue managing US funds. The new sub-adviser will be Voya and the current fund managers will move over to Voya and keep running the fund. Voya is not exactly a big-time CEF manager. Recall that BRW, under a different name, used to be a Voya managed loan fund and it didn’t do very well and was taken over by Saba which turned it into a SPAC fund. It’s not clear if the funds’ strategy will change a whole lot – it could easily keep going as it was, so this could be a nothingburger.
Stance and Takeaways
This year we have positioned in a way so as to take advantage of the evolving CEF market environment. This involves holding a decent amount of floating-rate funds such as WDI and ARDC, which have enjoyed income gains year-to-date and have already raised distributions. Secondly, we hold funds with leverage cost hedges such as PTA. Thirdly, we hold a number of term CEFs whose potential termination / tender offer provides an anchor to the discount such as JPI and IHTA. And fourth, we hold funds with some valuation margin of safety such as PAXS and AIF. These allocation themes should continue to work in the current market environment.
Be the first to comment