

da-kuk/E+ via Getty Images
This article was first released to Systematic Income subscribers and free trials on Jan. 2.
Welcome to another installment of our CEF Market Weekly Review where we discuss CEF market activity from both the bottom-up – highlighting individual fund news and events – as well as top-down – providing an overview of the broader market. We also try to provide some historical context as well as the relevant themes that look to be driving markets or that investors ought to be mindful of. This update covers the period through the last week of 2021.
Be sure to check out our other weekly updates covering the BDC as well as the preferreds / baby bond markets for perspectives across the broader income space.
Market Overview
A Santa Rally is the tendency of stocks to rise in the last week of December and the first two trading days of the year. So far the Santa Rally is going according to plan in the CEF space.
The last two weeks delivered strong gains of about 1% each across CEFs with December largely offsetting poor November CEF returns.
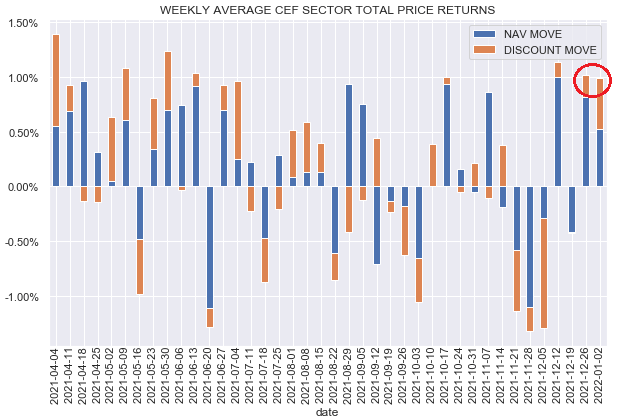
Source: Systematic Income
On a monthly basis, the CEF market has see-sawed between gains and losses in the second half of the year, delivering broadly flat returns.
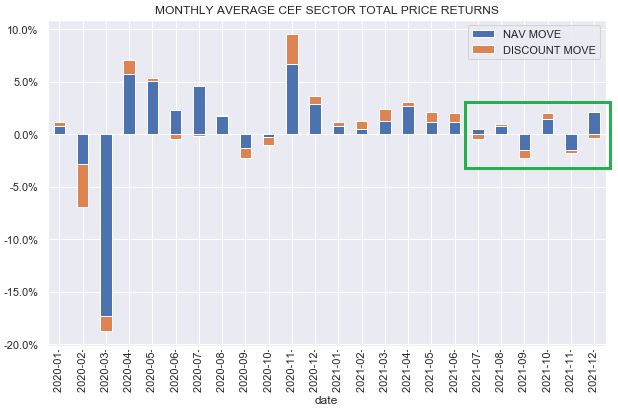
Source: Systematic Income
This “fat and flat” pattern is our base case for 2022 as well given the relative richness of valuations in underlying yields as well as discounts.
Discounts bounced back in December as part of the Santa Rally; however, they remain in a downtrend over the last 4 months or so since hitting their peaks.
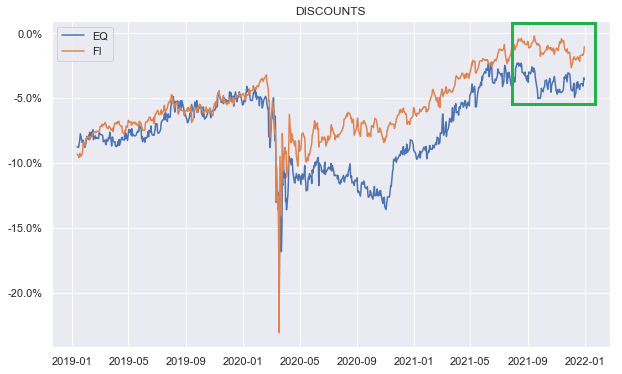
Source: Systematic Income
In terms of individual sectors, there are only 3 sectors trading at negative 5-year z-scores with the average metric being around 1.4 (meaning the average sector discount is around 1.4 standard deviation above its 5-year discount average).
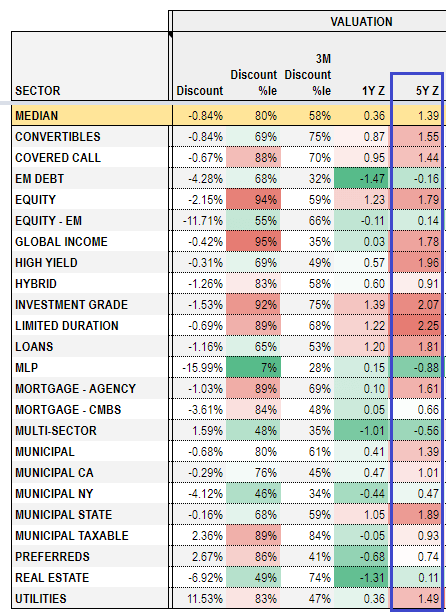
Source: Systematic Income
Unfortunately, in each case the negative 5-year z-score does not present an obvious opportunity, in our view.
In the case of the MLP index, it has gone through repeated bouts of deleveraging due to the high volatility of its underlying holdings and sports a negative total NAV return over the last 5 and 10 years despite a 40% rally this year.
The EM Debt sector 5-year z-score is negative largely due to the collapse of two of its funds from continued distribution cuts and poor returns as the chart below illustrates.
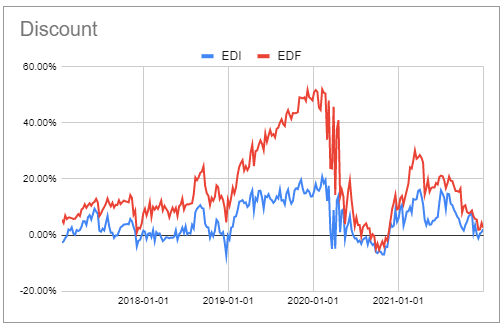
Source: Systematic Income CEF Tool
Finally, the Multi-sector CEF space 5-year z-score is negative largely due to the premium compression in a number of PIMCO funds also from continued distribution cuts (three cuts in each of the last three years). Those funds that made distribution cuts, such as the three funds in the chart below, have arguably reset to a new low fair-value and their lower premiums do not present obvious opportunities.
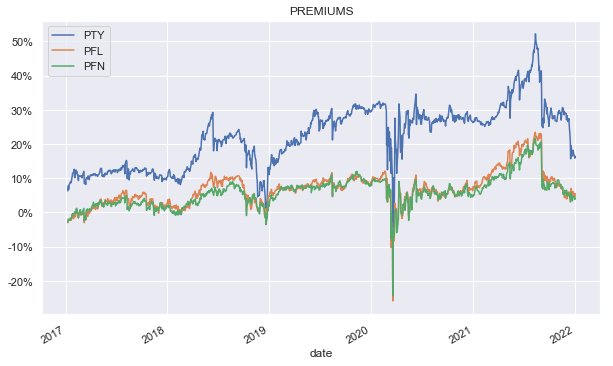
Source: Systematic Income
In short, a number of sectors may appear more attractively valued than they are in reality. This means investors need to go past the optics to find attractive opportunities (which do exist) however these opportunities are less frequent and faster-moving in the current richly valued market.
Market Themes
With the calendar year behind us, investors will soon turn their attention to completing their tax returns. It’s a short step from completing tax returns to wondering how to position a portfolio in a more tax-efficient way. There are a few points worth noting for investors looking to improve the tax efficiency of their CEF holdings.
First, this is not an issue for all investors as many investors run their CEF portfolios primarily in tax-sheltered accounts such as an IRA. Investors with both taxable and tax-sheltered accounts will split their allocations so as to run tax-efficient CEFs in taxable accounts and tax-inefficient CEFs in tax-sheltered accounts.
Secondly, what are generally regarded as tax-inefficient and tax-efficient or tax-exempt CEFs will rarely be 100% one or the other. For instance, tax-inefficient CEFs will often have relatively some efficient distributions in the form of long-term capital gains or tax-exempt distributions in the form of return of capital. And some tax-exempt funds will make some distributions that are not tax-exempt (such as from capital gains) and so will not be 100% tax-exempt.
Thirdly, CEFs within the same sectors can have different tax distribution characteristics so investors should not assume they will get the same treatment across all funds in the same sector.
Fourthly, from a tax perspective, investors’ actions can count as much, if not more, than the tax-efficiency of CEF distributions. For example, an investor can easily accrue tax-inefficient short-term capital gains in a tax-exempt fund by selling a position held less than a year above its cost basis. In other words, CEF tax efficiency tends to refer only to the make-up of CEF distributions and investors can easily overlook the tax impact of their own actions, particularly, in a relatively strong year such as the one we had in 2021.
Finally, investors should make a distinction between federal and state-level taxes, particularly, for municipal bonds some of which may not be exempt from state taxes.
Turning to CEF sectors themselves, tax-exempt sectors such as tax-exempt municipal sectors are typically exempt from federal taxes and bonds issued by the investor’s home state are also typically exempt from state taxes. Capital gains, whether actioned by the investor or the fund itself, will not be exempt from tax in a taxable account. Taxable munis are not exempt from federal taxes, but may be exempt from state and local taxes. Finally, some munis are subject to the alternative minimum tax and there is always a small risk of bonds issued as tax-exempt to end up being taxed if the IRS revokes the tax-exempt status.
Investors should also have a quick glance at their larger tax-exempt fund holdings to make sure historic tax treatment aligns with their expectations. For example, the RiverNorth Opportunistic Municipal Income Fund (RMI) shows the following tax basis. Ordinary income made up a quarter of all income distributions for the 2021 fiscal year and 42% for the 2020 fiscal year – those kinds of numbers may not be what investors signed up for when they bought a “tax-exempt” fund.
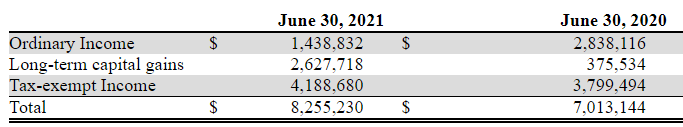
Source: Shareholder Report
Covered call and MLP CEFs tend to have return of capital as a large portion of their returns which makes them relatively attractive holds in taxable accounts. However, it’s important to realize that covered call distributions can vary significantly as the following covered call CEF 2021 tax-summary table shows.
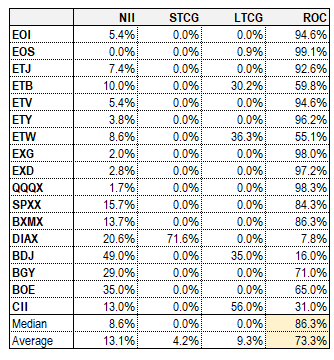
Source: Systematic Income, Fund websites
Some MLP CEFs also hold bonds which would make ordinary income distributions. While return of capital has no immediate tax implications, it does lead to a step-down in cost basis which could lead to a capital gain impact down the line when the fund is sold.
Equity CEFs will tend to make QDI distributions which are relatively tax-efficient, having the same treatment as long-term capital gains, being taxed at a maximum rate of 23.8%. Preferred CEFs will also mostly make QDI distributions though investors have to be aware that not all preferreds qualify for QDI such as those in the REIT sector instance. REIT preferreds do benefit from a separate 20% deduction on pass-through income and so it is more efficient than ordinary income.
Most credit CEFs such as those that allocate to corporate bonds and loans will distribute primarily ordinary income which can be inefficient for those in higher tax brackets in taxable accounts.
It’s important to keep in mind that these are all just rules of thumb and an investors need to do their own due diligence in building a tax-efficient portfolio.
Market Commentary
A few funds with annually reset managed distribution policies will update their distributions in the next year. For example, the RiverNorth/DoubleLine Strategic Opportunity Fund (OPP) will likely see its distribution downshift by about 7% from $0.1586 to $0.1478 as it sets the distribution based on its NAV as of the last 5 trading days. As the fund continues to overdistribute, we should expect its distribution to continue to shift lower over time due to the drag on its NAV.
This week we closed out our tactical idea in the CLO equity focused OFS Credit Co. (OCCI). The fund’s discount widened over November relative to the other two sector funds: OXLC and ECC. This divergence didn’t make a ton of sense to us and we suggested going long OCCI into the year-end. This divergence has now converged even quicker than it diverged, delivering a nice 10% return over a couple of weeks. At its current valuation, we see much less value in staying long OCCI.
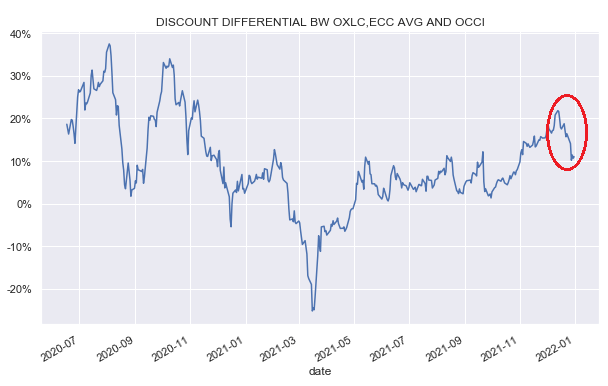
Source: Systematic Income
We also added a new Tactical Idea which was a JPI vs. PTA switch. The discounts between the two funds moved to an extreme 10% differential.
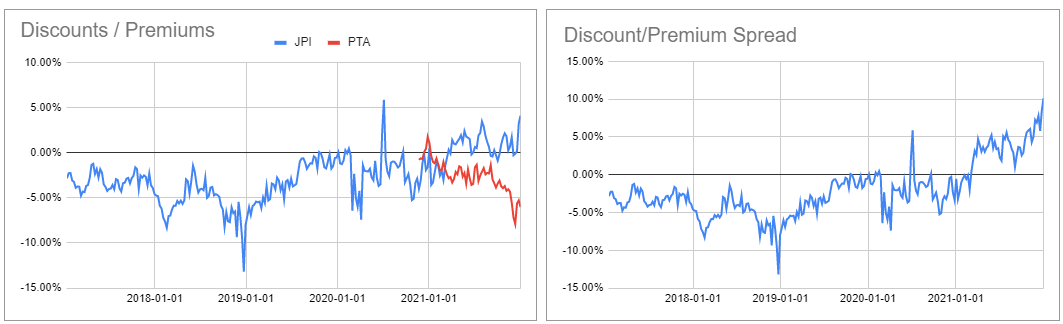
Source: Systematic Income CEF Tool
Both funds feature strong discount anchors which should cause this move to reverse. The 4% premium of JPI creates a large tailwind into its 2024 potential termination of a 1.5% drag per annum. This is why it is unusual to find term funds trading at a significant premium.
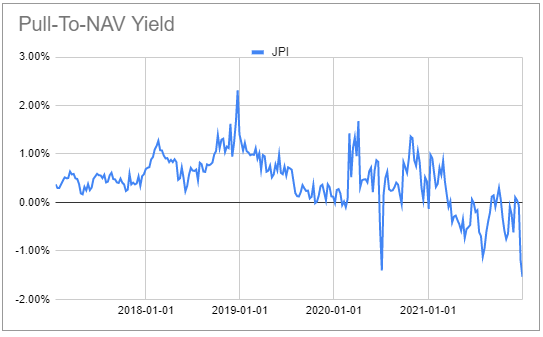
Source: Systematic Income CEF Tool
JPI has also rarely traded at a tighter discount than the sector average.
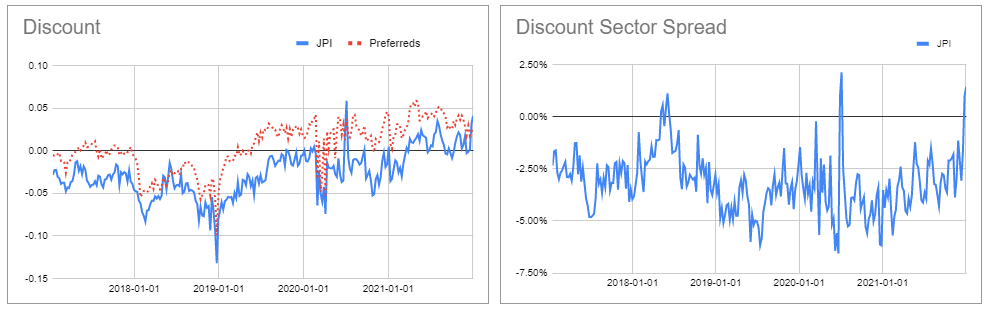
Source: Systematic Income CEF Tool
PTA was a likely victim of tax-loss selling in 2021 which pushed its discount much wider than the sector average. The fund is the most recently launched CEF from Cohen & Steers and provides much of the same exposure and historic total NAV return as these two other preferreds funds. These 2 funds are trading at around 4% premiums and while PTA does have a slightly higher fee, its discount widening appears largely technical and we expect it to move closer to the valuation of its 2 sister funds.
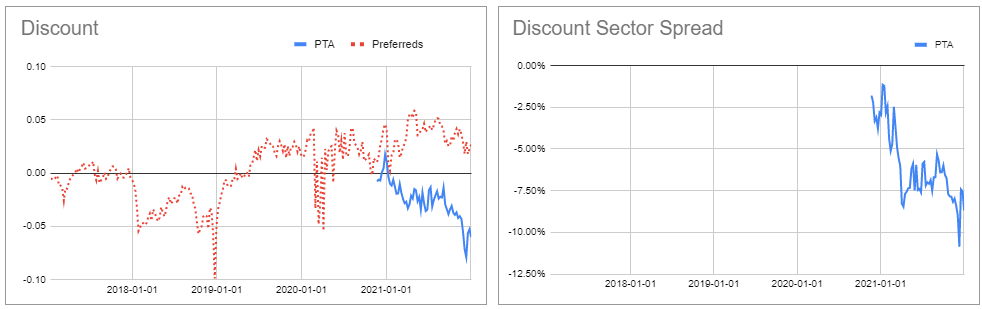
Source: Systematic Income CEF Tool
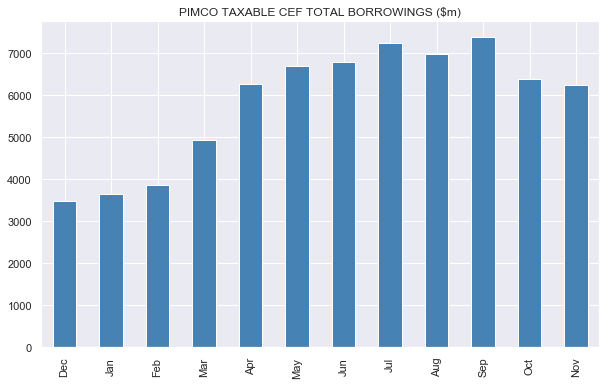
Updated leverage figures were released by a number of CEF managers. PIMCO borrowing numbers fell slightly from October levels with PDO and PHK responsible for the bulk of the drop with PGP significantly increasing borrowings by about 15%.
Source: Systematic Income CEF Tool
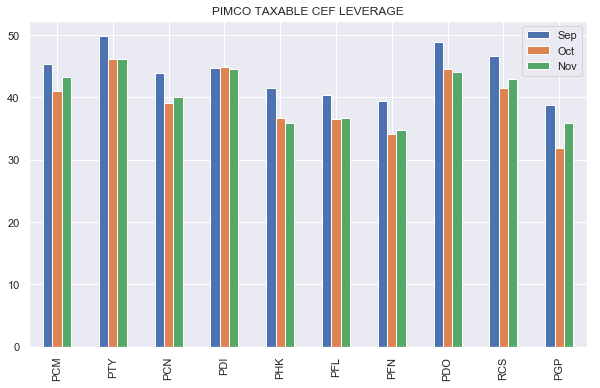
PIMCO taxable leverage levels were also broadly stable with RCS and PGP increasing leverage levels marginally. For RCS the increase in leverage was caused by the drop in the NAV by close to 3% while the leverage increase in PGP was driven by its increase in borrowings.
Source: Systematic Income CEF Tool
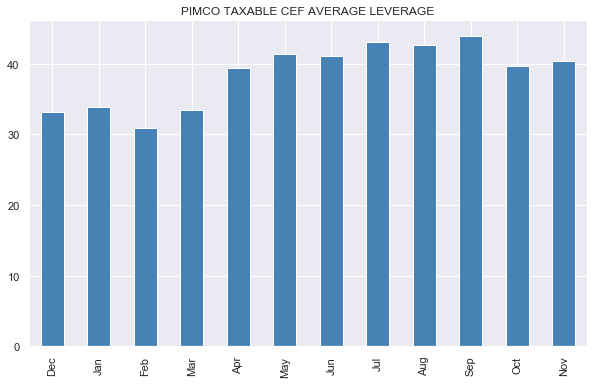
The average PIMCO taxable leverage remains below the levels of May-Nov, potentially giving the funds a bit more room to maneuver if we see a drawdown in fixed income.
Source: Systematic Income
Stance And Takeaways
The decent bounceback we saw in December means that the broader CEF space is further on the richer side of the valuations spectrum. Our credit CEF swirlogram, which captures the evolution of the key dimensions of CEF valuations over the last 3 years of both credit spreads and discounts, shows that we remain locked in the expensive upper left quadrant. It is very interesting to see that even the pre-COVID environment of Jan-2020 was significantly more attractive than the current environment with both wider discounts (by about 1.2%) and wider credit spreads (by about 1%).
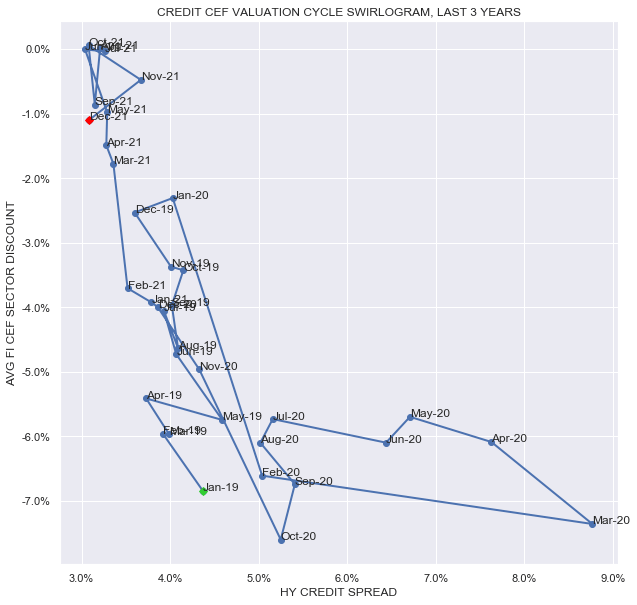
Source: Systematic Income
In the broader CEF space, the PIMCO Dynamic Income Opportunities Fund (PDO) remains attractive at a sub-1% premium.
For investors with a more speculative bent, the recently launched Western Asset Diversified Income Fund (WDI) that allocates across different fixed-income sectors, looks interesting with a 6.8% discount and a 7.67% current yield. The fund’s term structure with an expected 2033 termination is a plus as it may provide an anchor to the fund’s discount. At the same time we wouldn’t necessarily count on the fund actually terminating as another Western Asset fund simply turned itself into a perpetual fund with a shareholder vote.
The fund is most highly correlated to the PIMCO Corporate & Income Strategy Fund (PCN). The total NAV return chart below shows that WDI looks to be a lower beta version of PCN. Some of this is due to the fund’s lower leverage level (which appears to be 24% vs. 35-45% levels for the PIMCO funds), and likely lower-beta assets as well. The fund has a duration of about 3.4 which is about that of the PIMCO taxable funds.
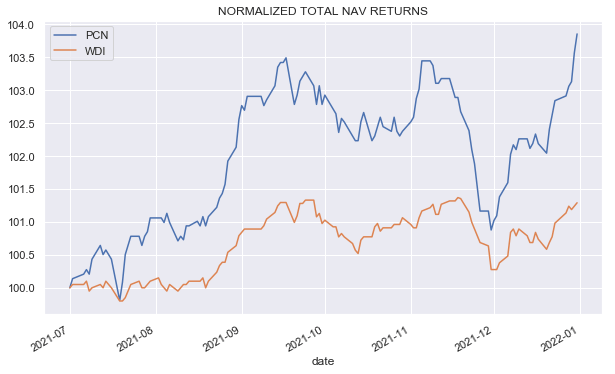
Source: Systematic Income
Be the first to comment