

PercyAlban/iStock Unreleased via Getty Images
VictoryShares US Large Cap High Div Volatility Wtd ETF (NASDAQ:CDL), a $494 million fund with a dividend yield of ~2.65%, is yet another volatility-weighted investment vehicle I would like to discuss today.
This year, the VictoryShares US Small Cap High Div Volatility Wtd ETF (CSB), its peer focused on the small-cap echelon of the U.S. market that we have reviewed just recently, has illustrated how factor investing could go wrong, despite supportive market sentiment that provided a seemingly perfect background for the value rally. At the same time, CDL’s rather successful 2022 to date might explain why CSB has underperformed, i.e., what essential elements its strategy lacked.
But is the ETF a Buy only because it has been performing strongly this year (and in 2021) and because its strategy has an ingredient that CSB missed? The answer cannot be given immediately. As usual, there are numerous nuances to assess, including its valuation, yield, portfolio quality, and returns over longer timeframes. So let us dig in.
Basics of the investment strategy and the portfolio
CDL’s investment strategy is almost identical to the one CSB has, with the key difference being the size factor.
The fund tracks the Nasdaq Victory US Large Cap High Dividend 100 Volatility Weighted Index, which is focused on U.S. heavyweight names with value and quality characteristics. As a rule, larger companies are more financially viable, mostly with competitive advantages, and, hence, more stable dividend (growth) stories.
It should be noted that the current iteration of the CDL portfolio has rather modest exposure to mega-caps (market values over $100 billion), ~22%, as of my calculations, with the bulk of the net assets deployed to large-size companies (no less than $10 billion market caps). The primary reason is unconventional, smart-beta weighting that somewhat eliminates the flaws of the traditional, market-cap-based approach.
Thanks to the large-size factor, the quality of the CDL portfolio, which we will be discussing shortly, is no surprise. Additionally, a candidate for inclusion in the index must deliver profits over the previous twelve months; this is yet another tailwind for quality.
The selection pool is the Nasdaq Victory US Large Cap 500 Volatility Weighted Index. 100 stocks with the highest yields amongst those that met the initial criteria are selected. The portfolio is rebuilt biannually, in March and September. Constituents with the lowest “standard deviation (volatility) of daily price changes over the last 180 trading days” are overweighted, and those with higher volatility see their weights reduced; the 25% sector cap is also implemented.
As of April 17, CDL was long 100 stocks; futures and other types of securities were also present in the portfolio. As I said above, its equity basket is composed principally of large-caps, though two companies that technically can be classified as mid-caps can also be spotted, namely Whirlpool (WHR) and Webster Financial (WBS). Both have market values marginally below $10 billion.
Johnson & Johnson (JNJ), an around $473 billion healthcare company, is the largest player in the mix; with ~1.56% of the net assets, this 2%-yielding stock with 59 years of consistent dividend increases is CDL’s third most significant investment. PepsiCo (PEP), another dividend aristocrat with a 49-year-long DPS growth story, occupies the first place, with a weight almost equal to JNJ’s, ~1.59%.
In terms of sectors, the fund has an allocation fairly typical for a fund with a low-volatility strategy as utilities, a sector deemed defensive, is in the first place, accounting for ~26.4% of the portfolio. For better context, the Invesco S&P 500 Low Volatility ETF (SPLV) is also enamored of utilities; they have around a quarter of its net assets.
It seems that stocks from this sector CDL has selected for the portfolio either appreciated in value from the March reconstitution, thus surpassing a 25% limit mentioned above, or other stocks have seen their prices creeping lower. I have quickly checked the Quant Momentum grades of utility stocks in the CDL portfolio, and it appeared that 17 out of 19 have at least a B- rating, which partly proves that the limit was likely breached because of their capital appreciation.
Financials are in second place with ~16.7%, followed by consumer staples with ~15%. It is worth noting that I have not found any REITs in the portfolio. Please also take notice that the CDL holdings dataset does not contain a sector column, so I paired it with the one from the iShares Russell 3000 ETF (IWV) to calculate the above-mentioned weights.
Regarding exposure to other factors, this VictoryShares ETF has a smaller allocation to value stocks (~34% with a B- Quant Valuation grade or better) than CSB that we have reviewed recently. Yes, it might look odd given CDL picks high-yielders, but this still perfectly makes sense. Larger companies tend to trade at a premium to their respective sectors, while the prices of smaller players reflect an appropriate discount. We also do not see anything spectacular in terms of growth, only ~12% allocation to names increasing their revenues, earnings, etc., faster than peers.
The quality factor and dividend credentials
Though CDL’s portfolio is much more expensive than CSB’s, it also has a much stronger quality. For example, the share of stocks with a Profitability grade of B- or better is close to 89%. CSB has just ~33%, too low for a dividend fund.
Next, a scatter plot illustrating EBITDA and cash flow margins (financials are removed; the chart covers ~82% of the holdings).
CDL holdings’ margins (Created by the author using data from Seeking Alpha and the fund) CSB holdings’ margins (Created by the author using data from Seeking Alpha and the fund)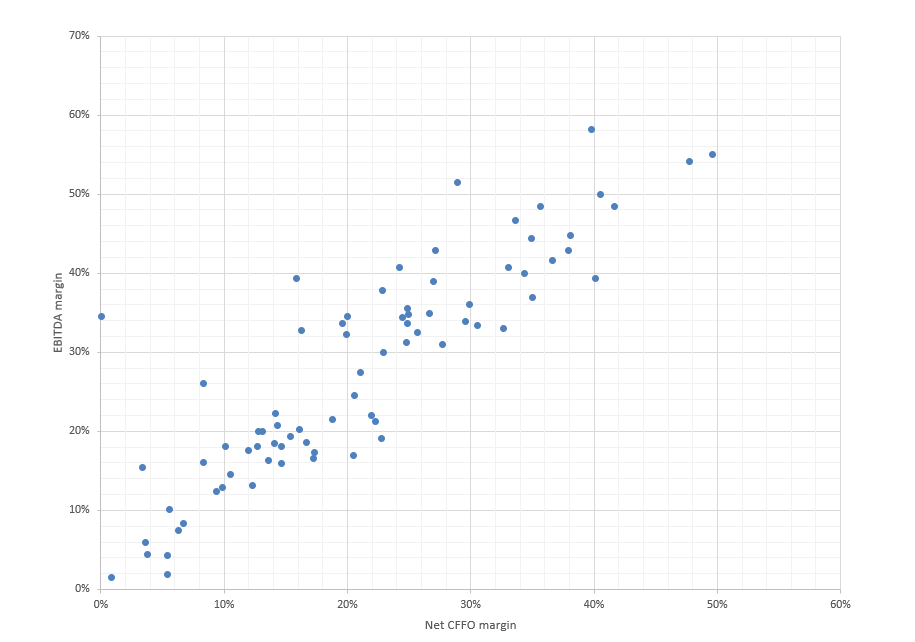
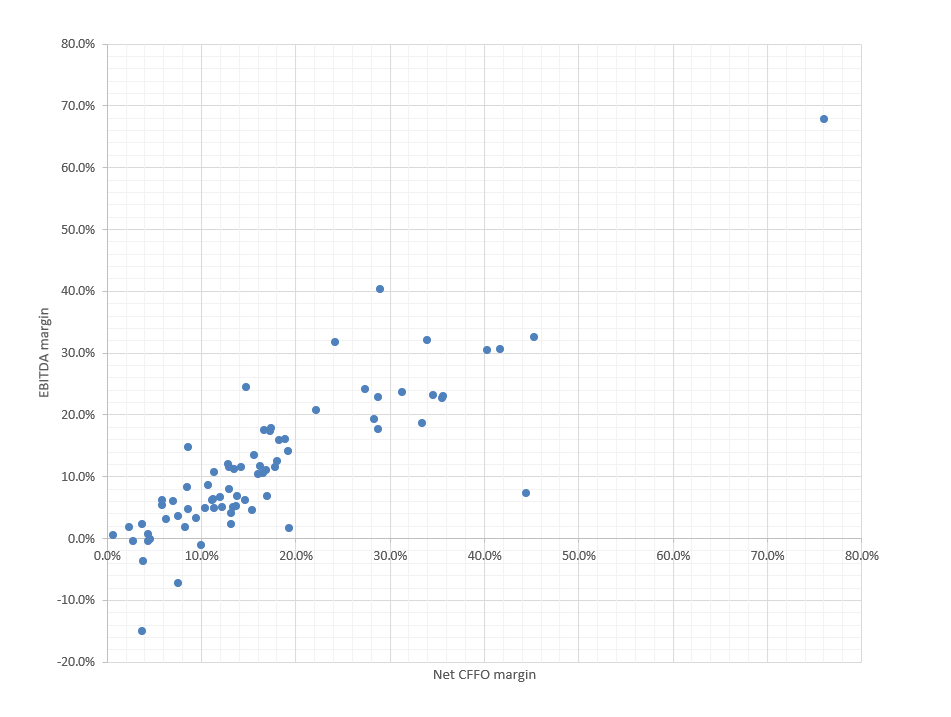
A bit better than the result of the CSB ETF since there are no EBITDA and cash flow negative companies in CDL. Additionally, I see that the 20%-40% net CFFO margin area is a bit denser (which bodes well for dividend sustainability).
The next chart series shows how the large-size factor can impact dividend growth stories.
CDL dividend credentials (Created by the author using data from Seeking Alpha and the fund) CSB dividend credentials (Created by the author using data from Seeking Alpha and the fund)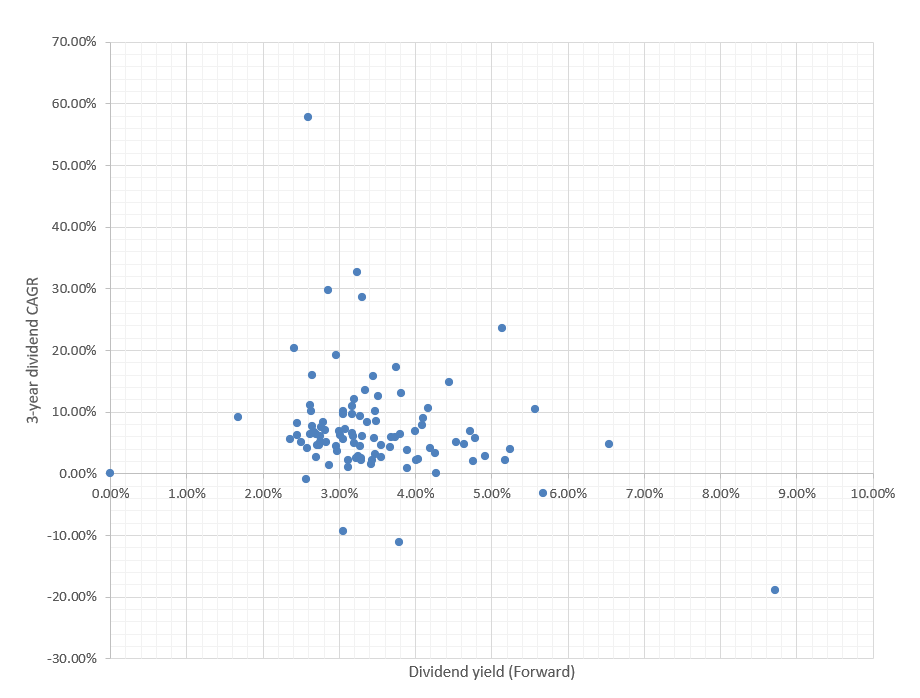
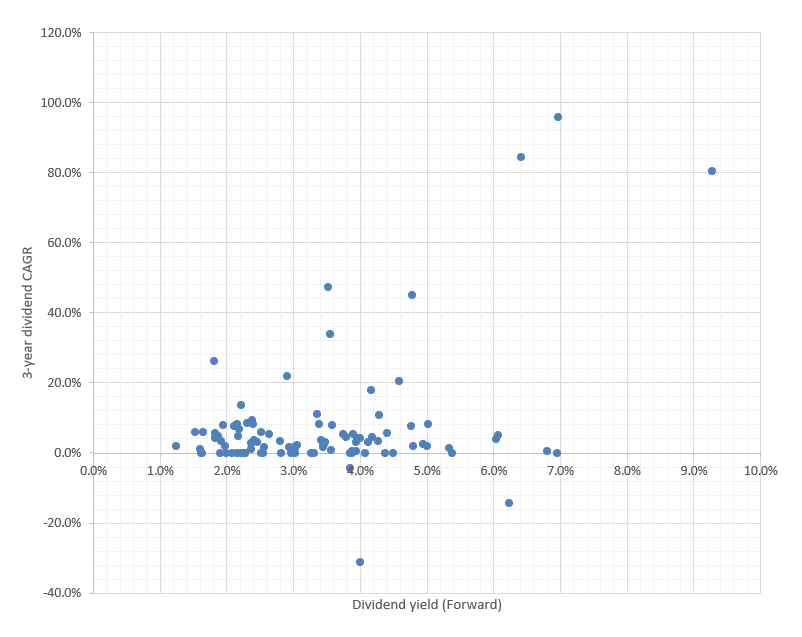
The differences can be spotted immediately. CSB is far behind in terms of the 3-year dividend CAGRs as it is more complicated for small-caps to increase payouts, and it has larger exposure to stocks with sub-2% yields (unfortunately, this is a bit counterintuitive, and I cannot find a plausible explanation for that).
Anyway, I would not say CDL has material exposure to truly generous dividend payers as only ~5.6% of its net assets are allocated to stocks with at least 5% yields, like Lumen Technologies (LUMN) with its 8.7% yield and Altria Group (MO) offering 6.5%.
It should also be noted that though its 5-year dividend CAGR (~8.3% vs. ~6.3% of CSB), likely because of the reasons we have just highlighted, the dividend yield is lower compared to the peer, ~2.7% vs. ~3%. Neither of the two is alluring enough.
Returns: recent outperformance bolstered by size, value factor combination
First, as I said above, CDL has outperformed the iShares Core S&P 500 ETF (IVV) this year, delivering a total return similar to the Invesco S&P 500 Pure Value ETF (RPV), which was added for better context. I suppose that is a consequence of the value, quality, and large-size factor combination.
Seeking Alpha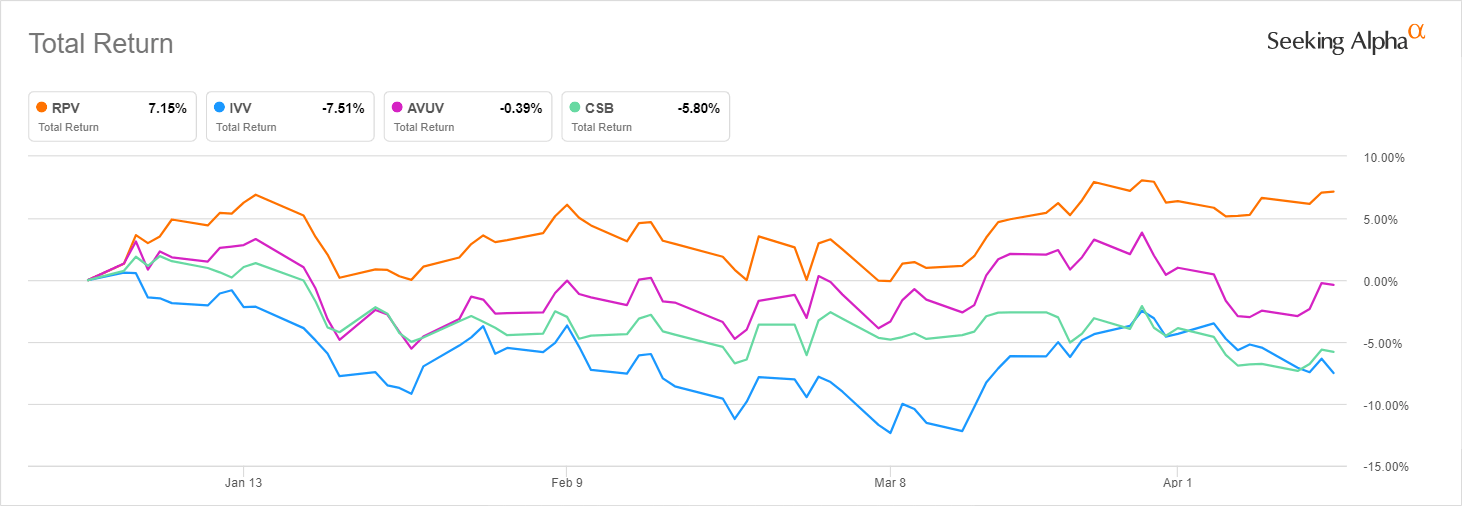
Speaking of larger timeframes, CDL’s strategy does not look especially capable. During the July 2015 – March 2022 period it not only underperformed the market but also had a higher standard deviation (was more volatile) and weaker Sharpe, Sortino ratios.
Created by the author using data from Portfolio Visualizer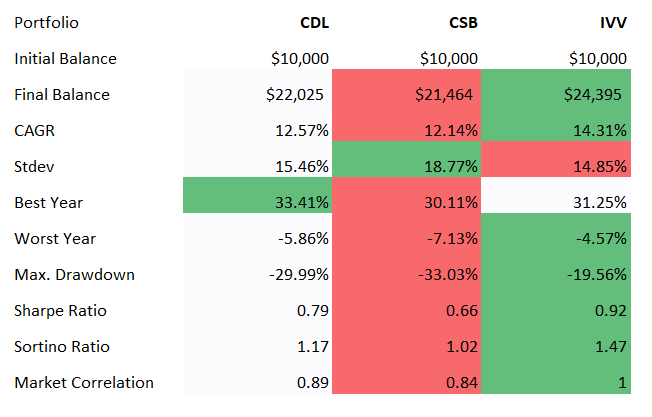
Final thoughts
The essential conclusions are as follows:
- CDL has outperformed IVV this year because of larger exposure to value stocks and CSB because of the quality, and size factors.
- CDL’s holdings are more expensive than CSB’s, principally because their prices incorporate a size premium.
- Large size correlates with stronger dividend growth stories as maintaining and increasing shareholder rewards is easier for heavyweight players; I believe this is partly supported by their lower cost of capital (valuations of smaller companies are impacted by a size discount, which reflects higher risks).
All in all, CDL is an adequately priced (a 35 bps expense ratio) smart-beta ETF, but the yield is not spectacular, while performance is mixed. I see no substantial reason to assign it a Buy rating.
Be the first to comment