

Kukurund/iStock Editorial via Getty Images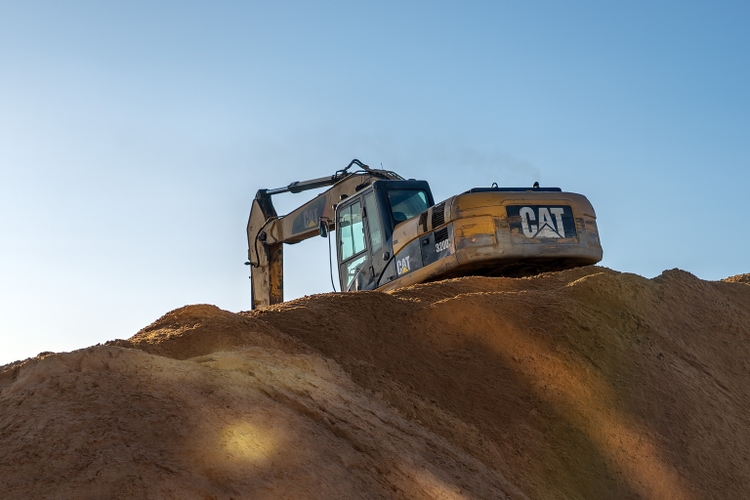
By Valuentum Analysts
Caterpillar Inc. (NYSE:CAT) is a Dividend Aristocrat, and the firm paid out a special dividend in 2012. The company’s machinery operations are tied to cyclical end market demand, which is impacted by changes in commodity prices, but its strategy when facing revenue declines is to manage costs such that the fall in operating profits is less than 30% of the drop in revenue. Though Caterpillar’s cash flow generation has been volatile in recent years, the company’s rolling free cash flow average has been more than sufficient in covering annual run rate cash dividend obligations. Lean manufacturing initiatives remain crucial through the course of the business cycle and helps support its Dividend Cushion ratio of 2. We explain how we calculate the Dividend Cushion ratio below. Shares yield ~2.8%.
Image Source: Valuentum. How we look at the key components of the Dividend Cushion ratio. (Image Source: Valuentum)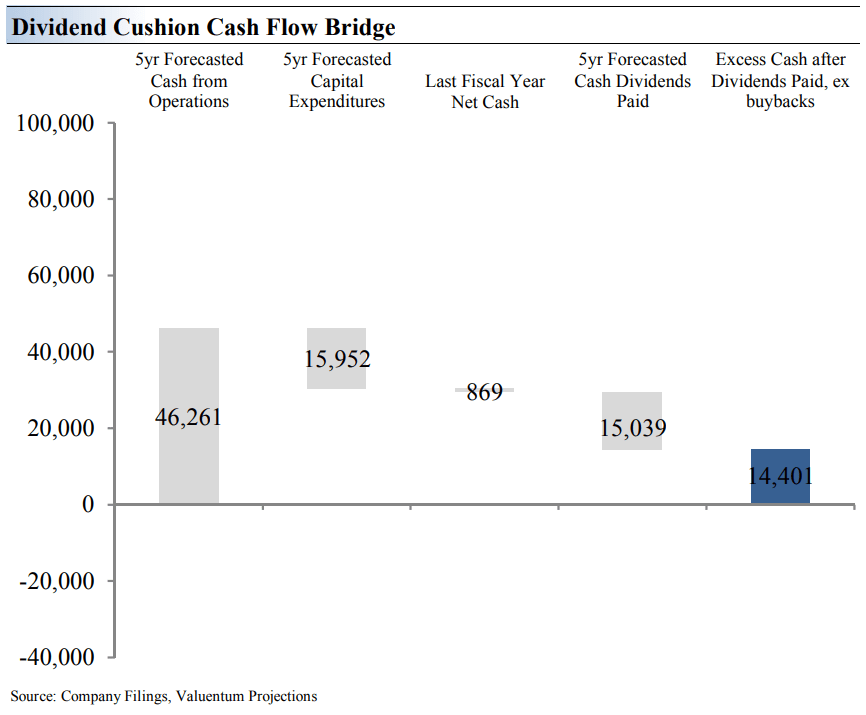
The Dividend Cushion Cash Flow Bridge, shown in the image above, illustrates the components of the Dividend Cushion ratio and highlights in detail the many drivers behind it. Caterpillar’s Dividend Cushion Cash Flow Bridge reveals that the sum of the company’s 5-year cumulative free cash flow generation, as measured by cash flow from operations less all capital spending, plus its net cash/debt position on the balance sheet, as of the last fiscal year, is greater than the sum of the next 5 years of expected cash dividends paid. Because the Dividend Cushion ratio is forward-looking and captures the trajectory of the company’s free cash flow generation and dividend growth, it reveals whether there will be a cash surplus or a cash shortfall at the end of the 5-year period, taking into consideration the leverage on the balance sheet, a key source of risk.
On a fundamental basis, we believe companies that have a strong net cash position on the balance sheet and are generating a significant amount of free cash flow are better able to pay and grow their dividend over time. Firms that are buried under a mountain of debt and do not sufficiently cover their dividend with free cash flow are more at risk of a dividend cut or a suspension of growth, all else equal, in our opinion. Generally speaking, the greater the “blue bar” to the right is in the positive (in the image above), the more durable a company’s dividend, and the greater the “blue bar” to the right is in the negative (in the image above), the less durable a company’s dividend.
Image Source: Valuentum. The numerator and the denominator of the Dividend Cushion ratio. (Image Source: Valuentum)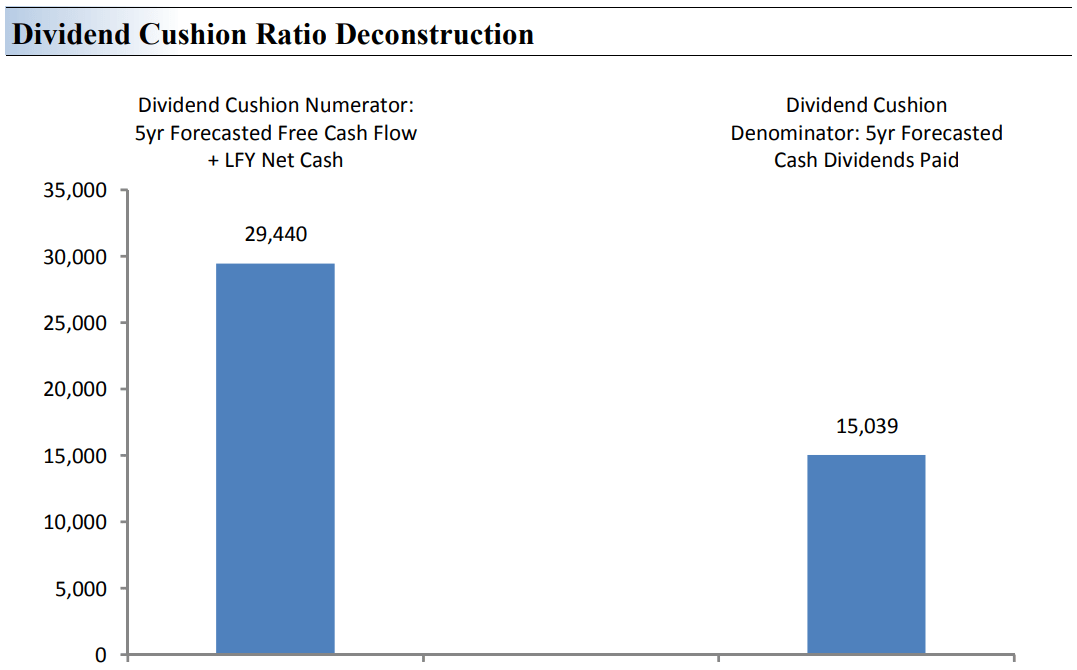
The Dividend Cushion Ratio Deconstruction, shown in the image above, reveals the numerator and denominator of the Dividend Cushion ratio. At the core, the larger the numerator (left bar), or the healthier a company’s balance sheet and future free cash flow generation, relative to the denominator (right bar), or a company’s cash dividend obligations, the more durable the dividend. In the context of the Dividend Cushion ratio, Caterpillar’s numerator is larger than its denominator suggesting strong dividend coverage in the future. The Dividend Cushion Ratio Deconstruction image puts sources of free cash in the context of financial obligations next to expected cash dividend payments over the next 5 years on a side-by-side comparison. Because the Dividend Cushion ratio and many of its components are forward-looking, our dividend evaluation may change upon subsequent updates as future forecasts are altered to reflect new information.
Caterpillar’s Key Investment Considerations
Image Source: Valuentum. The key investment considerations we look at with respect to Caterpillar. (Image Source: Valuentum)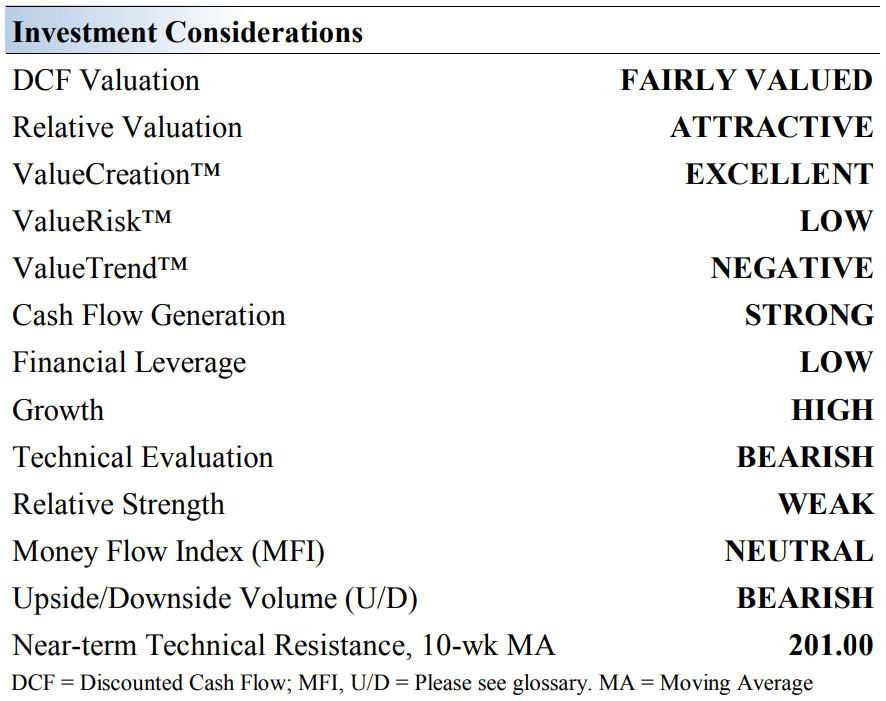
Caterpillar makes construction and mining equipment, diesel and natural gas engines, industrial gas turbines and diesel-electric locomotives. The company also owns Caterpillar Financial Services (Cat Financial). The machinery giant’s operations are tied to cyclical end markets, and results are not immune to geopolitical risks either. It is based in Deerfield, Illinois.
Cat’s dealer network is a significant competitive advantage. Its reach is phenomenal, with ~50 dealers in the US and 120+ outside the US (serving ~190 countries). Mining equipment sales remain tied to expectations of commodity prices, and the period 2013-2016 is exemplary of the pain this can cause.
Drivers of demand at Cat of late include continued strength in the North American construction market, new equipment sales momentum in resource industries, and demand for rebuilds of well-serving equipment in the energy space. Higher material and freight costs have the potential to weigh on bottom-line results in the near term.
Caterpillar is quite effective at managing costs through the course of the economic cycle. Part of Caterpillar’s strategy when faced with revenue declines is to manage the fall such that the decrease in operating profit is less than 30% of the decline in revenue. We also like the focus on driving strong inventory turns.
Cat Financial’s exposure to weak credits in the mining and energy arenas will always have us concerned. The hidden captive finance arms across the broader machinery group may put surprising pressure on performance in the event of a downturn.
Caterpillar’s Economic Profit Analysis
The best measure of a firm’s ability to create value for shareholders is expressed by comparing its return on invested capital with its weighted average cost of capital. The gap or difference between ROIC and WACC is called the firm’s economic profit spread. Caterpillar’s 3-year historical return on invested capital (without goodwill) is 26.5%, which is above the estimate of its cost of capital of 9.1%.
As such, we assign the firm a ValueCreation rating of EXCELLENT. In the chart below, we show the probable path of ROIC in the years ahead based on the estimated volatility of key drivers behind the measure. The solid grey line reflects the most likely outcome, in our opinion, and represents the scenario that results in our fair value estimate. We expect Caterpillar to continue to be a strong economic-profit generator in coming years.
Image Source: Valuentum. We expect Caterpillar to continue to be a strong economic-profit generator in coming years. (Image Source: Valuentum)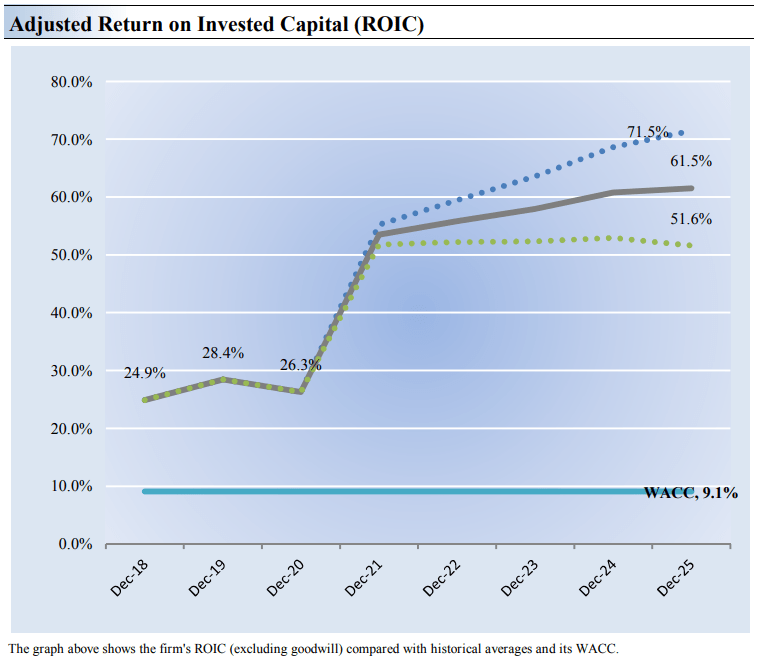
Caterpillar’s Cash Flow Valuation Analysis
Image Source: Valuentum. Caterpillar remains a strong free cash flow generator. (Image Source: Valuentum)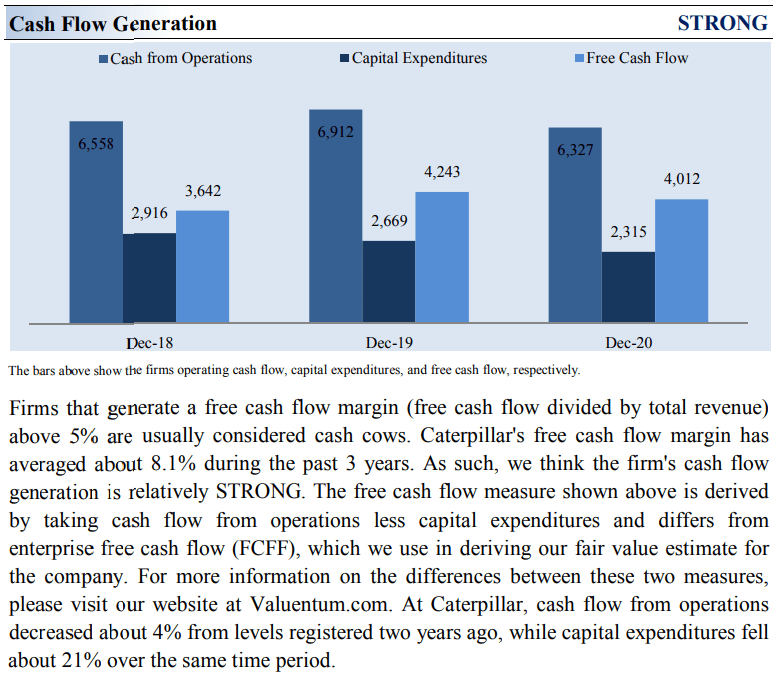
We think Caterpillar is worth $191 per share with a fair value range of $153- $229. Shares are in the mid-$170s at the time of this writing. The margin of safety around our fair value estimate is driven by the firm’s LOW ValueRisk rating, which is derived from an evaluation of the historical volatility of key valuation drivers and a future assessment of them.
Our near-term operating forecasts, including revenue and earnings, do not differ much from consensus estimates or management guidance. Our model reflects a compound annual revenue growth rate of 10.1% during the next five years, a pace that is higher than the firm’s 3- year historical compound annual growth rate of -2.8%.
Our valuation model reflects a 5-year projected average operating margin of 15.7%, which is above Caterpillar’s trailing 3- year average. Beyond year 5, we assume free cash flow will grow at an annual rate of 2.4% for the next 15 years and 3% in perpetuity. For Caterpillar, we use a 9.1% weighted average cost of capital to discount future free cash flows.
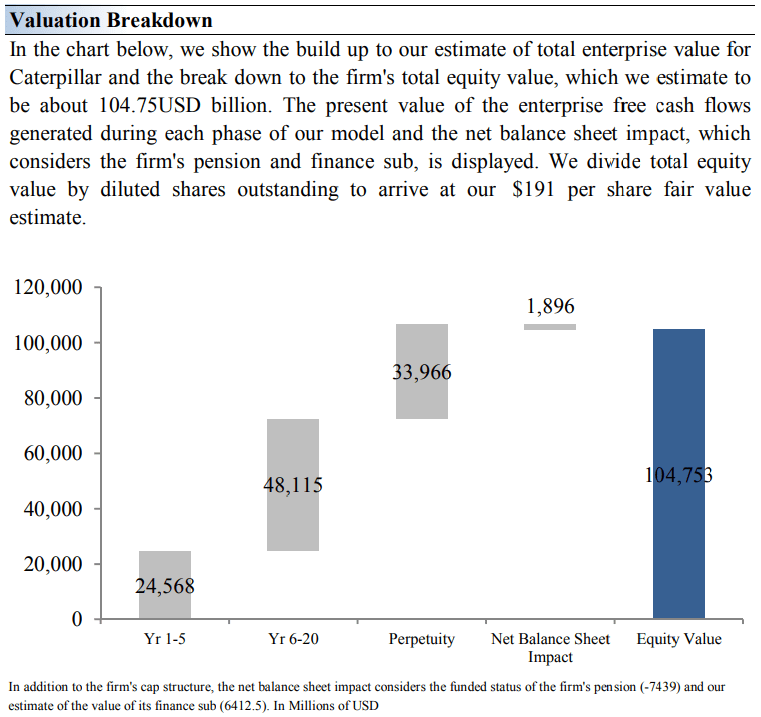
Image Source: Valuentum. The key valuation assumptions embedded in our discounted cash flow model that derive our fair value estimate for Caterpillar. (Image Source: Valuentum) Image Source: Valuentum. The duration of value composition on the basis of our discounted cash flow process for Caterpillar. (Image Source: Valuentum)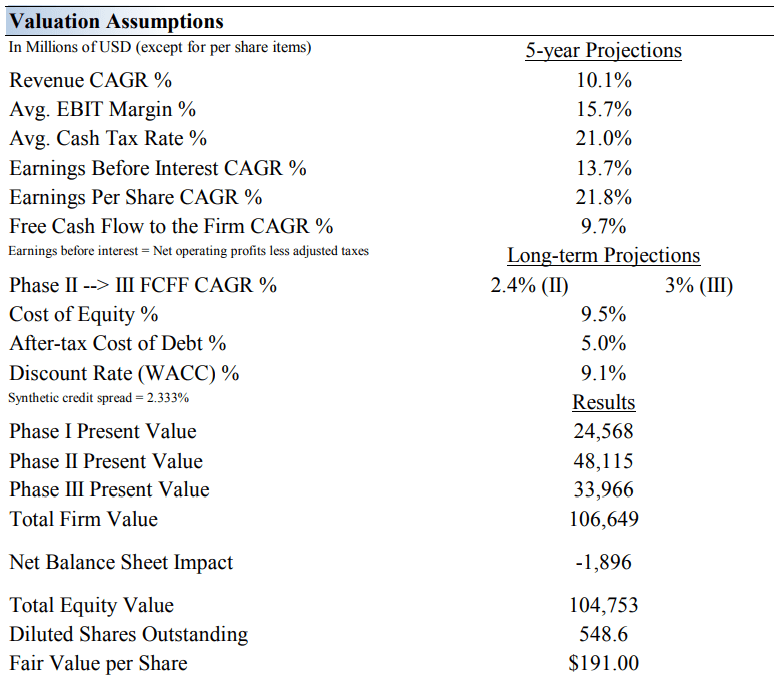
Caterpillar’s Margin of Safety Analysis
Image Source: Valuentum. The margin of safety we ascribe to our fair value estimate range for Caterpillar. (Image Source: Valuentum)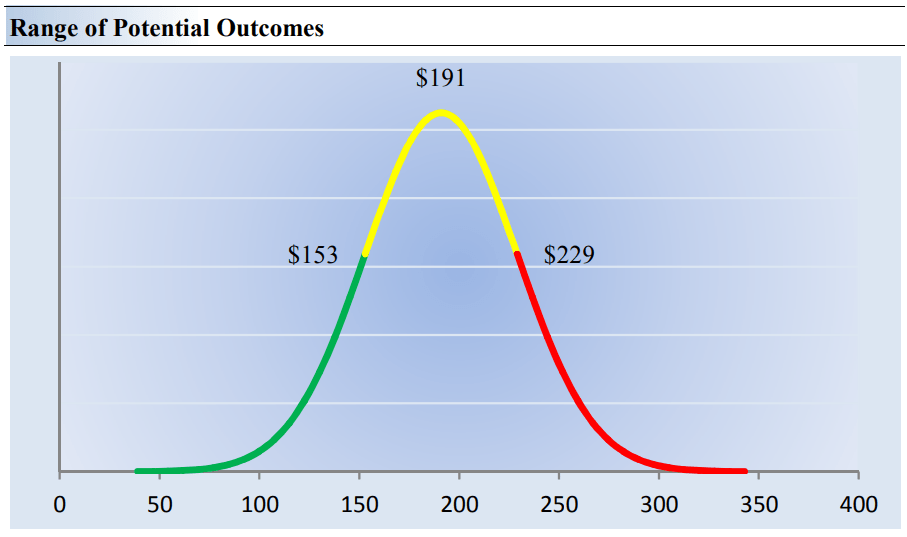
Our discounted cash flow process values each firm on the basis of the present value of all future free cash flows. Although we estimate Honeywell’s fair value at about $191 per share, every company has a range of probable fair values that’s created by the uncertainty of key valuation drivers (like future revenue or earnings, for example). After all, if the future were known with certainty, we wouldn’t see much volatility in the markets as stocks would trade precisely at their known fair values.
This is an important way to view the markets as an iterative function of future expectations. As future expectations change, so should the company’s value and its stock price. Stock prices are not a function of fixed historical data but rather act in such a way to capture future expectations within the enterprise valuation construct. This is a key part of our book Value Trap: Theory of Universal Valuation.
Our ValueRisk rating sets the margin of safety or the fair value range we assign to each stock. In the graph above, we show this probable range of fair values for Caterpillar. We think the firm is attractive below $153 per share (the green line), but quite expensive above $229 per share (the red line). The prices that fall along the yellow line, which includes our fair value estimate, represent a reasonable valuation for the firm, in our opinion. Shares of Caterpillar look attractive at the moment, on the basis of this analysis.
Concluding Thoughts
The cyclical end markets Caterpillar serves is but one of the major risks surrounding the sustainability of its dividend. The firm also has a sizeable debt load. Its exposure to weakened credits in the energy and mining sectors gives us additional cause for concern, and it has the potential to add an increasing amount of pressure in coming years. Competing capital allocation options have the potential to impact the pace of dividend expansion moving forward. Share repurchases have been material in recent years. Geopolitical risks and overall economic uncertainty do not bode well for this cyclical operator and the health of its dividend, but Caterpillar knows how to handle downturns well. If shares continue to get cheaper, it will become very difficult to pass up this investment idea consideration, despite the myriad risks.
This article or report and any links within are for information purposes only and should not be considered a solicitation to buy or sell any security. Valuentum is not responsible for any errors or omissions or for results obtained from the use of this article and accepts no liability for how readers may choose to utilize the content. Assumptions, opinions, and estimates are based on our judgment as of the date of the article and are subject to change without notice.
Be the first to comment