


DenisTangneyJr/iStock via Getty Images
Investments in technology and the normalization of provisioning expenses will likely hurt the earnings of Capitol Federal Financial, Inc. (NASDAQ:CFFN) in 2023. On the other hand, subdued loan growth on the back of economic strength in Kansas will likely support the bottom line. Further, earnings will benefit from slight margin expansion. Overall, I’m expecting Capitol Federal to report earnings of $0.59 per share for 2023, down by 4% year-over-year. The September 2023 target price is quite close to the current market price. Based on the total expected return, I’m adopting a hold rating on Capitol Federal Financial.
Recent Improvement in the Loan Trend Likely to be Sustained
Capitol Federal Financial’s loan portfolio grew by 5.4% in the year ended September 2022, which is much better than the historical trend. The company’s loan portfolio actually declined for three years straight from FY19 to FY21. Most of the recent extraordinary loan growth was attributable to one-to-four-family residential loans and consumer loans, as mentioned in the earnings release.
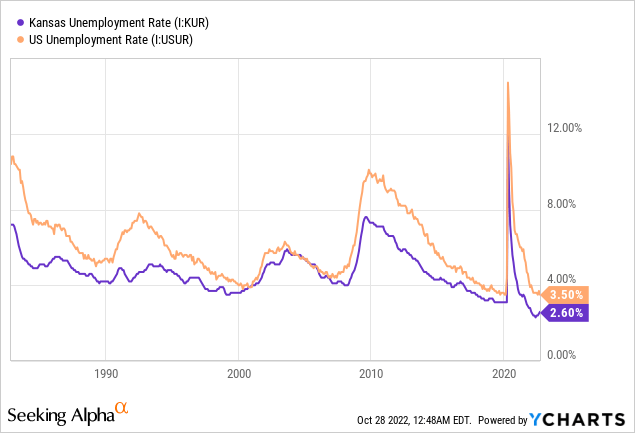
Going forward, some economic factors will likely support loan growth. Capitol Federal mainly operates in Kansas, the state with one of the hottest job markets. The state’s unemployment rate is better than the national average and is quite low from a historical perspective.
Further, the economic activity in Kansas has rebounded sharply from the pandemic.
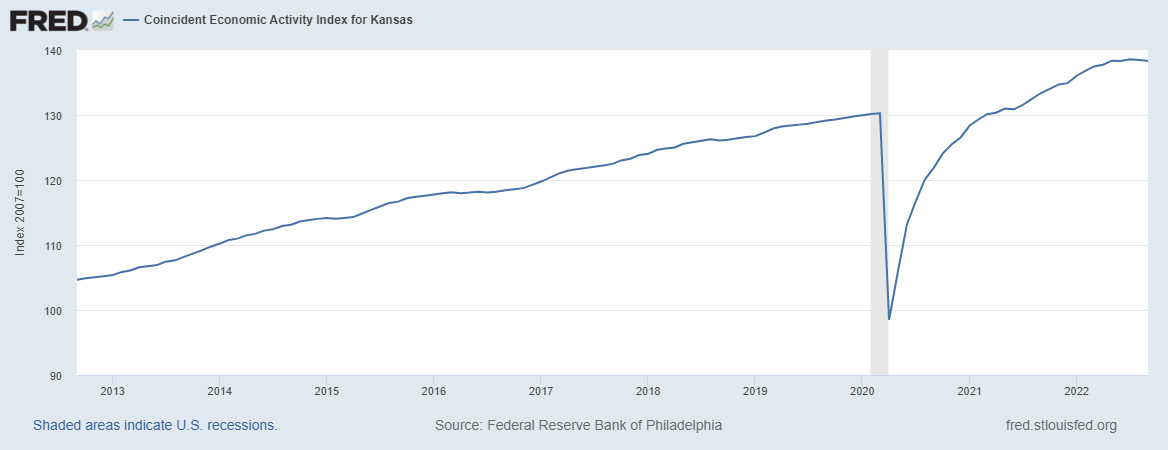
The Federal Reserve Bank of Philadelphia
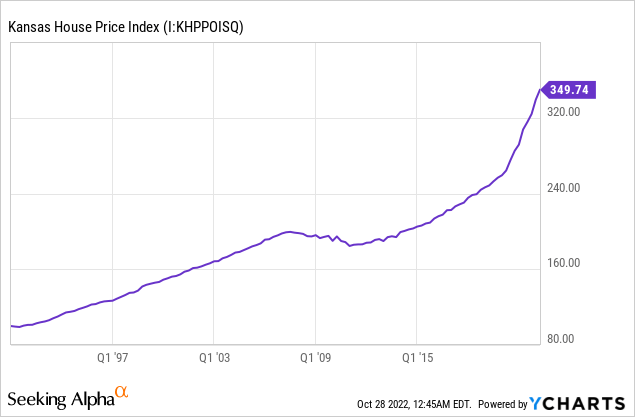
One-to-four-family residential loans make up 86% of Capitol’s total loans. Therefore, the Kansas house price index is also an important indicator of product demand. Unfortunately, the recent steep uptrend does not bode well for loan growth.
Considering these conflicting factors, I’m expecting the loan portfolio to grow by 3% in the fiscal year ending September 2023. Meanwhile, I’m expecting other balance sheet items to grow mostly in line with loans. The following table shows my balance sheet estimates.
| FY18 | FY19 | FY20 | FY21 | FY22 | FY23E | |
| Financial Position | ||||||
| Net Loans | 7,514 | 7,417 | 7,203 | 7,081 | 7,464 | 7,691 |
| Growth of Net Loans | 4.4% | (1.3)% | (2.9)% | (1.7)% | 5.4% | 3.0% |
| Other Earning Assets | 1,450 | 1,404 | 1,733 | 2,039 | 1,591 | 1,639 |
| Deposits | 5,603 | 5,582 | 6,191 | 6,597 | 6,195 | 6,383 |
| Borrowings and Sub-Debt | 2,175 | 2,240 | 1,789 | 1,583 | 2,132 | 2,197 |
| Common equity | 1,392 | 1,336 | 1,285 | 1,242 | 1,096 | 1,096 |
| Book Value Per Share ($) | 10.3 | 9.7 | 9.3 | 9.2 | 8.1 | 8.1 |
| Tangible BVPS ($) | 10.3 | 9.7 | 9.3 | 9.2 | 8.1 | 8.1 |
|
Source: SEC Filings, Author’s Estimates (In USD million unless otherwise specified) |
Limited Margin Expansion Ahead
Capitol Federal Financial’s margin contracted by eight basis points during the last quarter despite the 150-basis point hike in the fed funds rate. The pressure on the margin was attributable to the fact that deposits continued to decline while loans increased. To bridge the funding gap, Capitol Federal had to resort to expensive borrowing. As mentioned in the earnings release, the cost of these new borrowings was quite high, at 3.90%. To put this rate in perspective, Capitol Federal Financial paid an average rate of only 0.63% on its deposit book and an average rate of 2.20% on its total borrowings. Unless the management can restrict the deposit bleeding, the margin will likely continue to face pressure in the coming quarters.
The large balance of interest-bearing deposits, excluding certificate of deposits, will also pressurize the margin. As of the end of September 2022, these deposits made up 55% of total deposits. These will reprice soon after every rate hike and keep the deposit beta high.
On the plus side, the rising rate environment will lift the average earning-asset yield. Capitol Federal’s margin has been only loosely correlated to interest rates in the past, as shown below.
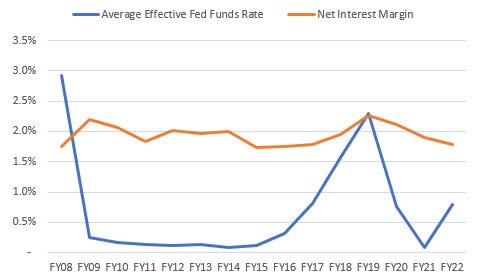
SEC Filings, The Federal Reserve Bank of St. Louis
Considering these factors, I’m expecting the margin to increase by only five basis points in 2023.
Headwinds to Boost Provisioning
Unlike the first half of the year, Capitol Federal’s provisioning charges exceeded provision reversals in the second half of the year ended in September 2022. Going forward, I’m expecting provisioning to remain at the same level as in the last quarter. Allowances were 173.37% of non-performing loans at the end of September 2022. This coverage position seems a bit tight given the high inflation environment and the threats of a recession. On the plus side, most of Capitol Federal’s loans are backed by residential real estate; therefore, the credit risk is low. Overall, I’m expecting Capitol Federal to report a net provision expense of $4 million in 2023, which makes up 0.05% of total loans.
Higher Expenses to Hurt Earnings
The management has planned a digital transformation that will be completed by the end of September 2023, as mentioned in the earnings release. The management is budgeting $7 million for this initiative, which will take the information technology and related expenses to $25 million for the full year. I’m expecting the fruits of this transformation to benefit earnings from 2024 onwards.
Apart from this investment in technology, higher provisioning expenses will also drag earnings in the fiscal year 2023. On the other hand, subdued loan growth and slight margin expansion will support the bottom line. Overall, I’m expecting Capitol Federal to report earnings of $0.59 per share for 2023, down 4% year-over-year. The following table shows my income statement estimates.
| FY18 | FY19 | FY20 | FY21 | FY22 | FY23E | |||||
| Income Statement | ||||||||||
| Net interest income | 199 | 206 | 189 | 175 | 193 | 208 | ||||
| Provision for loan losses | – | 1 | 22 | (9) | (5) | 4 | ||||
| Non-interest income | 22 | 22 | 20 | 28 | 23 | 23 | ||||
| Non-interest expense | 97 | 107 | 106 | 116 | 113 | 125 | ||||
| Net income – Common Sh. | 99 | 94 | 65 | 76 | 84 | 81 | ||||
| EPS – Diluted ($) | 0.73 | 0.68 | 0.47 | 0.56 | 0.62 | 0.59 | ||||
|
Source: SEC Filings, Earnings Releases, Author’s Estimates (In USD million unless otherwise specified) |
||||||||||
Actual earnings may differ materially from estimates because of the risks and uncertainties related to inflation, and consequently the timing and magnitude of interest rate hikes. Further, a stronger or longer-than-anticipated recession can increase the provisioning for expected loan losses beyond my estimates.
The Current Market Price is Close to the Target Price
Capital Federal distributes 100% of its earnings as a cash dividend. It pays a quarterly dividend of $0.085 per share and then pays the remainder through a special dividend in a cash true-up. The quarterly dividend of $0.085 per share suggests a dividend yield of 4.6%, while a full-year dividend of $0.59 per share (100% of estimated earnings) suggests a dividend yield of 8.1%.
I’m using the peer average price-to-book (“P/B”) and price-to-earnings (“P/E”) multiples to value Capitol Federal. The average P/B ratio is 1.14 and the average P/E multiple is 9.25 for peers, as shown below.
| AGM | MBIN | NFBK | PFS | KRNY | Average | |
| P/E GAAP (“ttm”) | 8.94 | 5.38 | 11.62 | 10.06 | 11.75 | 9.55 |
| P/E GAAP (“fwd”) | 8.37 | 5.34 | 11.59 | 9.1 | 11.87 | 9.25 |
| P/B | 1.64 | 1.2 | 1.04 | 0.98 | 0.83 | 1.14 |
| Source: Seeking Alpha | ||||||
Multiplying the average P/B multiple with the forecast book value per share of $8.1 gives a target price of $9.2 for September 2023. This price target implies a 24.9% upside from the October 27 closing price. The following table shows the sensitivity of the target price to the P/B ratio.
| P/B Multiple | 0.94x | 1.04x | 1.14x | 1.24x | 1.34x |
| BVPS – Sep 2023 ($) | 8.1 | 8.1 | 8.1 | 8.1 | 8.1 |
| Target Price ($) | 7.6 | 8.4 | 9.2 | 10.0 | 10.8 |
| Market Price ($) | 7.4 | 7.4 | 7.4 | 7.4 | 7.4 |
| Upside/(Downside) | 2.9% | 13.9% | 24.9% | 35.8% | 46.8% |
| Source: Author’s Estimates |
Multiplying the average P/E multiple with the forecast earnings per share of $0.59 gives a target price of $5.7 for September 2023. This price target implies a 22.9% downside from the October 27 closing price. The following table shows the sensitivity of the target price to the P/E ratio.
| P/E Multiple | 7.6x | 8.6x | 9.6x | 10.6x | 11.6x |
| EPS 2023 ($) | 0.59 | 0.59 | 0.59 | 0.59 | 0.59 |
| Target Price ($) | 4.5 | 5.1 | 5.7 | 6.3 | 6.9 |
| Market Price ($) | 7.4 | 7.4 | 7.4 | 7.4 | 7.4 |
| Upside/(Downside) | (39.0)% | (30.9)% | (22.9)% | (14.8)% | (6.7)% |
| Source: Author’s Estimates |
Equally weighting the target prices from the two valuation methods gives a combined target price of $7.4, which implies a 1.0% upside from the current market price. Adding the forward dividend yield (including special dividend) gives a total expected return of 9.1%. Hence, I’m adopting a hold rating on Capitol Federal Financial.
Be the first to comment