


Wolterk
All figures are in CAD unless otherwise noted.
Investment Thesis
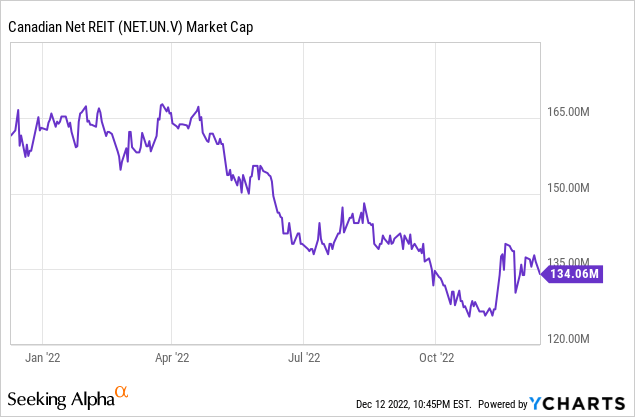
Canadian Net Real Estate Investment Trust (TSXV:NET.UN:CA) trades on the TSX Venture Exchange. Its previous name was Fronsac REIT, which it changed to its present name in June 2021. This is not a well known REIT with only 5 Canadian institutions covering it and is indicative of its $134M market capitalization.
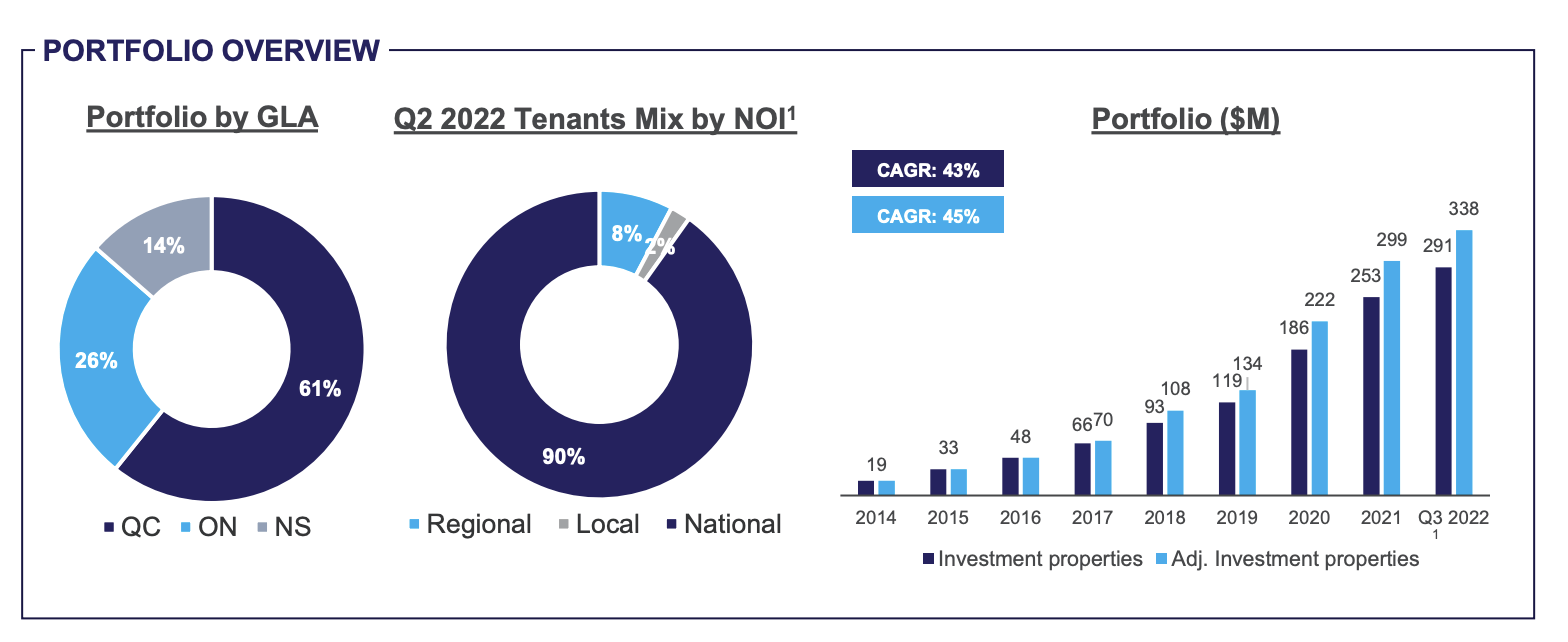
Net holds held 101 investment properties, 83 residing in the province of Quebec, 9 in the province of Ontario and 9 in the province of Nova Scotia. Property tenants include retailers, national service station and convenience store chains, and quick-service restaurant chains. The REIT predominantly leases to retailers. The REIT has carved out a niche for itself with its deal sizes being under the radar of most large REITs and institutions but too large for individual investors.
Investor Fact Sheet – Q3 2022 (Canadian Net REIT)
The REIT features two of my favourite qualities when it comes to REITs.
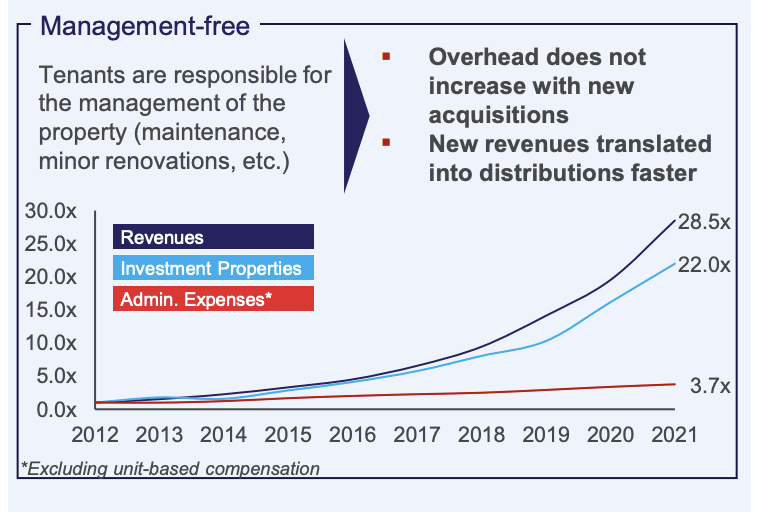
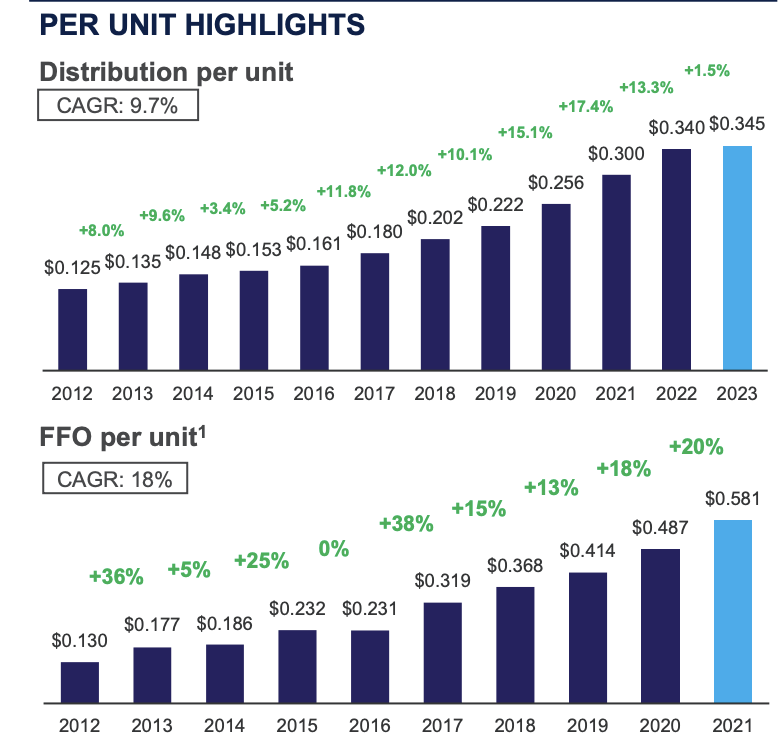
First, it utilizes triple net leases. Under this type of arrangement, the tenant is responsible for paying real estate taxes, insurance and any general maintenance required, in addition to the base rent already stipulated in the lease terms. The tenant bears most of the costs of inflation and the REIT can implement rental escalators which protects their cash flows. These types of acquisitions limit the overhead required to run the business and in turn allows management to focus on adding value through strategic acquisitions that are accretive to the Trust’s FFO and AFFO per unit. As we can see since 2012 revenues and investment properties have risen at a much larger rate than expenses.
Investor Fact Sheet – Q3 2022 (Canadian Net REIT)
Second, the REIT is entirely internalized and no service agreements or asset management agreements are in force between NET and its officers and trustees. I tend to favour these REITs as the interests of management and of its employees are aligned with those of the unitholders. Furthermore NET has 14% insider ownership.
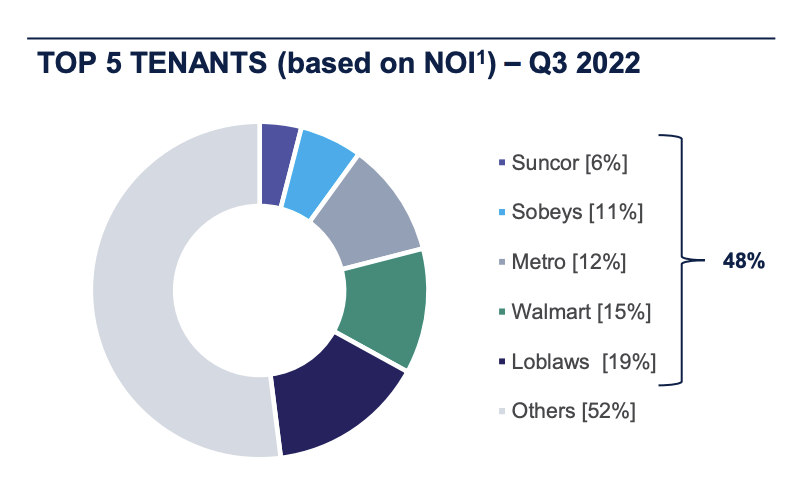
Properties are leased to credit rated national tenants most of which are considered investment grade. The REIT tends to pick revenue-driven and high traffic tenants that require less property improvements as the location is the greater concern. Its largest tenants are Loblaw (L:CA), Walmart (WMT), Sobeys (Empire) (EMP.A:CA), Metro (MRU:CA), and Suncor (SU:CA) that together contributed about 48% of NOI for the most recent quarter.
Investor Fact Sheet – Q3 2022 (Canadian Net REIT)
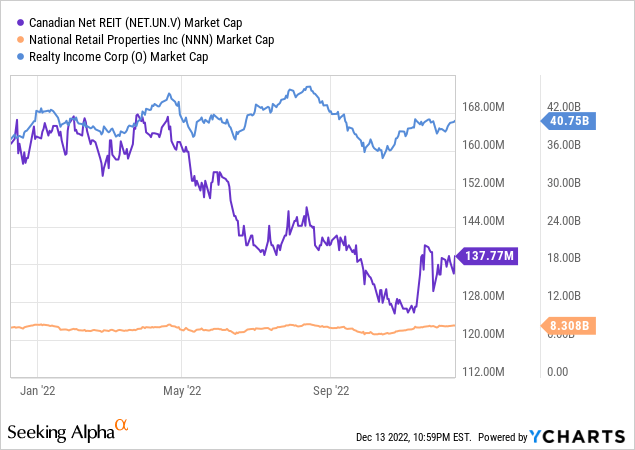
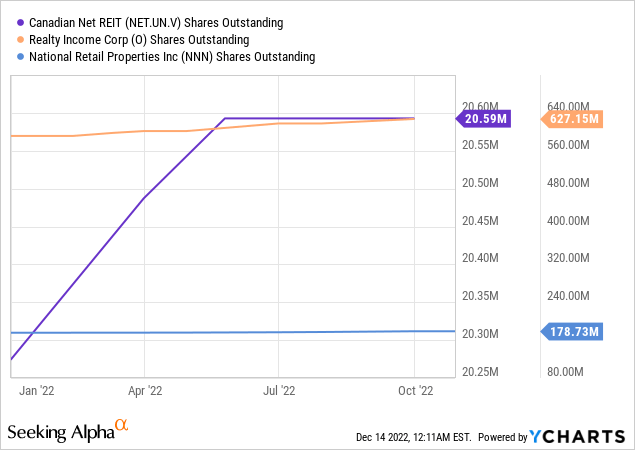
Does this business model sound familiar? Well REIT investors probably know Realty Income (O) and National Retail Properties (NNN) who are consider “best in class” triple net REITs and have somewhat similar tenant mixes and business models. These REITs are also dividend aristocrats. Unfortunately NET has only increased the dividend 10 straight years albeit through COVID while O and NNN have done so 28 and 33 straight years respectively. NET’s market capitalization, assets under management and geographical footprint also pale in comparison. Not to mention O and NNN operate predominantly in the U.S. while NET operates in Canada.
Investor Fact Sheet – Q3 2022 (Canadian Net REIT)
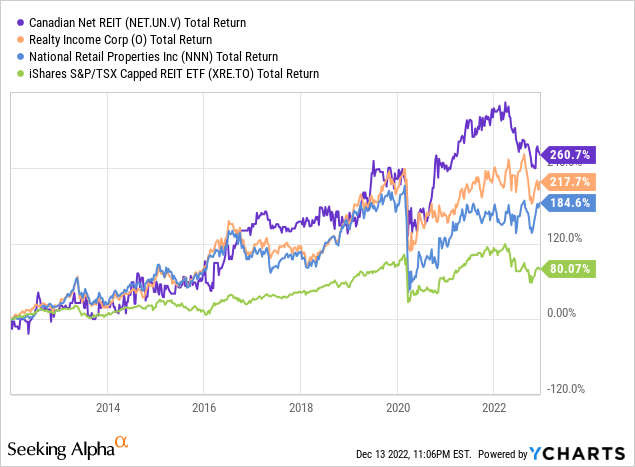
That all being said NET has outperformed its two behemoth American counterparts and the iShares REIT Index since 2012.
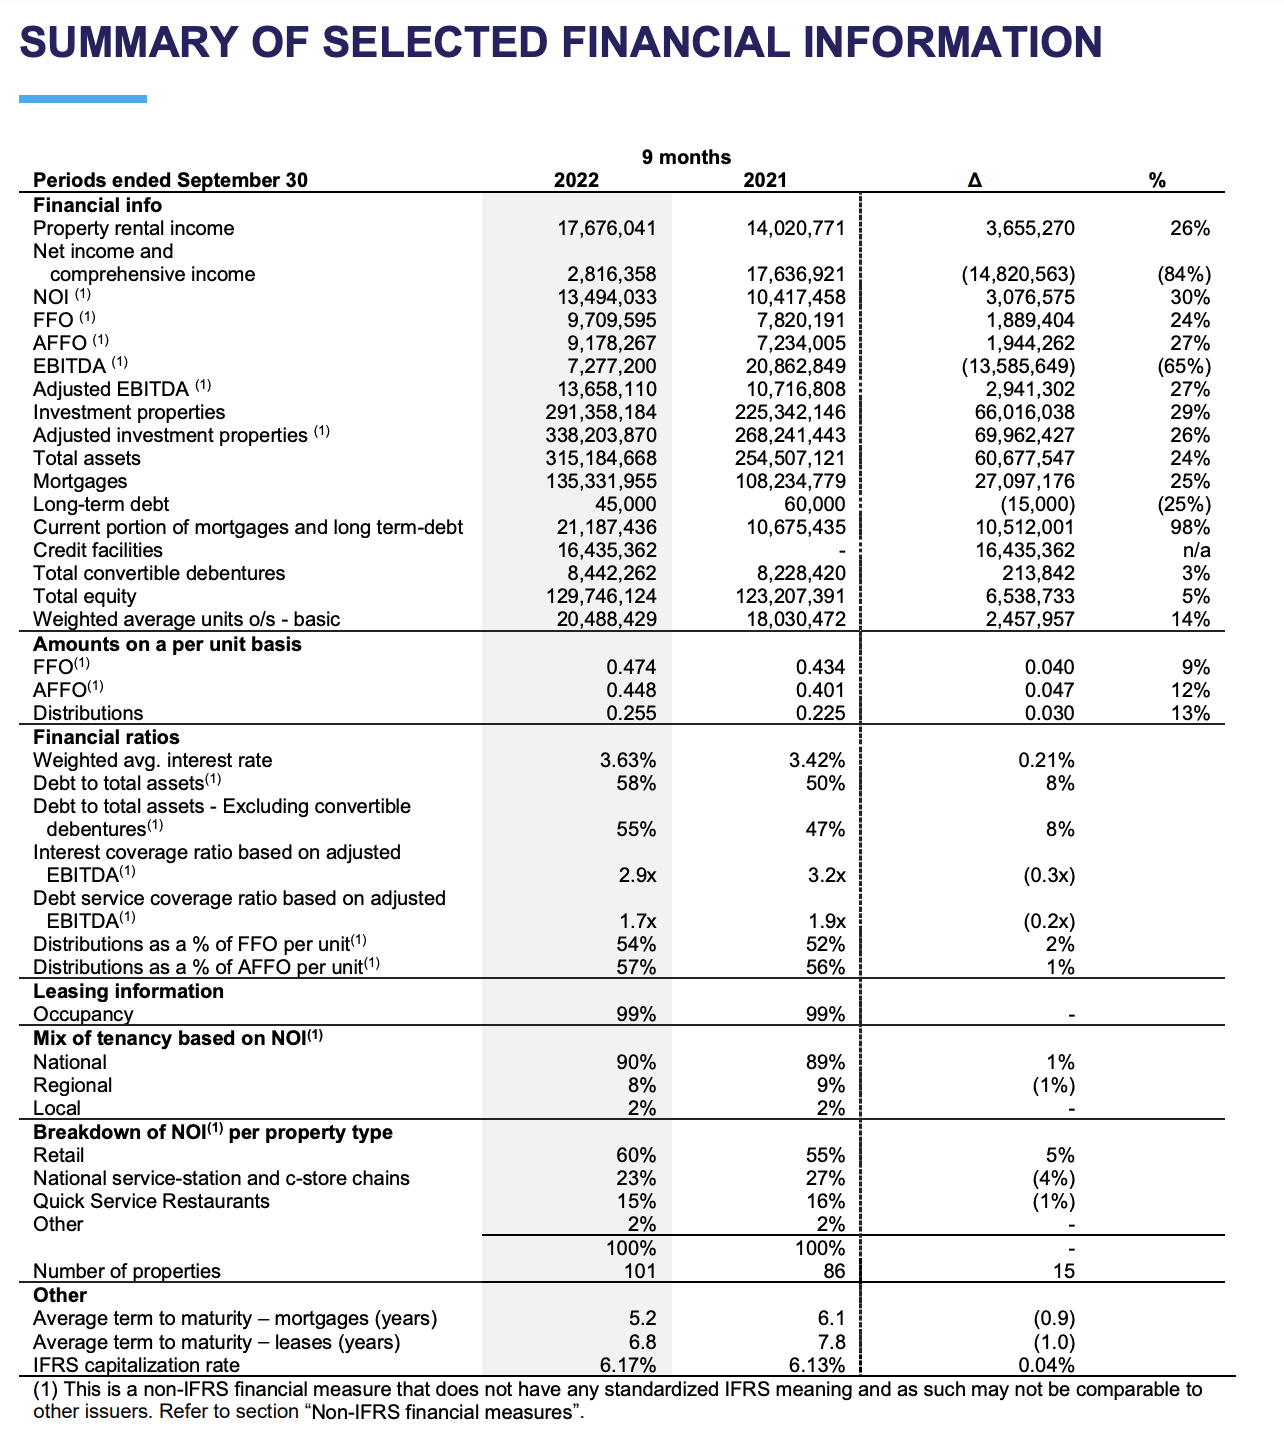
Q3 2022 results also showed nothing but positive signs:
- Weighted average lease term is 6.8 years.
- Occupancy of 99%.
- Property rental income growth of 26% to $18 Million YoY,
- NOI growth of 30% to $13 Million.
- FFO growth of 24% to ~$10 Million.
- FFO payout ratio of 54%.
- Weighted average interest rate of 3.63%
- Average mortgage term to maturity on mortgages is 5 years.
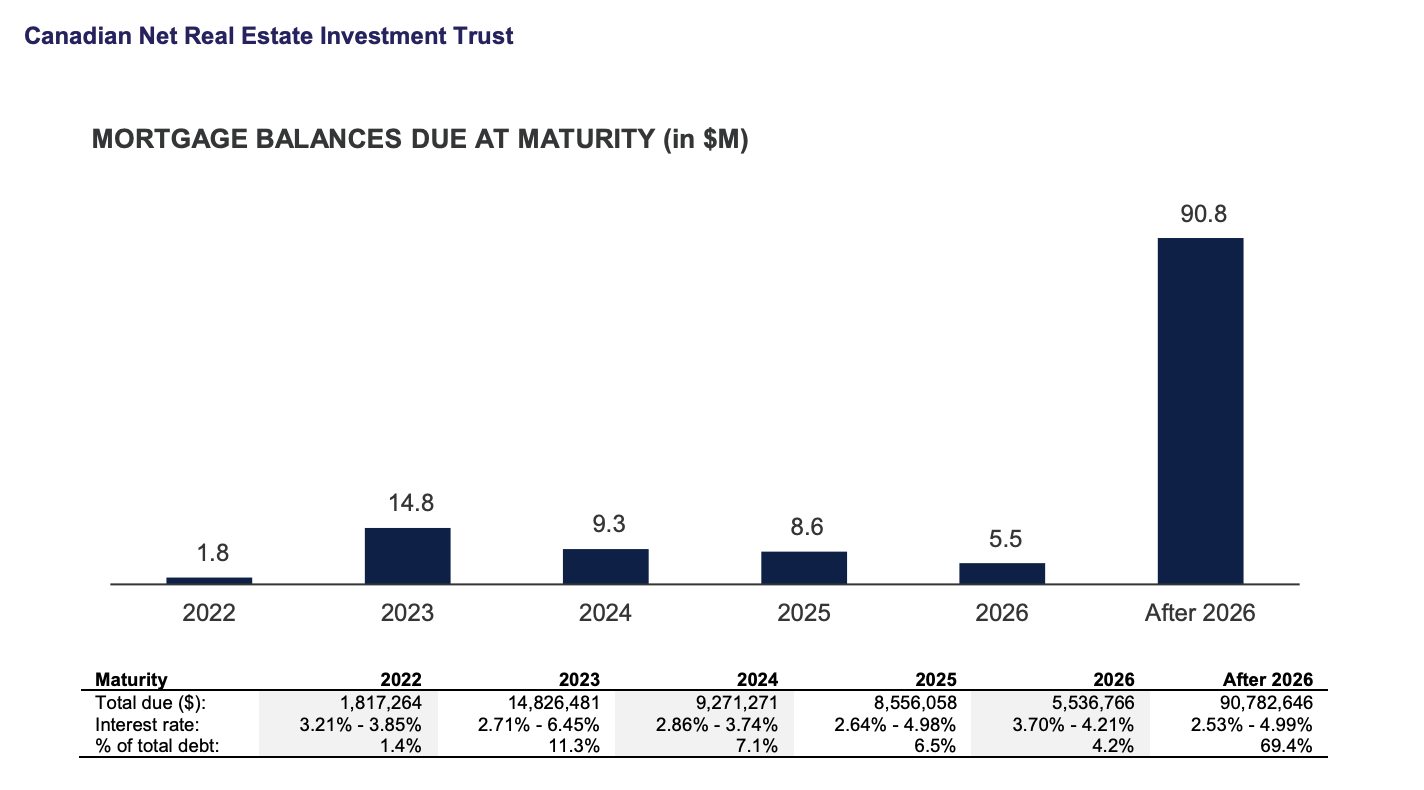
Management Discussion & Analysis Q3 2022 (Canadian Net REIT)
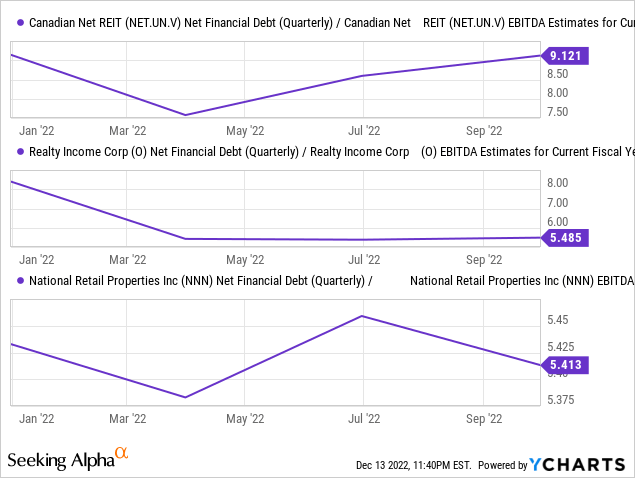
Let’s discuss the last two points. NET’s leverage is a little on the high side with debt to assets of 55% and net debt/ EBITDA of ~9x while NNN and O are just above ~5x. A large chunk of NET’s expenses are financial in nature, and the Bank of Canada (BoC) has been incredibly dovish through 2022 with even the One-Year Treasury Bill yielding is 4.38%. If the REIT had to refinance today rates at less than even 6% would be difficult to find. Luckily NET has only 20% of its debt maturing before 2024 and therefore should see minimal increases in its interest expense over the next two years.
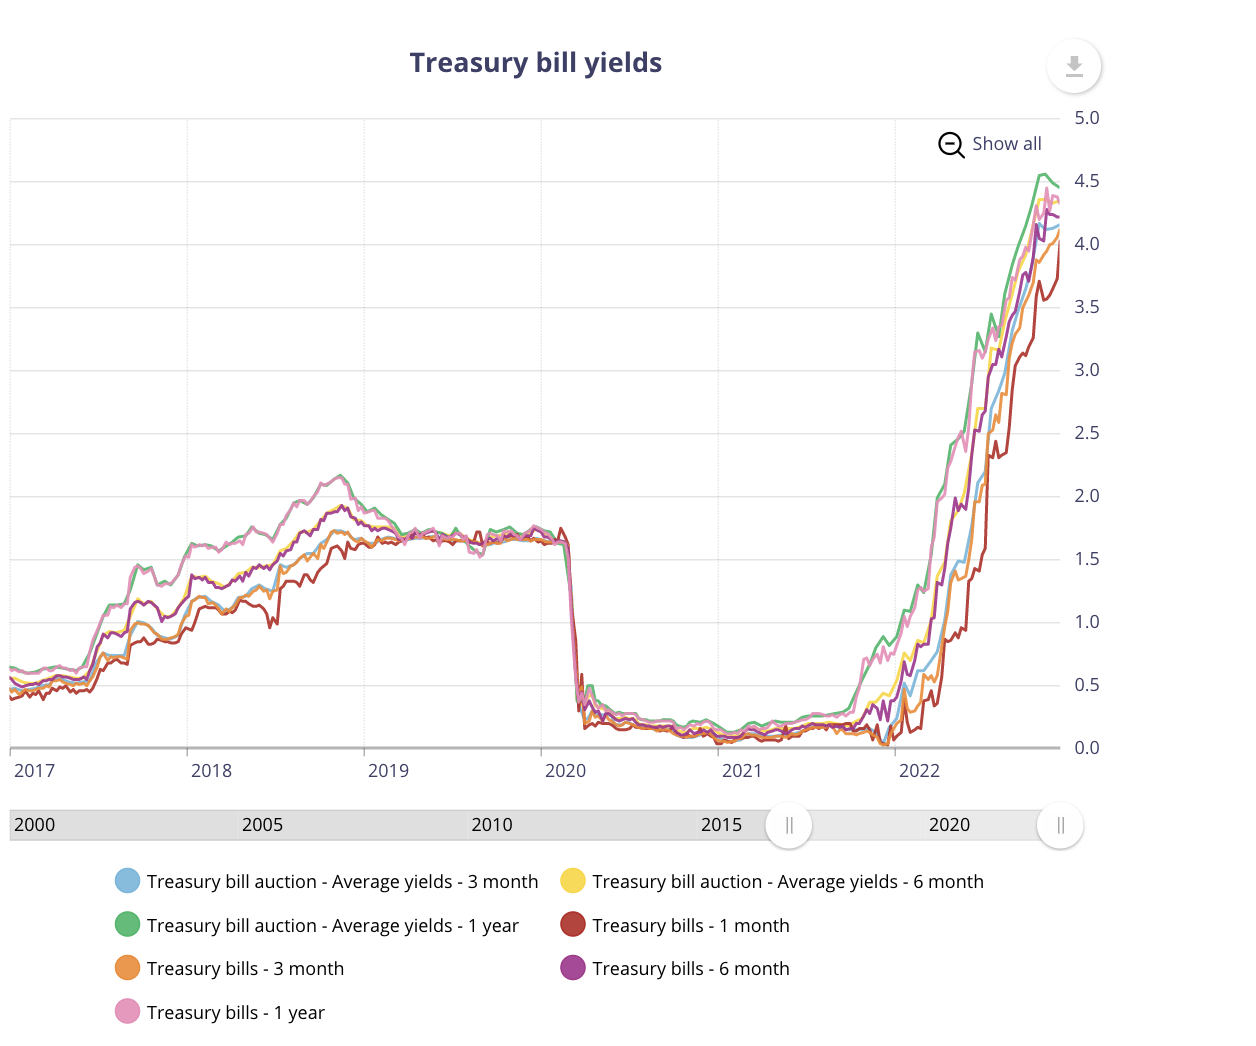
Selected Yields (Bank of Canada)
Management Discussion & Analysis Q3 2022 (Canadian Net REIT)
Valuation
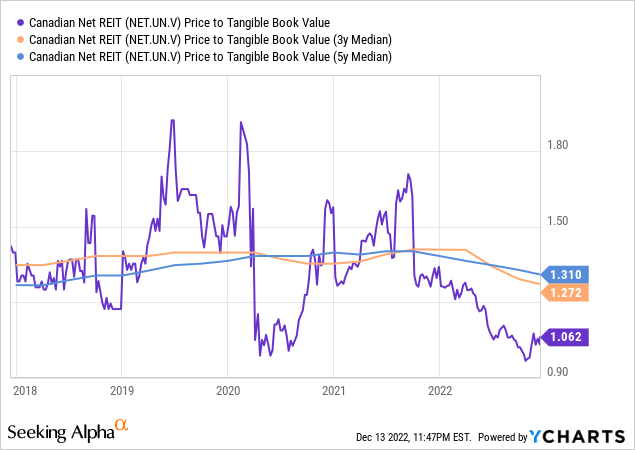
As any good value investor knows it’s not sufficient to buy a good company at a mediocre or even a bad price. You need to buy a good company at a good or even a wonderful price to make excess returns. Below we see that the REIT is priced about on par with NAV. Remember properties can be revalued using IFRS so TBV is actually a good approximation of NAV. The REIT has not traded this low since the onset of COVID and often trades at a 20-30% discount. The REIT historically has gone on to deliver double digit returns only a few months later when trading at these levels as was the case in late 2019 and 2020.
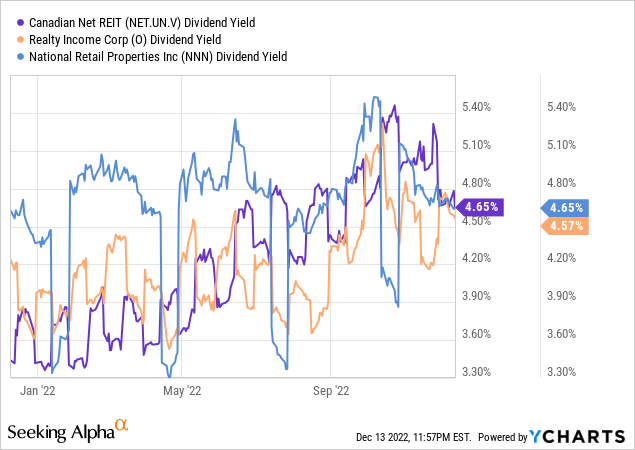
Normally I like to buy REITs below NAV if possible but let’s look how it is valued relative to O and NNN as these REITs also don’t often trade below NAV. Sadly the REIT’s dividend yield is almost the exact same. What is more depressing is the fact that its yield is only 27 bps higher than the Canadian One-Year Treasury Bill and the lowest the spread has been all year.
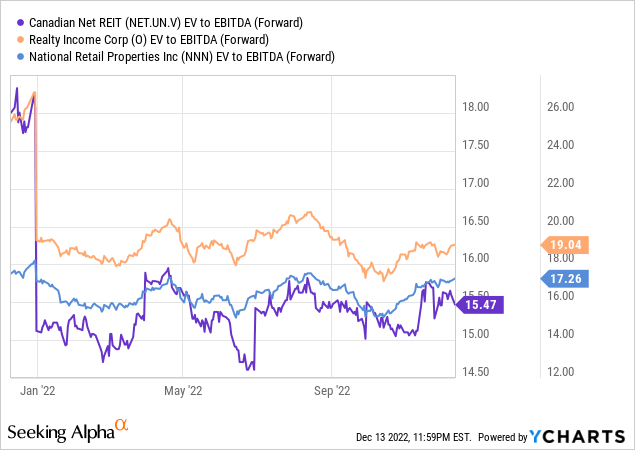
The REIT has spent $41 Million in on acquisitions through 2022 which is 32% of its market capitalization so isn’t getting too ambitious with the payout. When we value based on cash flows the REIT does look slightly cheaper than its American counterparts. The discount still seems a bit scant given the much lower liquidity of NET, its leverage profile, and lower tenant and geographical diversification.
Conclusion
The REITs success has been impeccable and I have no doubts it will be a dividend aristocrat in its future and possibly get the same respect NNN and O get as far as Triple Net REITs go.
The valuation is still not compelling enough to take a position but the dovish BoC is definitely wreaking havoc on REITs and a lot of which is not deserved. If the REIT falls below NAV I will consider initiating a position.
Be the first to comment