

Robert Way
Once again, the athletic apparel company founded in Canada defies Wall Street’s expectations and proves that macro headwinds aren’t going to affect business. On September 1st, Lululemon (NASDAQ:LULU) reported second-quarter earnings and the stock soared ~6%.
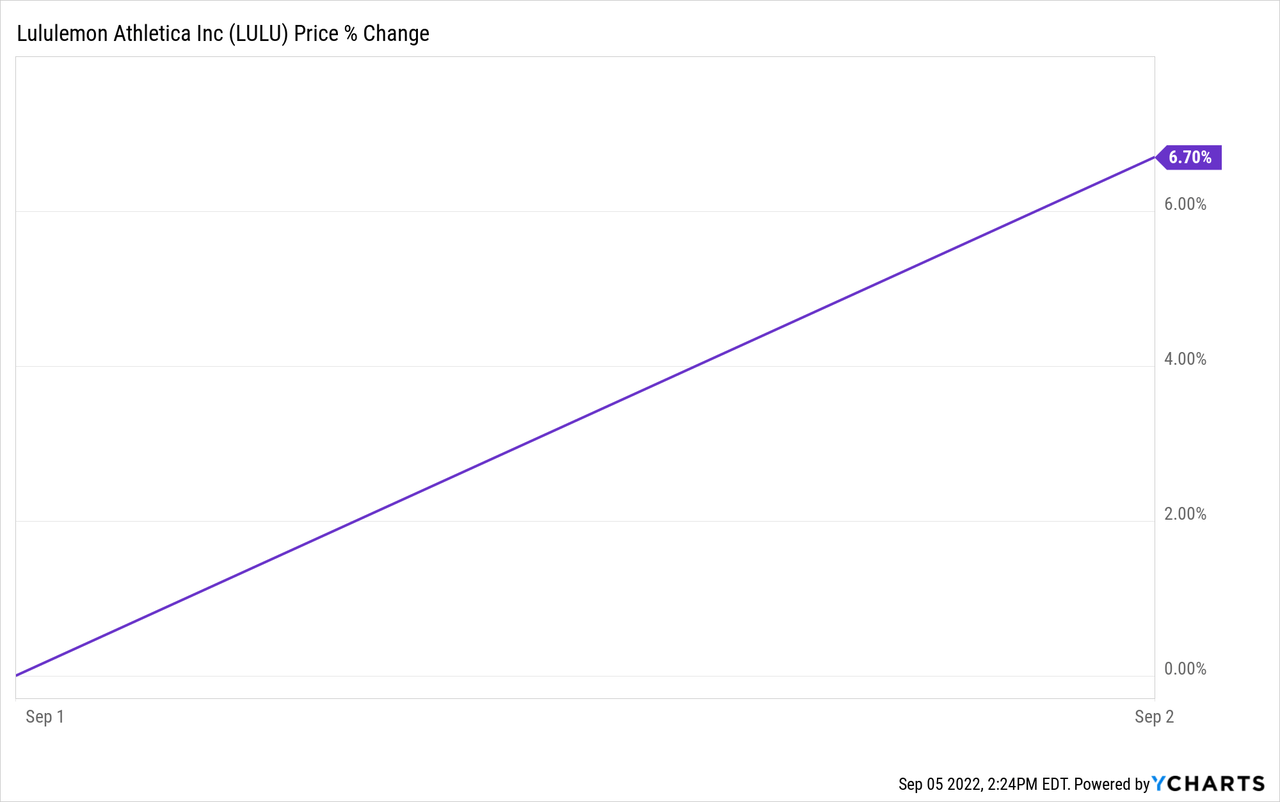
It’s safe to say LULU’s results impressed the Street, and shareholders reaped the benefits.
In my first LULU article about a month ago, I placed a Strong Buy recommendation on the company for three core reasons.
- Power of Three Growth & Established Business
- Best-in-Class Financials & Comp Sales
- Share Buybacks
Let’s take a look at how LULU confirmed all three thesis points, and why I am reiterating my “Strong Buy” recommendation on this high-growth retailer.
Growth
To reiterate LULU’s Power of Three X 2 growth strategy, the company expects to generate revenue of $12.5B by 2026, essentially doubling its business.
While that’s all well and good, as the old saying goes: talk is cheap. Let’s see if this target is actually realistic for LULU to achieve by 2026.
To put this into perspective, see LULU’s historical revenue table below. Over the last 7 fiscal years, LULU has grown its revenue at a 20% CAGR.
| 2014 | 2015 | 2016 | 2017 | 2018 | 2019 | 2020 | 2021 |
| 1,797 | 2,060 | 2,344 | 2,649 | 3,288 | 3,979 | 4,401 | 6,256 |
| 15% | 14% | 13% | 24% | 21% | 11% | 42% |
In the current fiscal year alone, LULU expects to generate $7.94B in revenue after adjusting its guidance from $7.71B. This implies an impressive 27% YoY growth rate. Thus, based on LULU’s growth, the $12.5B revenue target is well within reach.
The reasoning behind this is that LULU would only need to grow revenue at 12% per year, assuming it hits its F’22 revenue target of $7.97B. As a company in the early innings of growth that is rapidly expanding its international market share, LULU will likely hit its target by 2026, if not earlier.
Power of Three growth Strategy (Company Filings)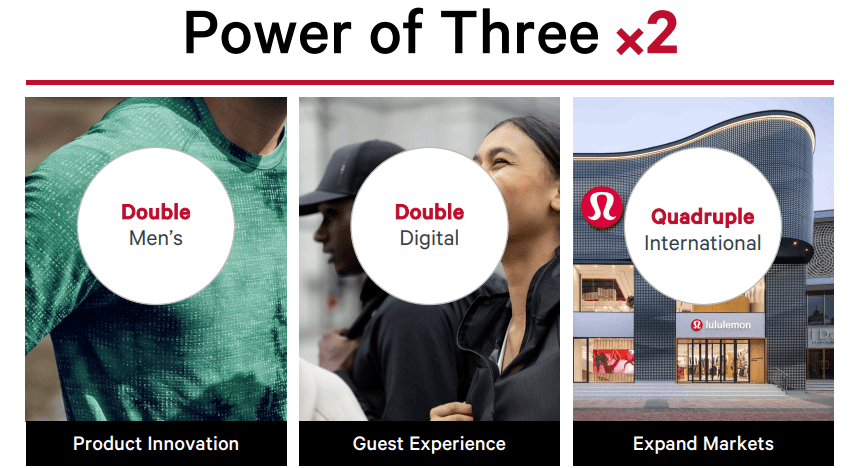
Focusing on three core categories to achieve this growth strategy, LULU’s management team is confident the business will be able to generate robust growth despite macroeconomic challenges such as inflation, supply chain constraints, and tighter disposable incomes.
As depicted by the chart below, LULU continues to generate robust growth across all three pillars to achieve its aggressive growth target.
Three-Year CAGR Metrics
| Core Pillar | Sub-Category | 3yr CAGR |
| Product Innovation | Women’s Revenue | 25% |
| Product Innovation | Men’s Revenue | 30% |
| Guest Experience | Store Revenue | 16% |
| Guest Experience | Digital Revenue | 53% |
| Market Expansion | International Revenue | 40% |
| Market Expansion | North American Revenue | 26% |
LULU is also focused on growing its store count aggressively, specifically within international markets.
However, the company isn’t solely reliant on new stores to generate top-line growth, with strong comparable sales metrics indicative of healthy product demand.
In the second quarter, LULU opened 21 net new stores, compared to 11 in Q1’22 and 5 in Q2’21. Further, they modestly increased total store count guidance from 70 to 75 for year-end.
Author Created (Company Filings)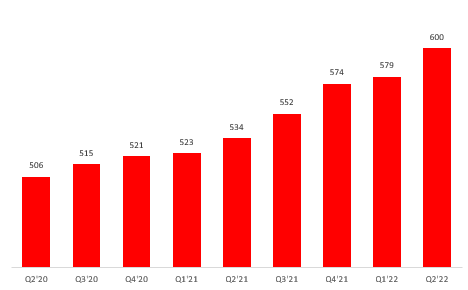
CFO Meghan Frank commented on the 600 store count milestone:
We ended the quarter with a total of 600 stores across the globe, a milestone we are all extremely proud of. Square footage increased 19% versus last year, driven by the addition of 66 net new stores since Q2 of 2021. During the quarter, we opened 21 net new stores and completed six co-located optimizations.
Additionally, LULU’s revenue growth is attributed to both new guest acquisition and existing customers. This demonstrates LULU’s brand loyalty and ability to increase its market share within the competitive apparel space.
New guest acquisition remains strong with transactions by first-time guests increasing over 20% in quarter two. Transactions by existing guests increased in the high teens. Traffic across channels remains robust with store traffic up over 30% and e-commerce traffic increasing over 40%.
Moving on to comparable sales (constant dollar basis), LULU continues to witness exceptional growth from its existing stores.
Lululemon Comparable Sales (last 4 Quarters)
| Q3’21 | Q4’21 | Q1’22 | Q2’22 |
| 26% | 22% | 29% | 25% |
Further, LULU’s growth appears to be solely organic, without reliance on markdowns or promotional activities to increase foot traffic.
And our markdown activity is in line with past penetrations 2019 pre-pandemic. And it really is — our momentum is driven through the pillars of growth and innovation of our product. So the positioning around unique innovative products through our core is resonating with our guests and our markdown behavior has not changed with no plans to change and the quarter’s results were driven by full price selling prices.
Best-In-Class Financials
Ending the quarter with 57% gross margins and 16% net margins, LULU continues to dominate its financial benchmarks relative to its athletic apparel peers.
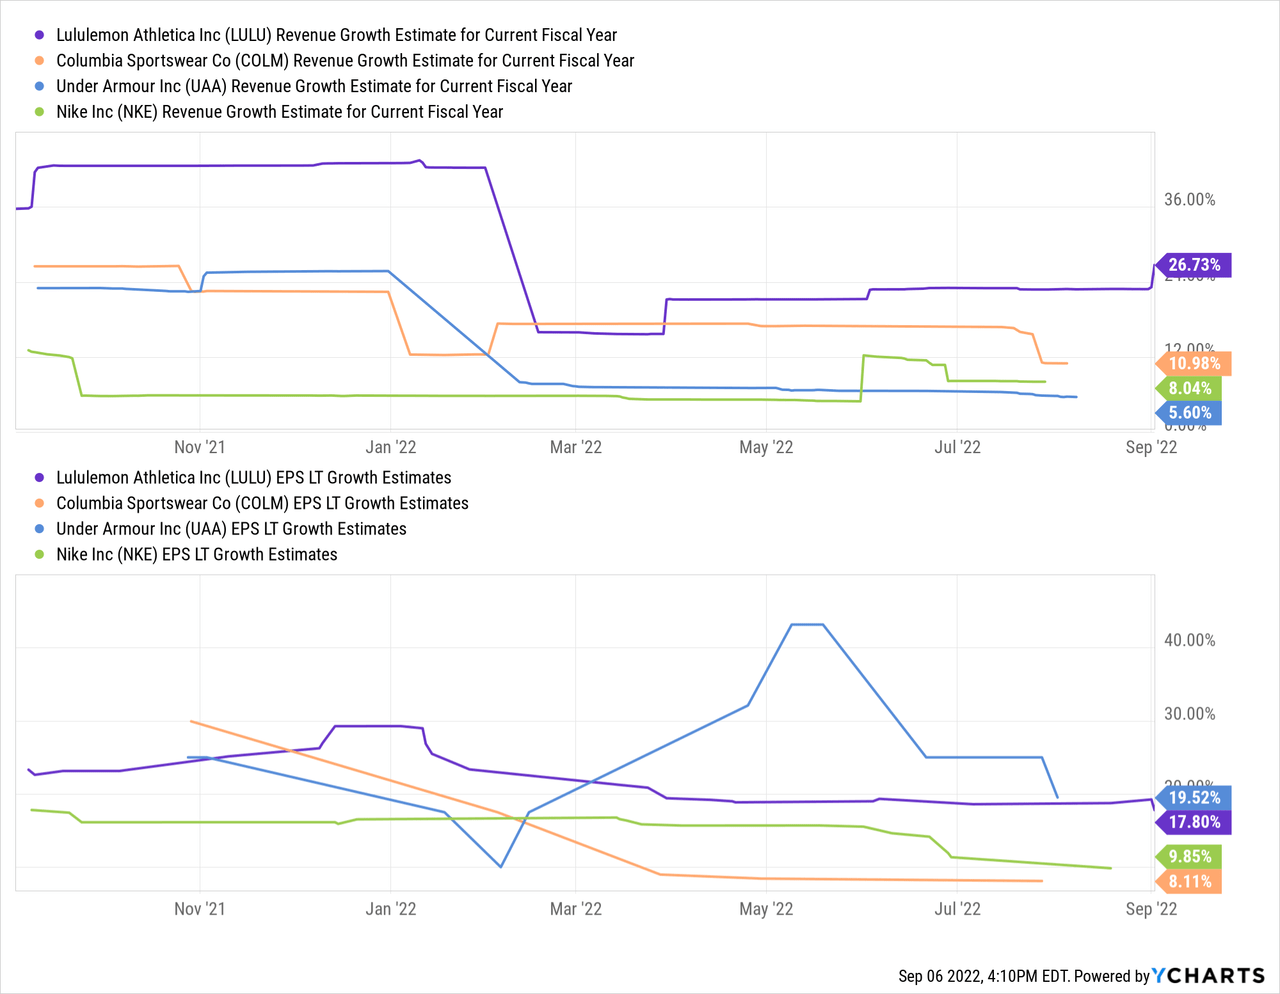
As mentioned in my first LULU piece, its peer group is identified as the following: NIKE (NKE), Under Armour (UAA), and Columbia Sportswear (COLM).
Lulu Compared to Peers (Second-Quarter)
| Peer | Gross Marin | Net Margin |
| Nike | 45% | 12% |
| Lululemon | 57% | 16% |
| Columbia | 49% | 1% |
| Under Armor | 47% | 1% |
The chart depicted above portrays LULU’s dominant financial metrics relative to its peer group and ability to remain a top dog in spite of macro headwinds.
As a premium athletic apparel retailer, customers are keeping space in their wallets for LULU, proving high brand loyalty from customers.
While the company does trade at a higher valuation than its peer group, its superior growth rates justify its higher multiple.
And lastly, as an exceptional capital allocated focused on accretion, LULU’s buybacks will continue to bolster EPS and create further shareholder value.
Share Buybacks
LULU is committed to buying back shares as a form of capital allocation. In F’21, LULU allocated over $800M to repurchases, buying back 2.2 million shares.
Author Created (Total Share Count)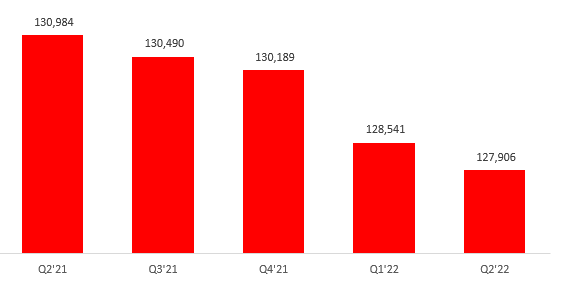
Over a longer-term horizon, it is clear LULU will continue buying back shares allowing existing investors to reap the rewards.
While there are controversies surrounding buybacks stating that companies don’t have any reinvestment initiatives, this is not the case with LULU, which continues to reinvest into its product depth and core pillars.
LULU’s EPS has been supercharged by the following two engines: reinvestment into growth and buybacks.
Author Created (Company Filings)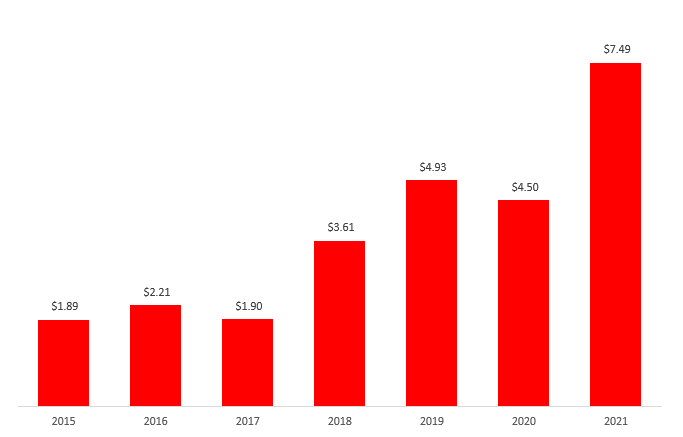
Final Thoughts
All in all, I am reiterating my “Strong Buy” recommendation on LULU.
While one quarter is by no means sufficient enough to make an investment decision, I believe this quarter taught investors that LULU is here to stay and will be able to navigate macroeconomic challenges.
It is clear that LULU has cultivated a group of loyal customers within the athletic apparel industry that are willing to pay a premium. As it continues to expand its product depth and invest in its three core pillars, one can make the argument that despite its $42B market cap, there is plenty of growth ahead.
Thus, as one of my favorite retail stocks on the market, I believe shareholders will witness exceptional returns by owning LULU for the long term.
Be the first to comment