


designer491
(This article was co-produced with Hoya Capital Real Estate)
Introduction
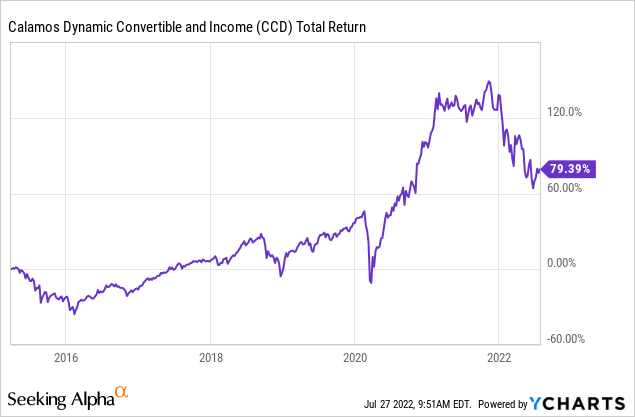
When I came across the Calamos Dynamic Convertible and Income Fund (NASDAQ:CCD) back in April, it was surprising to find a Fixed Income fund that was beating the king of Large-Cap stocks, the SPDR S&P 500 ETF (SPY). While I cannot prove it, I figured it was related to the use of convertible bonds, especially those below investment-grade. While the movement in interest rates effects convertible bond prices; unlike regular corporate ones, the stock market movement does so too. Affecting both is where investors think rates are going over the next year. Currently, Fed officials estimated that rates could rise to around 3.8% next year but ultimately settle around 2.5%. The Federal Reserve on 7/27/22 raised its benchmark interest rate by 75bps for the second straight meeting as they fight inflation that’s been running at a four-decade high. This makes the range for their benchmark federal-funds rate to between 2.25% and 2.5%.
Here I will review how CCD now looks, reference any major allocation changes since April, and compare CCD and SPY performance, again over the last five years and since the first quarter. I will also include another CEF, the Virtus AllianzGI Diversified Income & Convertible Fund (ACV), which follows a similar strategy with similar results. A link to my last ACV review is included at the end of this article.
Calamos Dynamic Convertible and Income Fund review
Seeking Alpha describes this CEF as:
The Fund will invest primarily in a portfolio of convertible securities (including synthetic convertibles, which are single instruments, or multiple instruments held in concert, that are composed of two or more securities with investment characteristics that, when taken together, resemble those of traditional convertible securities) and debt and equity income-producing securities, as well as other investments that generate current income and dividends, including but not limited to common and preferred stocks, investment grade and below investment grade (high-yield or “junk”) bonds, loans, equity-linked notes, and floating rate securities. Benchmark: Bloomberg US Corporate High Yield TR USD. CCD started in 2014.
Source: seekingalpha.com CCD
CCD has $570m in AUM and shows a Forward yield of 10.15%. The CEF has a fee structure resulting in 157bps in fees, broken down as:
- Management fees: 100bps
- Other expenses: 6bps
- Leverage costs: 51bps
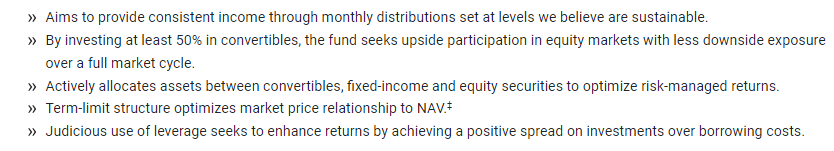
While the leverage ratio is up from my last review (40% vs 35%), assets are down some $60m. Reflecting the interest-rate environment we are in, and the above changes, the cost to employ leverage is up 12bps since April. Calamos lists five key features of their CEF:
calamos.com CCD
Feature #4 makes CCD different than most funds as the term limit will allow shareholders to elect whether or not to liquidate the fund on its 15th anniversary in 2030. I found nothing that indicated the fund will invest based on that possibility, i.e., restrict the amount of assets with maturity dates beyond that year. Indeed, looking at a complete holdings reports shows bonds maturing after 2050, though those bonds are under 4% of the portfolio.
CCD holdings review
calamos.com types
calamos.com sectors
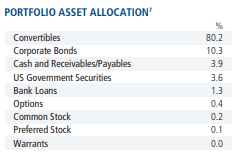
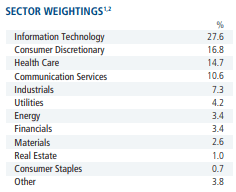
As one would expect, convertible assets dominate the fund at over 80%, with another 10% in non-convertible corporate bonds. The rest is spread over all the other asset classes. Technology stocks are the largest sector allocation, which is understandable as growth stocks find convertibles a low cost means of raising funds to expand operations. The top four sectors account for 70% of the assets held.
With a majority of the bonds not rated, the following table loses some of its value.
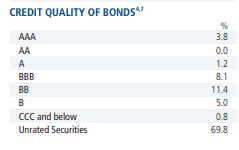
calamos.com ratings
Of those rated, there is a slight tilt toward ones below investment-grade; even the IGs are mostly in the lowest tier. Over 90% of the weight is from US-based companies, with Ireland coming in second. Based on their tax structure, most likely US companies that moved their headquarters there. The holdings list shows all bonds are price in USDs. The portfolio has weighted-average duration of 2.4 years; WAM of 3.4 years. This is reflected in the maturity breakdown.
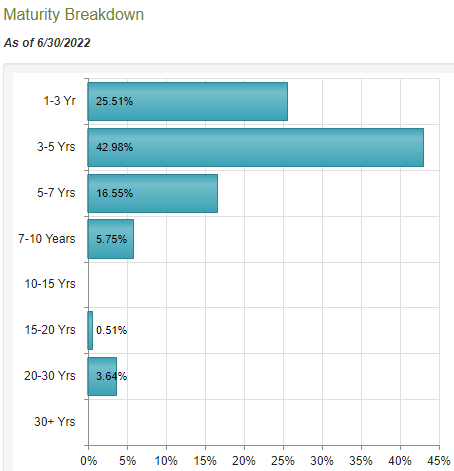
CEFConnect.com
Higher rates and economic uncertainty, combined with 25+% of the portfolio maturing within three years, should allow CCD to add holdings with better income generating bonds.
Top holdings
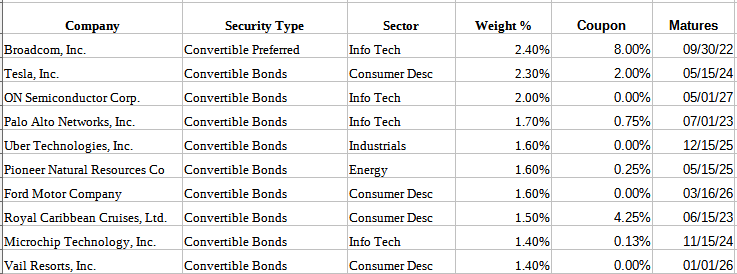
calamos.com; compiled by Author
The Top 10, out of about 600 holdings, are 17.5% of the portfolio at the end of June, the last holdings data available. The most recent full holdings listing is in the semi-annual report from April 30th.
CCD distribution review
Like many CEFs, Calamos has adopted a Managed Distribution Policy, which is defined as:
Closed-end fund investors often seek a steady stream of income. Recognizing this important need, Calamos closed-end funds adhere to a managed distribution policy in which we aim to provide consistent monthly distributions through the disbursement of the following:
• Net investment income
• Net realized short-term capital gains
• Net realized long-term capital gains
• And, if necessary, return of capital We set distributions at levels that we believe are sustainable for the long term. Our team focuses on delivering an attractive monthly distribution, while maintaining a long-term emphasis on risk management. This policy was adopted in 2018.
Source: calamos.com CCD Annual Report
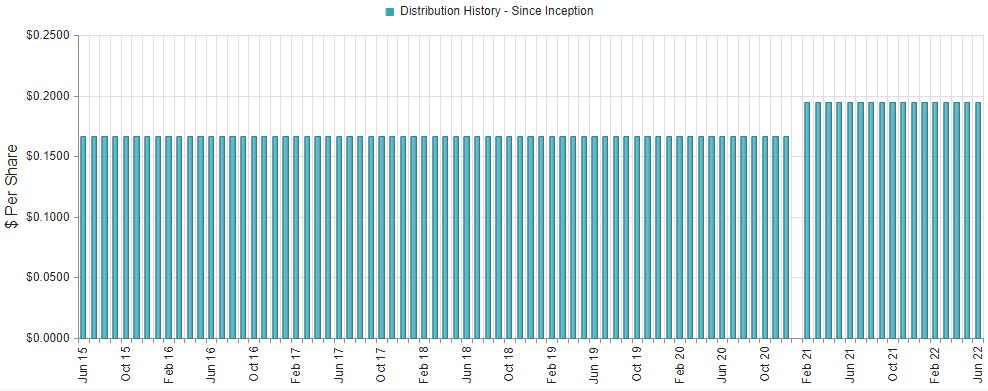
CEFConnect.com
Starting in 2021, the monthly payout went to $.195 from $.167, where it stood since inception. So far in 2022, most of the payouts have come from investment gains, none from ROC.
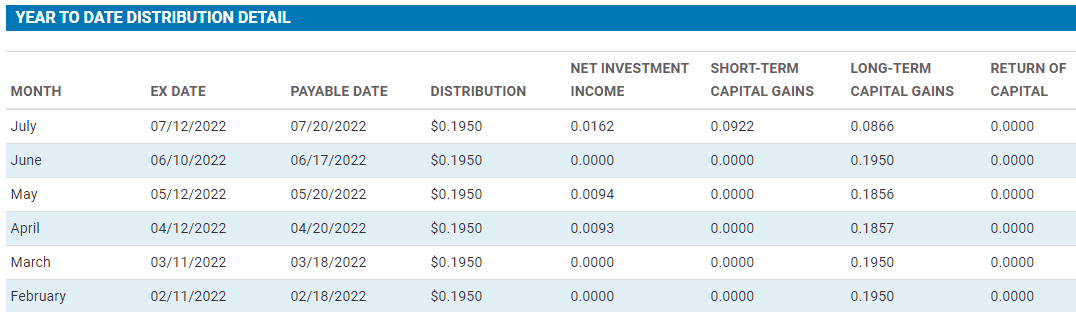
calamos.com CCD DVDs
The January payment was declared in December, which is why it doesn’t appear in the above table. The WAC for CCD is only 1.76%, which explains why CCD is highly dependent of trading activity to generate the funds needed to keep the yield near 10%.
CCD price and NAV review
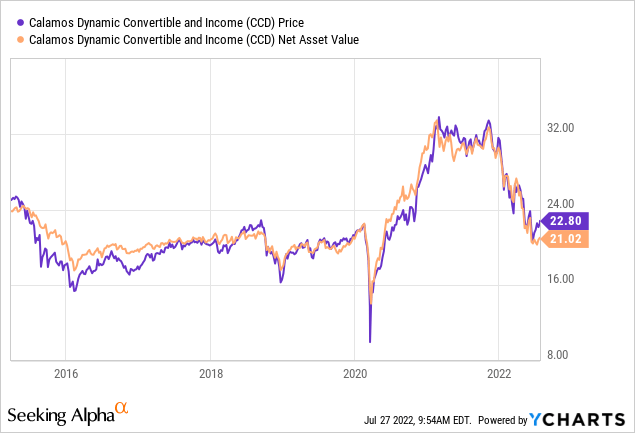
Both the price and NAV are down from the initial $25 value. Neither measures CAGR, which we will see later. The next chart shows the relationship between price and NAV, which currently is at a high 7.14%.
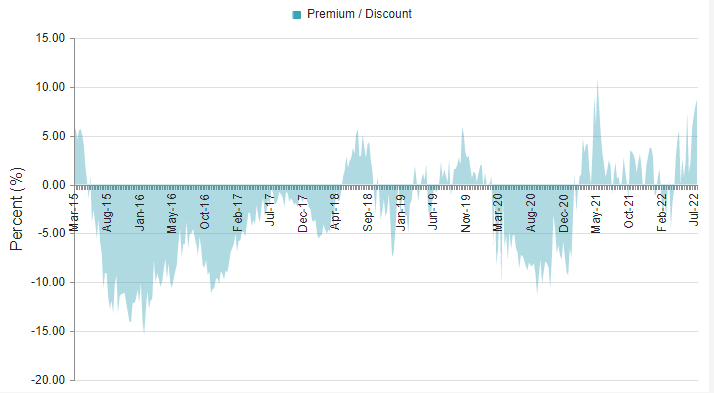
CEFConnect.com
Except for the spike in May of 2021, the current premium is at historical levels for CCD, which is reflected in its 2.00 1-Year Z-score, which is a negative indicator. As seen in the prior chart, the excessive premium is due to NAV falling faster the price, not that the CEF has performed well so far in 2022.
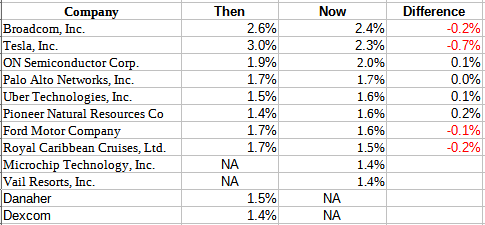
Then versus Now
I compared how the asset mix shifted since the end of March, which is data that was available when the April article was written. There are two reasons for the difference: price movement and executed transactions.
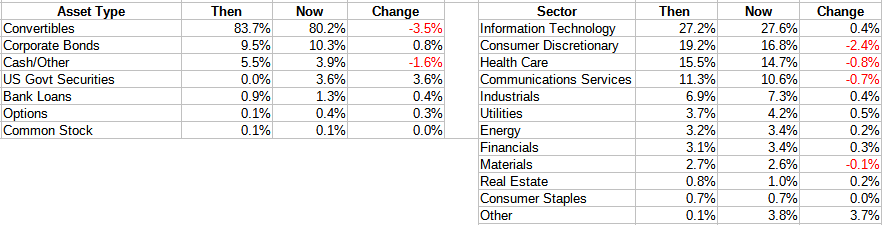
calamos.com; compiled by Author
On the asset side, CCD had a lower percent in its main category, convertibles, and they added US Government bonds which were not owned at the end of the first quarter. The biggest change was drop in the exposure to Consumer Discretionary assets, a sector whose stocks were hit hard in the second quarter. While the weights have changed, the Top 8 positions match except for the ordering. That said, CCD lists its turnover rate at a large 48%, meaning the average holding is only for six months.
calamos.com; compiled by Author.
I did not save share level holdings data for the first article, so why the allocation percent moved cannot be analyzed in depth. I also did not save rating or report them in the prior article so I do not have data to compare.
Portfolio strategy
So the big question is “Did CCD outperform SPY in the second quarter and is it still ahead over the most recent 5-year period?”. First the recent results.
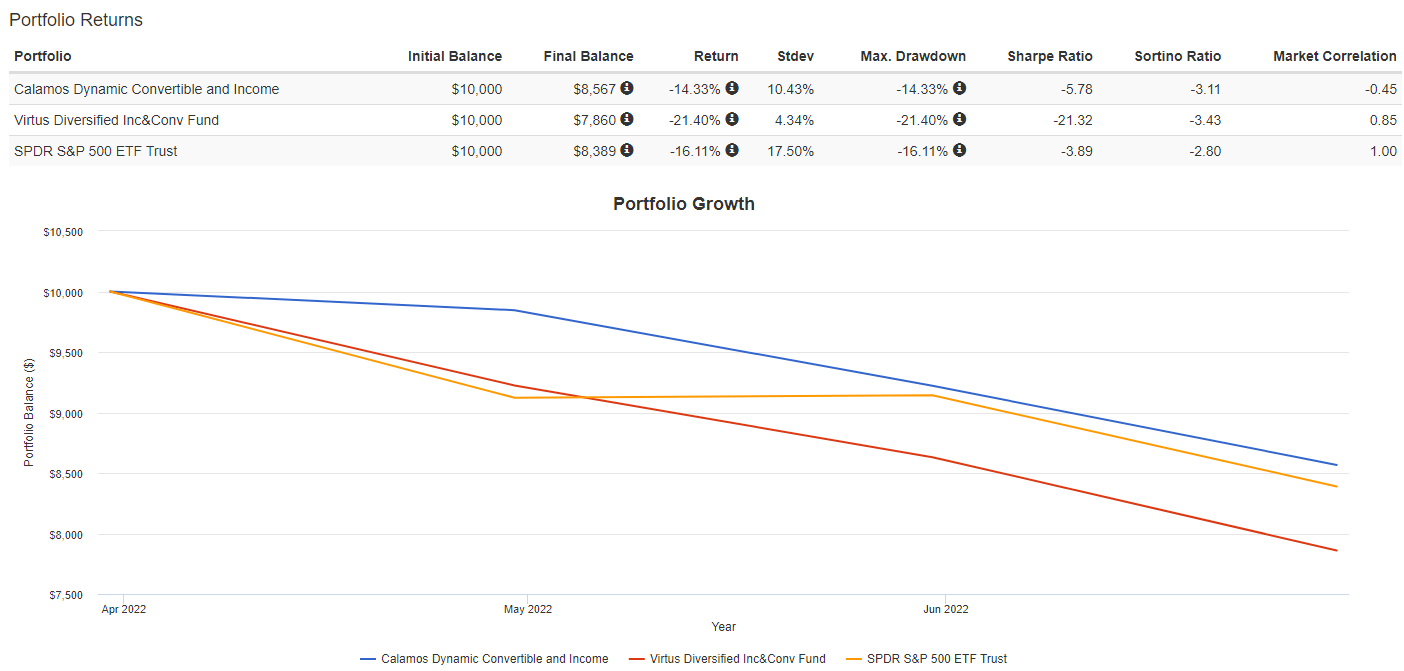
PortfolioVisualizer.com
Over the past quarter, CCD was the best performer, but still down 14%, including payouts. A large part of that top performance reflects CCD going from -4.65% discount to a 5.36% premium during the quarter. ACV’s discount moved very little, staying near 6%. Of course, SPY seldom has a price/NAV divergence.
Over the five-year period ending in June, the three funds were very close.
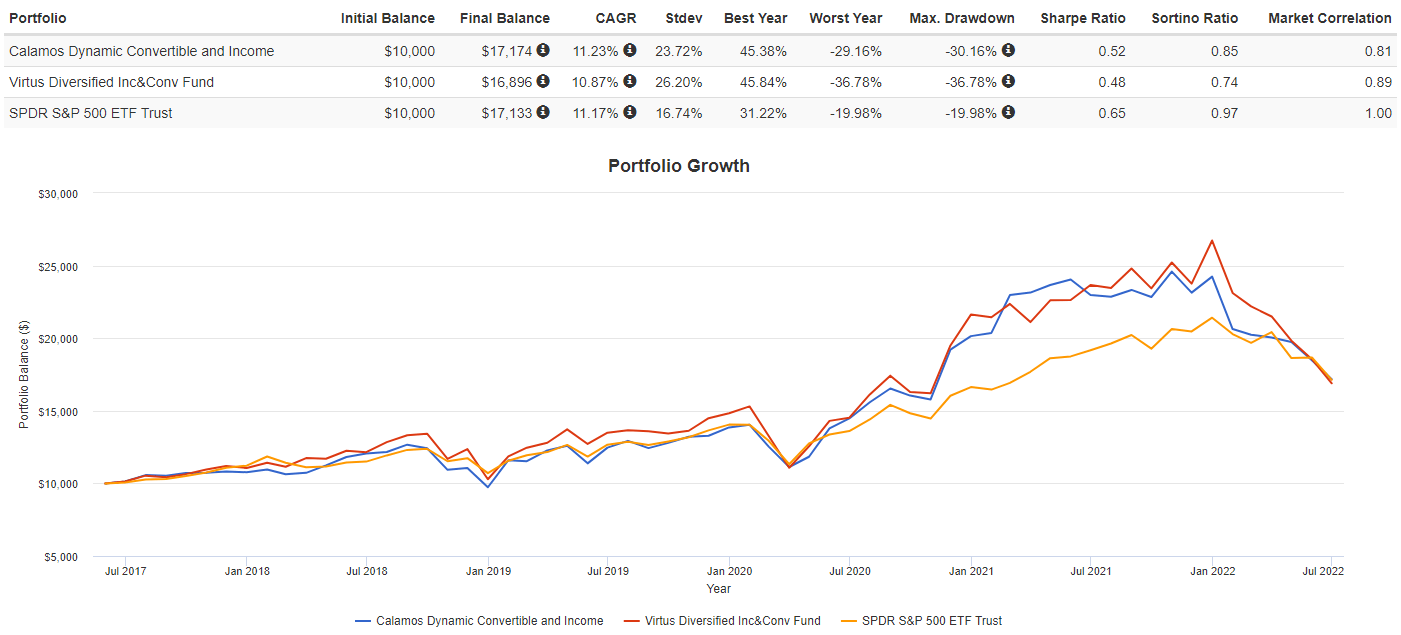
PortfolioVisualizer.com
Measure by the two risk ratios, SPY was the best performer and has handled the change in interest rates better than the CEFs have. If we add two more years, back to when ACV started, SPY performance becomes a clear winner.
Final thought
An important part of an investor’s due diligence on any fund is asking, “Are there better, similar funds?”. ACV is another fixed income CEF that investors can start their due diligence, which I recently reviewed: ACV: A Convertible Securities CEF That Adds Equities To The Mix. ACV also has a 10% yield but currently sells at a 3.86% discount.
Be the first to comment