


Darren415
This article was first released to Systematic Income subscribers and free trials on Aug. 16.
In this article, we catch up on Q2 results from the Business Development Company Blackstone Secured Lending Fund (NYSE:BXSL). BXSL is currently trading at a dividend yield of 8.4% and a valuation of 97%.
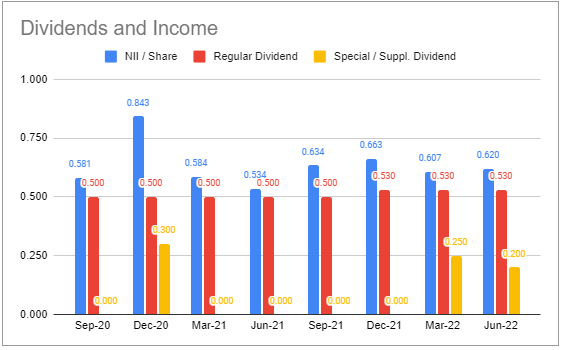
The company pays a base dividend of $0.53 and will pay a final special dividend of $0.20 in November this year. The series of special dividends this year was put in place in order to mitigate lock-up expirations from its recent IPO. We expect the company to raise its base dividend or put in place supplemental dividends given its very high dividend coverage which we expect to move even higher on the back of the tailwind from rising short-term rates.
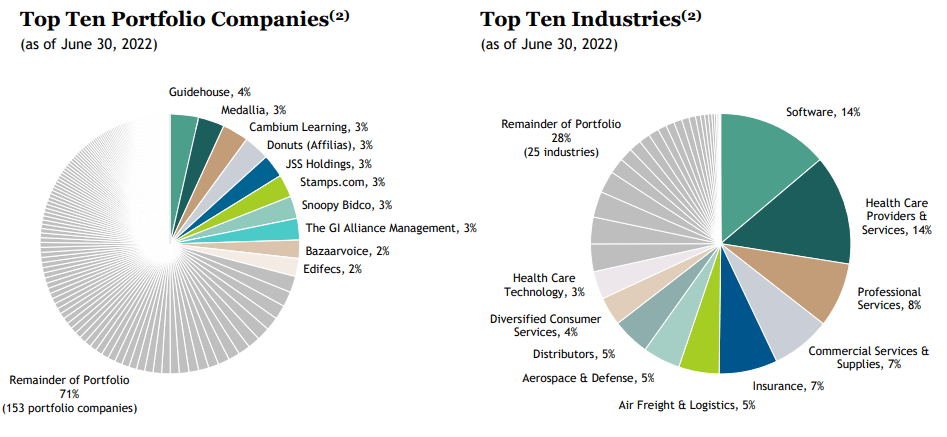
The company’s less cyclical sector focus of software, healthcare, professional services and others is not out of line with the rest of the BDC sector.
BXSL
Over the past year BXSL has significantly diversified its portfolio by increasing its portfolio companies from 111 to 163 – about 20% above the average BDC. It also moved towards larger companies, increasing its weighted-average EBITDA from $74m to $149m. There is some argument about which part of the middle-market segment is best. As would be expected, BXSL, just as ARCC, takes the view that larger companies tend to boast more diversified revenue streams, broader customer base, deeper management and other more attractive features relative to smaller companies.
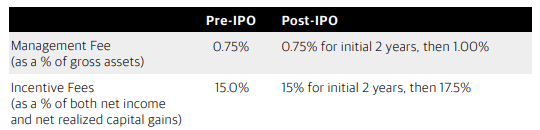
It is also worth highlighting the company’s low fee structure. For a two year period after its Oct-2021 IPO, the company will charge 0.75% as its management fee (to rise to 1% in late 2023) and incentive fees will be 15% (to rise to 17.5% in late 2023) – both well below the sector average. What’s important to note is that even when the fees rise to their full level in 2023 they will be at the bottom of externally-managed BDC fees. If there is an unfriendly element it is the low hurdle of 6% for the net income incentive fee, whereas most BDCs start at least at 7%, though a 6% lower hurdle is shared by a handful of other BDCs. BXSL also has a 3-year look back hurdle which is a great feature to see – less than half of BDCs have any total return lookback hurdle in their fee structure. The fee structure is summarized in the table below.
BXSL
Quarter Update
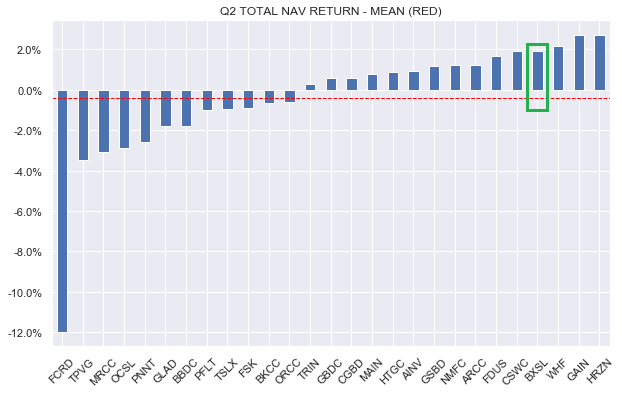
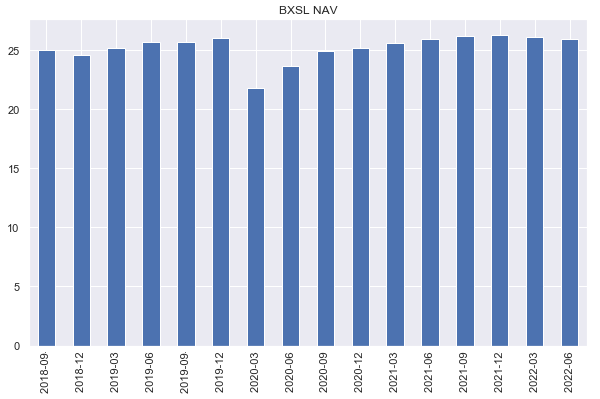
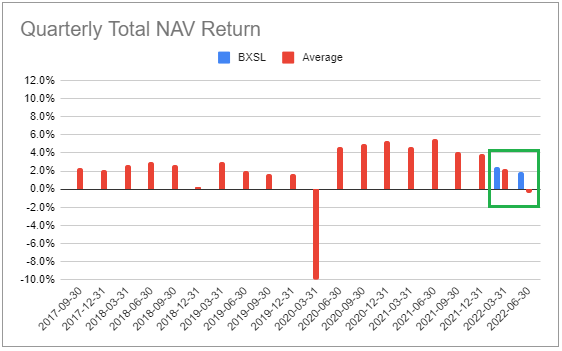
BXSL NAV fell a bit less than 1% which puts it near the top-end of the Q2 BDC reports in our 29-name universe. The company’s total NAV return for Q2 was a very strong 1.9% or more than 2% above the sector average.
Systematic Income
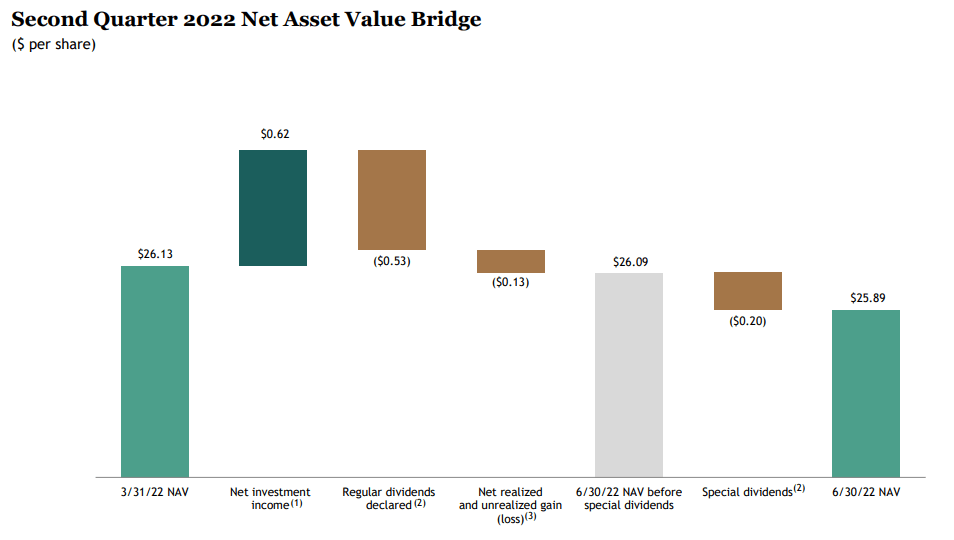
Much of the drop in the NAV was due to the special dividend which was in excess of the company’s net income. The combination of realized and unrealized net losses was about half of one percent.
BXSL
The company’s NAV is very close to its pre-COVID level which is always good to see.
Systematic Income
BXSL delivered a 2% gain in net income (blue bars) from Q1 though the Q2, primarily driven by higher short-term rates.
Systematic Income BDC Tool
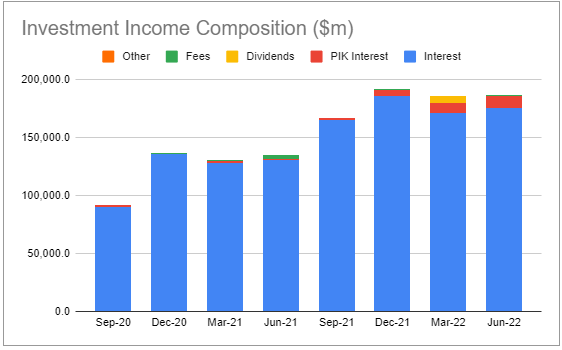
Historically, fee income from prepayments has not been a large driver of net income so in this sense the broader slowdown in prepayments across the sector has not hurt BXSL to the same extent as other companies.
Systematic Income BDC Tool
Over Q2 and so far in Q3 the company bought back $121m worth of shares at an average price of $23.94 or 7% below the Q2 NAV of $25.89 which was and will be accretive to the NAV. There is $141m remaining in the buyback program.
Income Dynamics
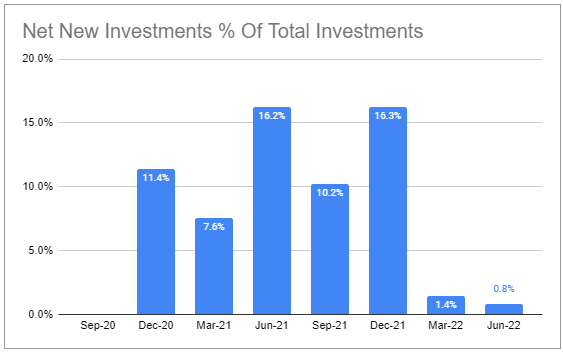
BXSL continues to run with positive net new investments which will provide an additional tailwind to income.
Systematic Income BDC Tool
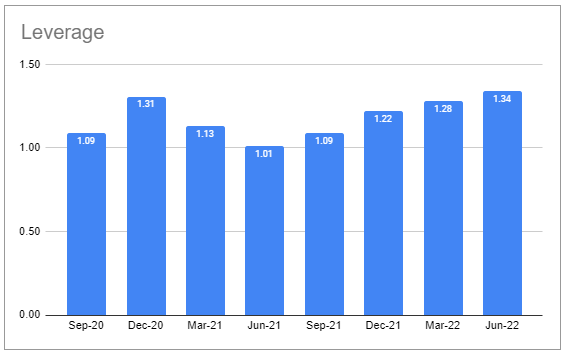
It also explains the growth in leverage. The company finished the quarter at leverage of 1.34x which is well above its 1.25x target (on the call management called this “slightly above” which tortures the meaning of “slightly” in our view). They also confirmed they are comfortable with this level in the short-term so there shouldn’t be an income headwind from deleveraging.
Systematic Income BDC Tool
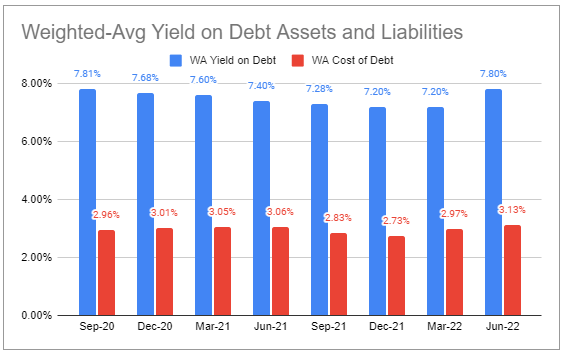
The company’s interest expense rose to 3.1% which is 0.5% below the sector average. The weighted-average yield on assets increased by 0.6% or double the increase in interest expense.
Systematic Income BDC Tool
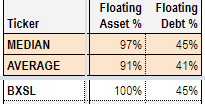
The company has an above-average amount of floating-rate assets (100% vs. 91% average), a slightly higher level of floating-rate debt and an above-average level of leverage. Net net, this gives it a higher income beta to rising short-term rates relative to the sector.
Systematic Income BDC Tool
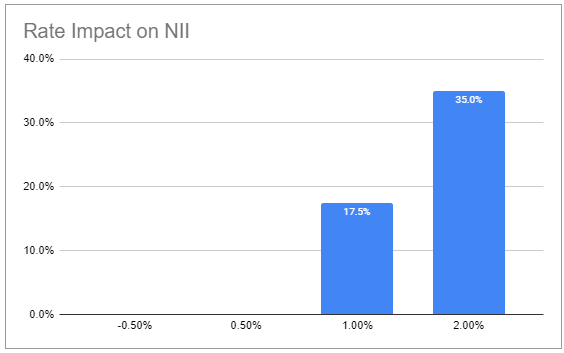
All else equal, a 1% rise in short-term rates relative to their Q2-end levels will boost net income by 17.5% (about 6% higher than the sector average). For comparison, 3-month Libor has already risen by 0.7% since the end of Q2.
To give some perspective on its net income, the average base rate (i.e. Libor or SOFR) accrued over Q2 was 1.1% despite Libor being 2.3% at the end of June (and 2.9% as of this writing). This gives a sense of the lag with which an increase in short-term rates gets passed through to income. We don’t expect net income to increase by the full “theoretical” amount but the bump should still be substantial.
Systematic Income BDC Tool
About 13% of the company’s fixed-rate debt will mature in 2023 which will very likely push its interest expense slightly higher if the debt is refinanced and credit yields remain roughly where they are.
Portfolio Quality
Portfolio non-accruals continue to run at zero.
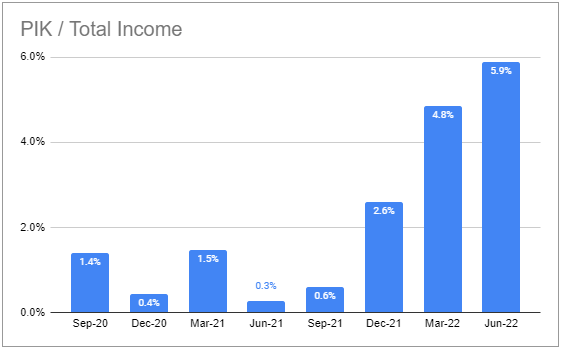
PIK income has grown to about the sector average level and is worth watching, though it’s not always an indicator of falling quality.
Systematic Income BDC Tool
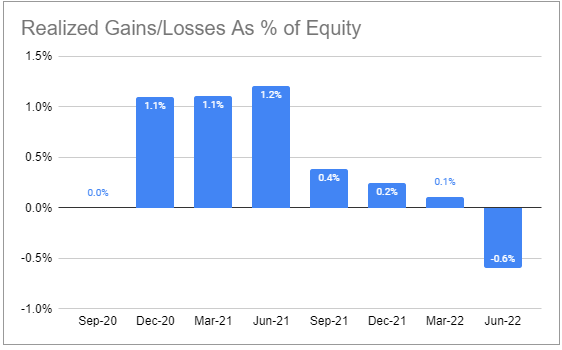
Q2 registered a small realized loss – a shift from a previously very strong net realized gain profile.
Systematic Income BDC Tool
Overall, management appears quite happy with portfolio quality and the various metrics don’t run counter to that. The company’s less cyclical allocation, high first-lien exposure, relatively low asset-side yields and a very low historical annualized loss rate in US lending of 0.11% is indicative of a higher-quality underwriting.
The company’s average interest coverage on its loans is 2.7x. At Libor of 4.3% (versus a 3.9% market consensus peak and 2.9% level as of today) the percentage of loans with less than 1x of interest coverage is expected to be 4% – not a huge amount.
Valuation And Return Profile
The valuation of BXSL has deflated over time in its post-IPO period on the back of an initially expensive level as well as a series of lock-up expirations which are now behind it. Over the last couple of months the company has traded at a lower valuation than the broader sector.
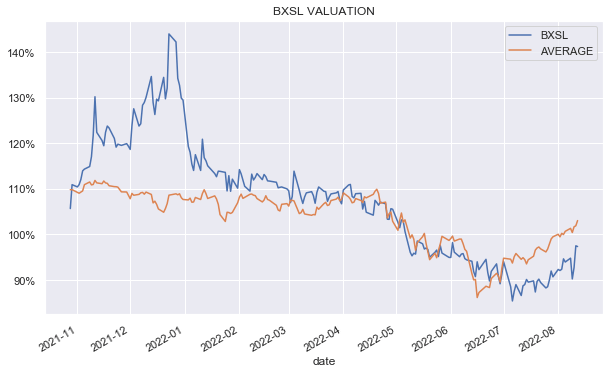
Systematic Income
This chart shows the differential of its valuation versus the sector, showing that it currently trades around 5% below the sector average valuation.
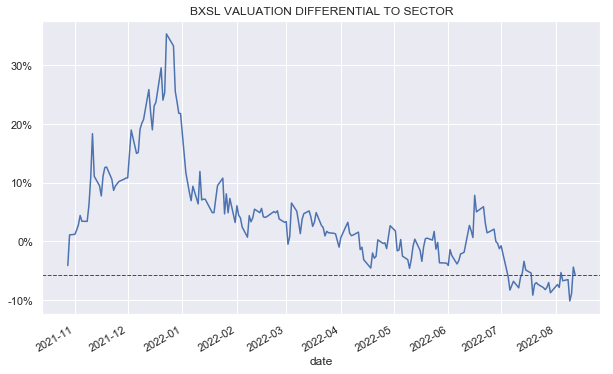
Systematic Income
The company does not have a long track record as a public company. The two quarters that we have on record shows that it has outperformed the sector in both.
Systematic Income BDC Tool
Overall, the company’s performance as a public entity along with its strong performance as a private entity and its low fee structure suggests to us that it should trade at a higher valuation than the broader sector over time.
Points Of Differentiation
Our goal in income allocation is to always keep an eye on diversification even as we pursue attractive opportunities in our bottom-up analysis. As many investors know, despite their BDC status, BDCs can actually pursue somewhat different investment strategies and it can make sense for investors to diversify across these strategies. These strategy differences lie primarily along the company EBITDA target and portfolio (the balance of equity vs debt as well as type of debt) dimensions.
BXSL operates at the upper end of the middle-market segment with a weighted-average EBITDA of $149m which puts it in roughly the same space as OCSL and ARCC. What makes it different from ARCC and OCSL is a very high proportion of first-lien holdings at 97% (versus 54% for ARCC and 77% for OCSL).
Something else that differentiates BXSL is the sheer size of its broader operating platform. The platform attempts to proactively support portfolio companies through procurement, cross-selling, cyber security, analytics and other areas. This is not going to be the decisive factor in portfolio performance as there are other large credit firms that have underwhelming BDCs, but it’s nice to have, all else equal.
Takeaways
We continue to view BXSL as relatively cheap to the sector, though, clearly not as cheap as it was in the last couple of months when we added it to our High Income Portfolio. The company should enjoy two valuation tailwinds. First, with its lock-up expirations behind it, a significant headwind is gone and BXSL is likely to start behaving like the rest of the BDC space. And two, a pattern we have highlighted a few times in the BDC sector is that BDCs with consistently strong performance tend to see their valuations rise over time. Because BXSL has a short public track record (though a strong private track record) it is not yet a household name for retail investors. However, if, as we expect, its performance remains strong, its valuation should move above the sector average.
Be the first to comment